Implications
Measurement of detailed milk fat composition at individual cow level is of major interest for the dairy industry because of the expected relation with human health. Therefore, the method of analyzing milk fat composition needs to be rapid and suitable for extensive recording. Our study shows that mid-infrared spectrometry (MIR) can be used to accurately predict detailed milk fat composition from different cattle breeds in the Netherlands.
Introduction
Bovine milk fat consists of a range of different fatty acids (FAs), both unsaturated fatty acids (UFAs) and saturated fatty acids (SFAs), and its relatively large amount of SFA causes some debate about the role of bovine milk in a healthy diet (Palmquist et al., Reference Palmquist, Stelwagen and Robinson2006). Clear variation in fat content and milk fat composition can be found among cows (Soyeurt and Gengler, Reference Soyeurt and Gengler2008). Milk fat composition varies with both environmental factors (e.g. feed regime; Palmquist, Reference Palmquist2006) and genetics (Soyeurt and Gengler, Reference Soyeurt and Gengler2008; Stoop et al., Reference Stoop, van Arendonk, Heck, van Valenberg and Bovenhuis2008). Changing FA composition through the feed regime or genetic selection requires a precise and regular measurement.
To measure the FA composition in milk, several methods can be used, which differ in throughput level, accuracy, workload and costs. The most accurate method is gas–liquid partition chromatography (GC). This largely implemented and regularly used approach quantifies the concentration of individual FAs in fat (Gander et al., Reference Gander, Sampugna and Jensen1962; Christie, Reference Christie1998). The major advantage of GC is the possibility of measuring the individual FA proportions with high accuracy (Smith, Reference Smith1961; Christie, Reference Christie1998) even if the content of this FA is low. This method, however, is expensive and time consuming and therefore less suitable for extensive and regular recording. Another method of analyzing milk fat composition, MIR, is rapid and less expensive in case of extensive use (Wilson and Tapp, Reference Wilson and Tapp1999; Soyeurt et al., Reference Soyeurt, Dardenne, Dehareng, Lognay, Veselko, Marlier, Bertozzi, Mayeres and Gengler2006). MIR is routinely used in milk recording schemes to measure lactose, urea, total fat and protein percentages in bovine milk (Etzion et al., Reference Etzion, Linker, Cogan and Shmulevich2004; Bobe et al., Reference Bobe, Lindberg, Freeman and Beitz2007). MIR was used by Soyeurt et al. (Reference Soyeurt, Dardenne, Dehareng, Lognay, Veselko, Marlier, Bertozzi, Mayeres and Gengler2006 and Reference Soyeurt, Dehareng, Gengler, McParland, Wall, Berry, Coffey and Dardenne2011) and Rutten et al. (Reference Rutten, Bovenhuis, Hettinga, van Valenberg and van Arendonk2009) to estimate calibration equations predicting the FA concentrations in milk (g/dl of milk) and milk fat (g/100 g of fat), and these equations were subsequently validated. In these studies, the predictions have low accuracy for FAs that are present in low concentrations, such as the trans and unsaturated 14, 16 and 18 FAs.
Accuracy and bias in calibration equations may also be affected when there are differences between the samples used to estimate the calibration equations and the samples for which FA composition is predicted using the prediction equations. In Rutten et al. (Reference Rutten, Bovenhuis, Hettinga, van Valenberg and van Arendonk2009), calibration equations were based on milk samples only from Holstein–Friesian (HF) cows. In this latter study, analysis of milk samples collected in both winter and summer indicated that season has a limited effect on prediction accuracy but generally a large effect on prediction bias. This indicates that factors causing structural differences between FA composition of groups of animals such as season and breed can affect predictability of calibration equations.
The aim of this study was to investigate the accuracy and bias in predicting detailed FA composition from MIR spectra of milk from four cattle breeds in the Netherlands, using calibration equations based on milk samples collected from Belgian, Irish and Scottish cattle of partly different breeds.
Material and Methods
Calibration equations
In this study, prediction of the composition of 11 individual FAs and 3 groups of FAs using MIR spectrometry using calibration equations was validated. These calibration equations were developed in the EU FP 7 project RobustMilk, using a data set with MIR spectra and GC results of 1236 milk samples. The methodology used to develop the calibration equations is explained by Soyeurt et al. (Reference Soyeurt, Dehareng, Gengler, McParland, Wall, Berry, Coffey and Dardenne2011) for the calibration equations, but it should be noted that in our study updated versions of the calibrations were used, which are based on 1236 instead of 517 milk samples.
For all 1236 milk samples, the MIR analysis was performed using a Fourier-transformed interferogram with a region of 1000 to 5000/cm (MilkoScan FT 6000, Foss Electric, Hillerod, Denmark). The detailed FA composition of these 1236 milk samples was obtained using GC realized at the milk laboratory of the Walloon Agricultural Research Centre (Gembloux, Belgium). The GC outputs were generated by analyzing methyl esters prepared from milk fat as described in ISO Standard 15 884 (ISO–IDF (International Organization for Standardization–International Dairy Federation), 2002) and the GC was equipped with a CPSil-88 column (Varian Inc., Palo Alto, CA, USA) with a length of 100 m and an internal diameter of 0.25 mm.
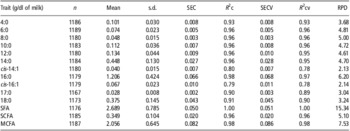
The 1236 milk samples were collected from herds in Ireland, Scotland and the Walloon Region of Belgium with purebred and crossbred cows from different breeds, that is, HF, Jersey (JER), Red and White, Normande, Montbeliarde and dual-purpose Belgian Blue. This multiple breed and multiple country composition of the data set was chosen to cover a wide range of the variability of FA in bovine milk in order to improve the robustness of the developed calibration equations. The calibration equations were developed from three MIR regions located between 926 and 1600/cm, 1712 and 1809/cm and 2561 and 2989/cm. The method used to relate MIR spectra to FA data was partial least square regression after a first derivative pre-treatment on spectral data to correct the baseline drift. A T-outlier test was also used during the calibration process to delete potential GC outliers. Therefore, the final number of samples included in each calibration equation varied following the considered FA. Descriptive statistics of the RobustMilk calibration equations are given in Table 1. Note that this is an updated version of the prediction equations described by Soyeurt et al. (Reference Soyeurt, Dehareng, Gengler, McParland, Wall, Berry, Coffey and Dardenne2011), in the sense that the current prediction equations are based on ∼4.5 times more samples. In addition to the number of samples included in the calibration data set, the mean and the standard deviation (s.d.) of the FA content measured by GC, the standard error of calibration (SEC), the calibration coefficient of determination (R 2c), standard error of cross-validation (SECV), cross-validation coefficient of determination (R 2cv) and the ratio of s.d. to SECV (RPD) are shown. The R 2c is the square of the correlation coefficient between the predicted and the reference GC values.
Descriptive statistics of RobustMilk FA calibration equations and the data used to derive the equations

FA = fatty acid; n = number of samples included in the calibration equation; Mean = mean of gas chromatographic data; s.d. = standard deviation of gas chromatographic data; SEC = standard error of calibration; R 2c = calibration coefficient of determination; SECV = standard error of cross-validation; R 2cv = cross-validation coefficient of determination; RPD = the ratio of s.d. to SECV; SFA = the saturated FAs 4:0 to 22:0 including iso- and ante-iso FAs; SCFA = short-chain FAs 4:0 to 10:0; MCFA = medium-chain FAs 12:0 to 16:0.
During the development of the updated calibration equations, a first assessment of the robustness of the predictions was done by a cross-validation approach to calculate the R 2cv and SECV using the same approach as described by Soyeurt et al. (Reference Soyeurt, Dehareng, Gengler, McParland, Wall, Berry, Coffey and Dardenne2011).
Validation data set
Between December 2008 and March 2009 in the Netherlands, that is, in the winter season, a total of 190 cows were sampled once during morning milking. Samples were treated immediately with 0.03% (w/w) sodium azide to avoid microbiological growth. Cows belonged to four breeds: Dutch Friesian (DF; 47 samples from 3 farms), Meuse-Rhine-Yssel (MRY; 52 samples from 3 farms), Groningen White Headed (GWH; 45 samples from 3 farms) and JER (46 samples from 3 farms). The cows were selected by farmers to reflect variations in age, parity, stage of lactation and ancestry. On all farms, cows were kept indoors in the studied period and milked twice a day with conventional milking systems. The number of sampled cows per herd ranged from 6 to 24, and the selected farms each had between 35 and 120 cows. The cows were either located at organic or conventional farms. For each breed samples were collected at one or two organic farms and the remainder farms were conventional. Differences in FA composition in milk between the four breeds in this data set are presented by Maurice-Van Eijndhoven et al. (Reference Maurice-Van Eijndhoven, Hiemstra and Calus2011). Briefly, ranges of individual FA content generally overlapped between breeds, apart from several FAs and groups of FAs of JER and GWH.
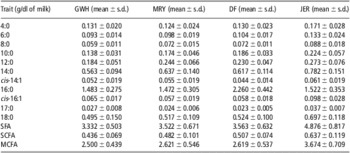
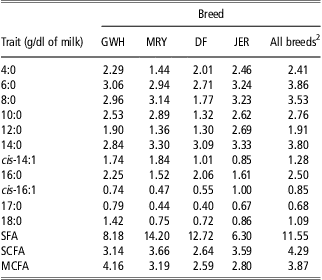
Each milk sample was analyzed using both GC and MIR. The mean and standard deviation of the FA content of each of the 11 individual FAs and the 3 groups of FAs obtained using the GC are given in Table 2. The relative variability, which was examined by calculating the coefficient of variation (results not shown), between the different FAs was highest for the cis-14:1 (range 31.1 to 35.8) and cis-16:1 (range 26.2 to 39.1) and lowest for the 4:0, 6:0, 8:0 and total group of short-chain FA (SCFA; range 14.6 to 25.0). GC analysis was performed at the laboratory of Qlip N.V. (Leusden, The Netherlands). The GC outputs were generated by analyzing methyl esters prepared from milk fat as described in ISO Standard 15 884 (ISO–IDF, 2002) and the GC was equipped with a Varian Fame Select CP 7420 column (Varian Inc., Palo Alto, CA, USA) with a length of 100 m and an internal diameter of 0.25 mm. The MIR analysis was performed using a Fourier-transformed interferogram with a region of 1000 to 5000/cm (MilkoScan FT 6000, Foss Electric, Denmark) at the laboratory of Qlip N.V. (Zutphen, The Netherlands). The validation data set was independent of the calibration set developed in the RobustMilk project (i.e. different labs for GC and MIR analysis).
The mean and standard deviation of gas chromatographic measurements of the validation data for all traits of the individual breeds

GWH = Groningen White Headed; MRY = Meuse-Rhine-Yssel; DF = Dutch Friesian; JER = Jersey; FA = fatty acid; SFA = the saturated FAs 4:0 to 22:0 including iso- and ante-iso FAs; SCFA = short-chain FAs 4:0 to 10:0; MCFA = medium-chain FAs 12:0 to 16:0.
Validation
RobustMilk calibration equations (Table 1) were used to predict detailed milk composition of the samples recorded in the validation data set for 11 individual FAs 4:0, 6:0, 8:0, 10:0, 12:0, 14:0, cis-14:1, 16:0, cis-16:1, 17:0, 18:0 and the 3 groups of FAs, that is, total SFA (SFA 4:0 to 22:0 including iso- and ante-iso FAs), short-chain FA (SCFA; 4:0 to 10:0) and medium-chain FA (MCFA; 12:0 to 16:0). SFA = the saturated fatty acids 4:0 to 22:0 including iso- and ante-iso FAs; SCFA = 4:0 to 10:0; MCFA = 12:0 to 16:0. Owing to the lack of agreement between the GC analyses of the calibration and validation data set methods for the long-chain unsaturated FAs and their related FA groups (i.e. total unsaturated, monounsaturated, polyunsaturated and long-chain FAs), these FAs and groups of FAs were considered in this study. This lack of agreement was due to differences in separation of the long-chain unsaturated FAs during the GC analyses of the calibration and validation data sets because the capillary columns used were different. For the other FAs, of which the calibration equations are validated in this study, the separation during the GC analysis was similar. The FA traits were predicted on the basis of milk (g/dl) because these predictions are more accurate than on the basis of fat (g/100 g; Soyeurt et al., Reference Soyeurt, Dardenne, Dehareng, Lognay, Veselko, Marlier, Bertozzi, Mayeres and Gengler2006; Rutten et al., Reference Rutten, Bovenhuis, Hettinga, van Valenberg and van Arendonk2009; Soyeurt et al., Reference Soyeurt, Dehareng, Gengler, McParland, Wall, Berry, Coffey and Dardenne2011).
The accuracy of the RobustMilk predictions was evaluated using the root mean squared error of prediction (SEV), the coefficient of determination (validation R 2) and the ratio of the s.d. of the validation data set to the SEV (RPDv). Calibration equations with RPDv above 3.0 can be considered as good predictors (Williams and Sobering, Reference Williams and Sobering1993).
The SEV was calculated as
 $${\rm{SEV}}\, = \,\sqrt {\frac{{\mathop{\sum}\limits_{i\, = \,1}^N {\,{{{({{{\hat{y}}}_i}{\rm{ - }}\,{{y}_i})}}^2} } }}{n}}, $$
where  $$)(-->$<>{{\hat{y}}_i}<$>
<!--$$ is the predicted value obtained for the sample i; yi is the reference GC value of sample i; n is the number of samples in the validation set. The approach to calculate SEV is in line with the approach to calculate SEC and SECV, which are described by Soyeurt et al. (Reference Soyeurt, Dehareng, Gengler, McParland, Wall, Berry, Coffey and Dardenne2011).
The prediction bias was assessed using the average prediction error  $$)(-->$<>({{\hat{y}}_i}\,{\rm{ - }}\,{{y}_i})<$>
<!--$$and slope (β 1) of the linear regression, with the GC values as dependent and the predicted values as independent variable. To be able to compare the average prediction error of the calibration equations across traits and breeds, this measure is expressed as a percentage of the mean of the gas chromatography values.
Results
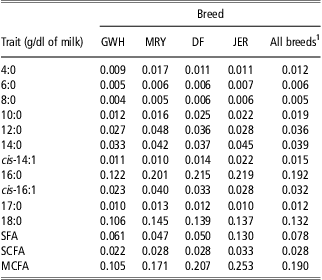
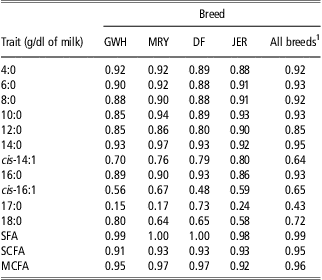
For most traits, the SEV was lowest for the predicted FA contents in GWH milk, except for the individual FA cis-14:0 and the group of FA SCFA (Table 3). The SEV for the predicted FA contents in JER milk was highest for all groups of FAs and the individual FAs 6:0, 14:0, cis-14:0 and 16:0, except for the individual FAs 4:0, 12:0, cis-16:1, 17:0 and 18:0, of which the SEV was highest for MRY. The validation R 2 of the predictions of the individual FAs 4:0, 6:0, 8:0, 10:0, 12:0, 14:0, 16:0 and for the groups of FAs SFA, SCFA and MCFA for all breeds were above 0.80 (Table 4). The validation R 2 for the individual FA 17:0 was lowest over all breeds (0.43). The FA composition of milk from DF cows was based on the calculated validation R 2 predicted most accurately with an average R 2 of 0.84. The average validation R 2 of the predicted FA composition of milk from GWH was generally lowest (0.81). The long-chain FAs 17:0 and 18:0 and medium-chain FAs cis-14:1 and cis-16:1 showed the largest variation in validation R 2 between the breeds. The RPDv was in general lower than the RPD of the cross-validation; however, a similar trend was observed (Table 5). The RPDv is above 3.0 across all breeds (breeds total) for 6:0; 8:0; 14:0 and all groups of FAs.
The SEV of 11 FAs and 3 groups of FAs for different dairy breeds
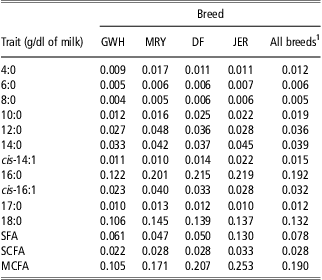
SEV = standard error of validation; FA = fatty acid; GWH = Groningen White Headed; MRY = Meuse-Rhine-Yssel; DF = Dutch Friesian; JER = Jersey; SFA = the saturated FAs 4:0 to 22:0 including iso- and ante-iso FAs; SCFA = short-chain FAs 4:0 to 10:0; MCFA = medium-chain FAs 12:0 to 16:0.
1Breeds total is the SEV of the predictions across the breeds GWH, DF, MRY and JER.
The validation R 2 of prediction of 11 FAs and 3 groups of FAs for different dairy breeds
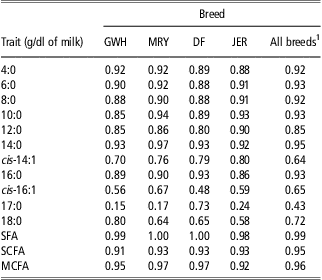
FA = fatty acid; GWH = Groningen White Headed; MRY = Meuse-Rhine-Yssel; DF = Dutch Friesian; JER = Jersey; SFA = the saturated FAs 4:0 to 22:0 including iso- and ante-iso FAs; SCFA = short-chain FAs 4:0 to 10:0; MCFA = medium-chain FAs 12:0 to 16:0.
1Breeds total is the R 2 of the predictions across the breeds GWH, DF, MRY and JER.
The RPDv1 of 11 FAs and 3 groups of FAs for different dairy breeds
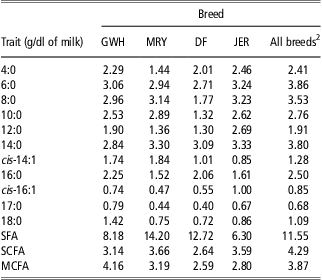
RPDv = ratio of the standard deviation of the validation samples to the standard error of prediction of the validation; FA = fatty acid; GWH = Groningen White Headed; MRY = Meuse-Rhine-Yssel; DF = Dutch Friesian; JER = Jersey; SFA = the saturated FAs 4:0 to 22:0 including iso- and ante-iso FAs; SCFA = short-chain FAs 4:0 to 10:0; MCFA = medium-chain FAs 12:0 to 16:0.
1Calibration equations with RPDv above 3.0 can be considered as good predictors (Williams and Sobering, Reference Williams and Sobering1993. Journal of Near Infrared Spectroscopy 1, 25–32).
2Breeds total is the RPDv across the breeds GWH, DF, MRY and JER.
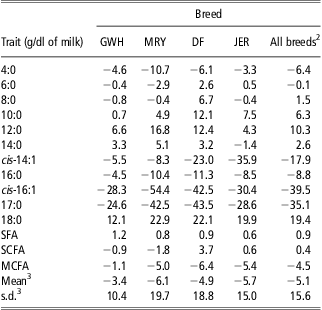
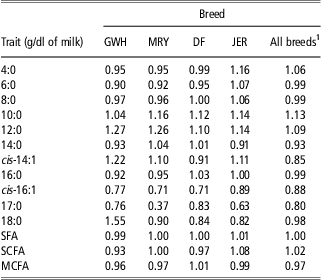
Bias was examined by calculating the average prediction error and the slope of the linear regression with the GC values as dependent and the predicted values as independent variable (Tables 6 and 7). To be able to compare the average prediction error of the calibration equations between traits and breeds, the values were expressed as a percentage of the mean of the gas chromatography absolute value (Table 6). The bias in terms of average prediction error for individual breeds is largest for MRY with on average −6.1% followed by JER (−5.7%) and smallest for GWH with on average 2.4%. For all breeds together, the average prediction error is −5.1% with an s.d. of 15.6, which means that the average difference between the predicted content using MIR and the reference GC values was −5.1% (normalized to the mean). The average prediction error were highest for the predicted contents of the individual FAs cis-16:1 and 17:0. The β 1, which is clearly related to the R 2, does not show unexpected results as β 1 is generally closer to 1 when the R 2 is also closer to 1. With a β 1 value of 1.55, the variance of the predicted content of 18:0 for GWH milk showed the largest underestimation (Table 7). With a β 1 value of 0.37, the variance of the predicted content of 17:0 for MRY showed the largest overestimation, which indicated a lack of relation between the true and predicted values also shown by the R 2 calculated to be 0.17.
The average prediction error1 of the predictions of 11 FAs and 3 groups of FAs for different dairy breeds
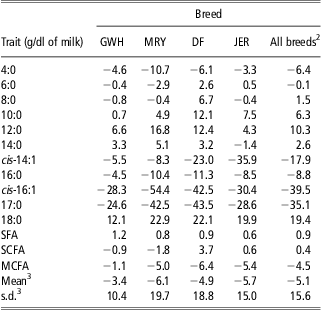
FA = fatty acid; GWH = Groningen White Headed; DF = Dutch Friesian; MRY = Meuse-Rhine-Yssel; JER = Jersey; SFA = the saturated FAs 4:0 to 22:0 including iso- and ante-iso FAs; SCFA = short-chain FAs 4:0 to 10:0; MCFA = medium-chain FAs 12:0 to 16:0.
1The average prediction error calculated as the predicted value minus the reference gas chromatography values and expressed as percentage of the mean of the gas chromatography values: (average prediction error/mean) × 100.
2All breeds means the average prediction errors across all predictions for GWH, DF, MRY and JER.
3The mean and s.d. of all average prediction errors for each breed and all breeds together.
The slope (β 1) of the linear regression with the gas chromatography values as dependent and the predicted values as independent variable of 11 FAs and 3 groups of FAs for different dairy breeds
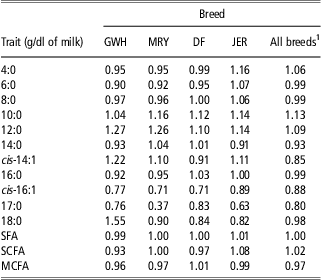
FA = fatty acid; GWH = Groningen White Headed; DF = Dutch Friesian; MRY = Meuse-Rhine-Yssel; JER = Jersey; SFA = the saturated FAs 4:0 to 22:0 including iso- and ante-iso FAs; SCFA = short-chain FAs 4:0 to 10:0; MCFA = medium-chain FAs 12:0 to 16:0.
1All breeds means the average prediction errors across all predictions for GWH, DF, MRY and JER.
Comparing the descriptive statistics of the GC data, the FA content in the milk of the validation data set is generally higher than in the milk of the calibration data set. Especially JER milk in the validation data set showed higher FA contents, as the mean contents of 6:0, 8:0, 10:0, 12:0, 14:0, SFA, SCFA and MCFA were outside the 95% confidence interval of the mean of the calibration data of the calibration data set (i.e. larger than 2.5 times the standard deviation above the mean contents).
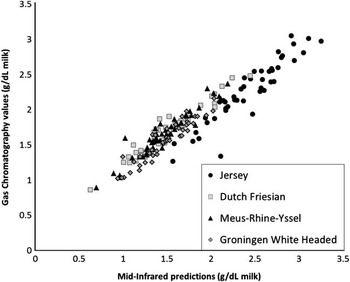
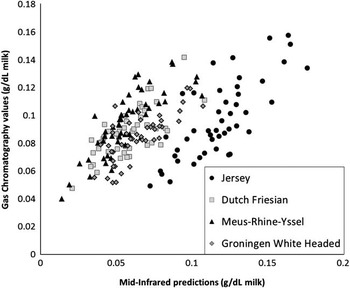
The performance of the calibration equations to predict the content of the FAs 16:0 and cis-16:1 is also visualized in Figures 1 and 2. For 16:0, a clear linear pattern is shown in Figure 1, which result in the high validation R 2 ranging from 0.86 to 0.93. For 16:1, Figure 2 clearly shows relatively more deviation of the predicted values. In both figures, especially predictions for JER are located in a different direction.
The predicted content of the individual fatty acid 16:0 based on mid-infrared spectometry plotted against the reference gas chromatography values.

The predicted content of the individual fatty acid cis-16:1 based on mid-infrared spectometry plotted against the reference gas chromatography values.

Discussion
The aim of this study was to investigate the accuracy of calibration equations based on milk samples collected from a population with different origin in terms of country, breed and methodology used to measure actual FA composition. In general, FAs with higher content in milk can be predicted more accurately than milk with a lower FA content (Soyeurt et al., Reference Soyeurt, Dardenne, Dehareng, Lognay, Veselko, Marlier, Bertozzi, Mayeres and Gengler2006 and Reference Soyeurt, Dehareng, Gengler, McParland, Wall, Berry, Coffey and Dardenne2011; Rutten et al., Reference Rutten, Bovenhuis, Hettinga, van Valenberg and van Arendonk2009). In this study, predictions of FA with high content in milk (>1 g/dl milk) were also highly accurate (validation R 2 >0.80); however, 7 of the total 11 FAs with lower content in milk (<1 g/dl milk) were predicted to be highly accurate by means of validation R 2. Differences in performance of the calibration equations between breeds were mainly found by evaluating the SEV and the average prediction error. Results showed on average for GWH the smallest difference between predicted and reference values and least variation in prediction errors, whereas for JER on average the largest differences were found between predicted and reference values and most variation in prediction errors.
The RobustMilk calibration equations validated in our study were updated versions of the calibration equations reported in Soyeurt et al. (Reference Soyeurt, Dehareng, Gengler, McParland, Wall, Berry, Coffey and Dardenne2011), in that the calibration data set was enlarged. Despite this increase in size of the calibration data set, the predictions in our study were in general less accurate than those of Soyeurt et al. (Reference Soyeurt, Dehareng, Gengler, McParland, Wall, Berry, Coffey and Dardenne2011). Comparing both studies, the FA composition in the validation data set of Soyeurt et al. (Reference Soyeurt, Dehareng, Gengler, McParland, Wall, Berry, Coffey and Dardenne2011) was generally closer to the FA composition of the calibration data, whereas FA concentrations in the validation data set of our study were generally higher than those in the calibration data. This difference in range of FA concentrations, mainly due to differences in breed, is the most likely reason for this lower accuracy. A comparable difference in accuracy was found by Rutten et al. (Reference Rutten, Bovenhuis, Hettinga, van Valenberg and van Arendonk2009) when predicting FA composition in winter or summer, using a calibration equation that was based on winter samples only. This indicates that differences in FA composition due to differences in season (in which the feeding regime differs) are as important as differences due to breed (Rutten et al., Reference Rutten, Bovenhuis, Hettinga, van Valenberg and van Arendonk2009). When winter milk samples were used in the calibration data set to predict FA composition of summer samples, differences in concentration ranges between the calibration data set and the validation data set especially affected the bias (i.e. relative difference in means; Rutten et al., Reference Rutten, Bovenhuis, Hettinga, van Valenberg and van Arendonk2009).
In our study, the FAs that showed the largest difference in mean between our validation and the calibration data were not necessarily the same FAs as those that showed the largest bias. For instance, despite a relatively small difference in concentration of 14:1, cis-16:1, 17:0 and 18:0 between validation and calibration data, those FAs showed the largest bias (i.e. average prediction error and β 1). As cis-14:1, 16:1 and 17:0 are present in very low concentrations (<0.01 g/dl milk), this is the most likely cause of their high bias. Differences between means of validation and calibration data were largest for the concentrations of short and medium FAs in JER milk, which generally had a higher concentration in JER milk compared with the other breeds. Remarkably, despite the large difference in concentration, these FAs generally had accurate predictions. Therefore, it seems that differences in accuracy and bias are not only caused by differences in concentration of the individual FAs, but perhaps also by spectral variability of the milk samples. As indicated by Soyeurt et al. (Reference Soyeurt, Dehareng, Gengler, McParland, Wall, Berry, Coffey and Dardenne2011), adding milk samples to the calibration data to maximize the spectral variability of the samples in the calibration data set is an effective method to optimize calibration equations.
The suitability of calibration equations depends on the application of the predictions. If the primary interest is in predicting individual FA composition, then highly accurate and unbiased predictions are important. When the interest is in predicting differences between individuals or populations (e.g. for breeding purposes), accurate and unbiased predictions are important; however, less accurate or biased predictions can still be suitable, especially when multiple measurements are available per individual. Suitability of calibration equations, which are to some extent derived under different conditions, can be evaluated by means of an external validation as presented in this study.
As the dairy breeding industry is interested in selecting cows producing milk with a specific FA composition, the suitability of the calibration equations depends on the reduction in genetic gain when using MIR information instead of GC information. As Rutten et al. (Reference Rutten, Bovenhuis and van Arendonk2010) found, the possible genetic gain estimated using FA composition determined by predictions based on MIR was almost equal to the possible genetic gain estimated using FA composition determined by GC, in dairy breeding schemes with progeny testing. The latter result was reached with even moderate and quite low validation R 2's ranging from 0.53 to 0.77. The genetic gain estimated by Rutten et al. (Reference Rutten, Bovenhuis and van Arendonk2010) assumed the availability of information on large groups of daughters per sire. Reaching similar gain could be difficult for the Dutch breeds in our study, as bulls in these breeds have generally smaller daughter groups. For these Dutch breeds, therefore, calibration equations that give highly accurate predictions are necessary to obtain genetic gains similar to the mainstream cattle breeds.
Conclusion
In conclusion, the RobustMilk calibration equations can be used to predict the content of most saturated FA in milk using MIR spectrometry for the breeds GWH, MRY, DF and JER in the Netherlands with only a minor loss of accuracy compared with predictions for Holstein cows.
Acknowledgments
This study was financially supported by the Ministry of Agriculture, Nature and Food (Programme ‘Kennisbasis Research’, code: KB-04-002-021 and KB-05-003-041). The 12 involved farmers are thanked for contributing milk samples to this study. Furthermore, the RobustMilk project team is thanked for the use of the calibration equations. The RobustMilk project is financially supported by the European Commission under the Seventh Research Framework Programme, Grant Agreement KBBE-211708. This publication represents the views of the authors, not the European Commission, and the Commission is not liable for any use that may be made of the information.