Introduction
Aldehyde oxidases (AOXs; EC 1.2.3.1), a group of metabolic enzymes, are a kind of proteins which belong to the family of molybdo-flavoenzymes (MFE) along with the structurally related xanthine dehydrogenase (XDH) enzymes (Terao et al., Reference Terao, Romão, Leimkühler, Bolis, Fratelli, Coelho, Santos-Silva and Garattini2016; Xu and Liao, Reference Xu and Liao2017). The structures of these enzymes are composed of a 20-kDa N-terminal 2x[2Fe-2S] domain-containing two iron-sulfur centers, a 85-kDa C-terminal molybdopterin-binding domain with the four redox centers aligned in an almost linear fashion, and a central 40-kDa FAD containing domain (Enroth et al., Reference Enroth, Eger, Okamoto, Nishino, Nishino and Pai2000; Terao et al., Reference Terao, Kurosaki, Saltini, Demontis, Marini, Salmona and Garattini2000; Garattini et al., Reference Garattini, Mendel, Romão, Wright and Terao2003). Although these domains have similar amino acid sequences in all the members of the family, these enzymes are difference in terms of substrate and inhibitor specificity as well as cofactor requirement and biochemical function (Garattini et al., Reference Garattini, Mendel, Romão, Wright and Terao2003; Hille, Reference Hille2005). According to research findings, AOXs mainly catalyze the oxidation of aromatic heterocycle or aromatic aldehydes into corresponding carboxylic acids (Beedham et al., Reference Beedham, Peet, Panoutsopoulos, Carter and Smith1995), while XDH play critical roles in the metabolism of some purines, and catabolizing hypoxanthine into xanthine and xanthine into uric acid (Enroth et al., Reference Enroth, Eger, Okamoto, Nishino, Nishino and Pai2000).
AOXs widely distribute in organisms including plants and animals, and participate in a variety of physiological and biochemical functions (Huang and Ichikawa, Reference Huang and Ichikawa1994; Hemingway et al., Reference Hemingway, Coleman, Paton, McCarroll, Vaughan and Desilva2000). The physiological function of aldehyde oxidase was first studied in plants (Mendel and Hänsch, Reference Mendel and Hänsch2002), and AOXs are believed to participate in the regulation of plant growth, development and environmental adaptability by catalyzing the synthesis of abscisic acid (ABA) and indoleacetic acid (IAA) (Sagi et al., Reference Sagi, Scazzocchio and Fluhr2002; Barrero et al., Reference Barrero, Rodríguez, Quesada, Piqueras, Ponce and Micol2006). Among mammals, AOXs are distinguished by broad substrate specificity, catalyzing the oxidation of various types of aldehydes, nitrogen heterocycles and oxygen heterocycles of pharmacological and toxicological significance (Schumann et al., Reference Schumann, Terao, Garattini, Saggu, Lendzian, Hildebrandt and Leimkühler2009; Pryde et al., Reference Pryde, Dalvie, Hu, Jones, Obach and Tran2010; Garattini and Terao, Reference Garattini and Terao2011; Mahro et al., Reference Mahro, Coelho, Trincão, Rodrigues, Terao, Garattini, Saggu, Lendzian, Hildebrandt, Romão and Leimkühler2011). Distinguishingly, most of the research on the function of insect AOXs has focused on the degradation of olfactory molecules, which seems to be a unique function of insect AOXs (Rybczynski et al., Reference Rybczynski, Reagan and Lerner1989). In addition, insect AOXs also has been reported to be associated with insecticide resistance by coamplifing with insecticide resistance-associated esterase (Hemingway et al., Reference Hemingway, Coleman, Paton, McCarroll, Vaughan and Desilva2000; Coleman et al., Reference Coleman, Vontas and Hemingway2002). The initial research of insect AOXs merely discussed its physiological activity at the biochemical detection level (Rybczynski et al., Reference Rybczynski, Reagan and Lerner1989). But with the rapid development of modern molecular biology, the features of many AOX genes at the molecular level have been identified and characterized successively from insects such as Bombyx mori (Pelletier et al., Reference Pelletier, Bozzolan, Solvar, François, Jacquin-Joly and Maïbèche-Coisne2007), Mamestra brassicae (Merlin et al., Reference Merlin, François, Bozzolan, Pelletier, Jacquin-Joly and Maïbèche-Coisne2005), Amyelois transitella (Choo et al., Reference Choo, Pelletier, Atungulu and Leal2013), Drosophila melanogaster (Garattini et al., Reference Garattini, Fratelli and Terao2008), Helicoverpa armigera (Xu and Liao, Reference Xu and Liao2017). In brief, these findings greatly enriched the understanding of the functions of insect AOXs.
Currently, the role of insect AOXs in the process of olfactory becomes increasingly clear (Choo et al., Reference Choo, Pelletier, Atungulu and Leal2013; Xu and Liao, Reference Xu and Liao2017). To maintain the fidelity and sensitivity of an insect's olfactory system, odorant-degrading enzymes (ODEs) including AOXs are deemed to inactivate odorant molecules after they convey their signals (Leal, Reference Leal2013; He et al., Reference He, Zhang, Hong, Wang, Wang, Zuo, Tang, Xu and He2017). Functional research on AOXs showed that the recombinant AtraAOX2, which was the first activity characterization of a recombinant insect AOX in vitro, could degrade sex pheromone and plant volatile aldehydes as substrates (Choo et al., Reference Choo, Pelletier, Atungulu and Leal2013), which indicated that AOX did play a role in inactivating odorant molecules. Meanwhile, BmAOX5 in the pheromone gland of B. mori participates in the degradation of aldehyde pheromone substances and odorant compounds also illustrates this point (Zhang et al., Reference Zhang, Yang, Shen, Mao, Jiao and Lin2020). Recently, the activity analysis of AOX acting on substrates in vitro revealed that PxylAOX3 from the antennae of Plutella xylostella protected olfactory neuron by inactivation of redundant odorants and detoxification of xenobiotics (Wang et al., Reference Wang, He, Wang, Ma, Dewer, Zhang and He2021). Altogether, these results revealed that AOX is potentially involved in the degradation of pheromones, plant-derived volatiles and the detoxification of xenobiotics. Of course, AOX from the silk gland of B. mori also could catalyze indole-3-acetaldehyde to indole-3-acetic acid (Takei et al., Reference Takei, Kogure, Yokoyama, Kouzuma and Suzuki2019). However, these findings on insect AOX mainly in lepidopteran, especially for antennae-specific AOXs. The research of other insect orders AOXs and non-tissue specific AOXs are still rare.
The red flour beetle, Tribolium castaneum, is a coleoptera model pest, and the genome sequences of T. castaneum have been well characterized (Richards et al., Reference Richards, Gibbs, Weinstock, Brown, Denell, Beeman, Gibbs, Beeman and Brown2008), thus further improving research utilizing this species. However, the physiological function of AOX in coleoptera remains unclear. In light of this, our objective here was to identify and characterize TcAOX in T. castaneum, which, to the best of our knowledge, represents the first time AOX enzymes have been analyzed in a coleopteran. This study will help improve our understanding of the complex function of AOXs and lay the foundation for coleoptera insect defense research and development of an insect medication model.
Materials and methods
Experimental animals
The T. castaneum strain Georgia-1 (GA-1) was used for all experiments. The incubator conditions were as described previously (Li et al., Reference Li, Beeman and Park2011). Briefly, the insects were raised in a jar, loaded with wheat flour containing 5% brewer's yeast in a growth chamber maintained at 30 °C and 40% relative humidity under a 14-h light/10-h dark cycle.
RNA purification and reverse transcription
The samples of eight developmental stages were collected as follow: early eggs (EE, 1 day old), late eggs (LE, 3 days old), early larvae (EL, 1 day old), late larvae (LL, 20 days old), early pupae (EP, 1 day old), late pupae (LP, 5 days old), early adults (EA, 1 day old), and late adults (LA, 10 days old). The sample of various tissues including head, epidemis, fat body, gut and hemolymph were dissected from larvae, while head, epidemis, fat body, gut, ovary, testis and antennae were dissected from adults. Then all of these samples were collected in 1.5 mL RNA-free microcentrifuge tubes (EP) and immediately stored at −80 °C for later use. Total RNA was respectively extracted from these samples following the standard protocol of RNAiso™ Plus (TaKaRa, Kyoto, Japan). The purified total RNA samples were quantified and qualified by Nanodrop 2000 (Thermo Scientific, Waltham, USA) and the integrity of RNA was further evaluated by 1.0% agarose gel electrophoresis with an Agilent 2100 Bioanalyzer. Subsequently, reverse transcription was carried out with 1000 ng of the total RNA (the A260/A280 ratio was >1.8 and the A260/A230 ratio was >2.0) by using HiScript II Reverse Transcriptase (Vazyme, Nanjing, China) following manufacturer's manual. Finally, the cDNA samples were stored at −20 °C for follow-up experiment.
Bioinformatics and sequence analysis
TBtools software was used to conduct blast searches on the T. castaneum genome from Beetlebase (http://www.beetlebase.org/). The BLAST of National Center for Biotechnology Information (https://blast.ncbi.nlm.nih.gov/Blast.cgi) was used to reversed comparison. ORF cDNA sequence, the deduced proteins, molecular weight (Mw) and theoretical isoelectric point (pI) were predicted by the online tool of the ExPASy website (https://www.expasy.org). MEGA 7.0 software was used to construct the phylogenetic analysis by using the neighbor-joining (NJ) method with 1000 bootstrap tests and values lower than 50% are not shown. The identified T. castaneum AOX amino acid sequences were aligned using multiple alignment program ESPript 3.0 (https://espript.ibcp.fr/ESPript/). The structural domains of genes were predicted was performed using SMART (http://smart.embl-heidelberg.de/).
Quantitative real-time PCR (qRT-PCR)
According to the manufacturer's instructions, qRT-PCR was performed to check the expression of TcAOXs in T. castaneum using SYBR Green Master (Vazyme, Nanjing, China) with a QuantStudio™ 6 Flex System (Applied Biosystems, Foster City, CA, United States). The reaction volume of qPCR was 10 μl, including 3.5 μl of RNase-free water, 0.25 μl of each primer, 5 μl of 2 × SYBR Mixture and 1 μl of cDNA. The reaction procedure was performed as follows: 95 °C for 10 min; 40 cycles of 95 °C for 15 s and 60 °C for 1 min; and 1 cycle of 95 °C for 15 s, 60 °C for 1 min, and 95 °C for 15 s. The T. castaneum ribosomal protein S3 (rpS3; GenBank accession number CB335975) was selected as a reference gene using the 2−ΔΔCT method to calculate the gene expression levels (Livak and Schmittgen, Reference Livak and Schmittgen2001; Begum et al., Reference Begum, Li, Beeman and Park2009). Three biological replications were performed for each experiment and all primers used are listed in table 1.
Primers used in this study

Double stranded RNAs (dsRNAs), which primers containing the T7 polymerase promoter (TAATACGACTCACTATAGGG) at the 5′-end of both the sense primer and anti-sense primer.
RNAi experiment and behavior analysis
RT-PCR was served as amplifying the gene sequence. The primers used to amplify dsDNAs corresponding to TcAOX are shown in table 1. The program of PCR was as follows: 94 °C, 5 min to activate advantage GC polymerase; followed by 32 cycles of 94 °C, 30 s; 60 °C, 30 s and 72 °C for 30 s, and final extension was performed at 72 °C for 7 min. The integrity of PCR products was detected by 1.0% agarose gel electrophoresis. PCR products were purified and extracted using FastPure Gel DNA Extraction Mini Kit (Product code: DC301, Vazyme, Nanjing, China). The dsRNA fragment of the TcAOX was synthesized in vitro using the Thermo Scientific TranscriptAid T7 High Yield Transcription Kit (Product code: K0441, Thermo Fisher Scientific, Shanghai, China) according to the manufacturer's instructions. dsVer (T. castaneum vermillion, GenBank AY052390) was synthesized as a positive control to confirm that the results we observed in the subsequent RNAi analysis were due to suppression of the expression levels of the specific target genes. Subsequently, RNAi was performed by injecting the body cavity of T. castaneum with 2 μg μl−1 dsRNA using an InjectMan 4 instrument (Eppendorf, Hamburg, Germany). After injection, the target-gene silencing efficiency was detected by qRT-PCR which reaction procedure and volume identified with the above description on the fourth day.
To further investigate the functions of TcAOXs in the fecundity of T. castaneum, the collected pupae (twenty-fifth-day-old) were separated into two groups (female and male groups), and then each group was used for non-injection (WT, negative control), dsTcVer injection (positive control), dsTcAOX injection, respectively. After the fourth day, the males and females (injected the same) were pre-mated for 3 days, and then mated formally for 3 days. The egg-laying rate was calculated after formally mated. Three biological replications with independent injections were performed for each experiment.
Induction of TcAOXs in response to the plant toxicant
The Artemisia vulgaris essential oil (A. vulgaris EO) was extracted and diluted as previously described by Zhang et al. (Reference Zhang, Gao, Xue, An and Zhang2021). To measure TcAOX expression after A. vulgaris EO induction, a total of 180 T. castaneum larvae (15-day-old) were collected and separated into three groups. Briefly, approximately 60 synchronous individuals in each group were loaded into 1.5-mL EP tubes and exposed to 100 μl A. vulgaris EO or acetone (control). After soaking for 1 min, the treated larvae in each group were placed on filter paper and allowed to air dry for 2 min. Each group was then transferred to an 8-mL glass vial and maintained under standard conditions as previously described (Li et al., Reference Li, Beeman and Park2011). The acetone exposure group served as the control group in this study. The induction of TcAOXs were determined at 12, 24, 36, 48, 60 and 72 h following A. vulgaris EO exposure. At each time point, three surviving beetles in each group were selected for total RNA isolation at random, and the transcript levels of TcAOXs were measured using qRT-PCR, which reaction procedure and volume identified with above description). Three biological replications were performed for each experiment.
Bioassay of T. castaneum susceptibility to plant oil
For the plant oil bioassay after RNAi, T. castaneum 15-day-old larvae that had been injected dsRNA for 96 h were treated with plant oil. Briefly, 30 15-day-old larvae were treated with approximately 100 μl of plant oil for 1 min and then placed on filter paper to air dry for approximately 2 min. Immediately, the treated larvae were moved to an 8-mL Drosophila Vial. After 2 h, wheat flour containing 5% brewer's yeast was added to the vials, which were maintained under standard conditions. Mortality was recorded at 24, 48, and 72 h after plant oil treatment. Larvae were considered dead if they were unable to move or show a response when disturbed with a pair of tweezers or a brush. Three biological replications with independent injections were performed for each experiment.
Statistical analysis
The gene expression data and the mean values obtained for the RNAi-treated larvae vs. the mean values obtained for the control larvae were subjected to one-way analysis of variance (ANOVA) in combination with Fisher's least significant difference (LSD) multiple comparison tests and Student's t-test, respectively, by using the SPSS statistics program (SPSS Inc., Chicago, IL, USA). All data are expressed as the mean ± standard error (SE); the error bars represent standard errors among three biological replications (*P < 0.05 was regarded as statistically significant; ***P < 0.001 was considered extremely significant).
Results
Identification of putative TcAOXs from T. castaneum genome
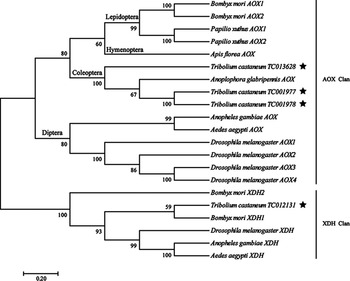
Four candidate genes encoding sequences of AOX or XDH proteins were identified by conducting TBLASTN searches on the T. castaneum genome using the sequence of D. melanogaster AOX. To further classify these genes, phylogenetic analysis with other insect AOXs and XDH genes identified from B. mori, A. transitella, Papilio xuthus, D. melanogaster, Anopheles gambiae, Aedes aegypti, Apis florea and Anoplophora_glabripennis was used to identify (table S1). As shown in the fig. 1, the genes (Tc013628, Tc001977, Tc001978) were classified into AOX clan, while the gene (Tc012131) was classified into XDH clan. For being convenient to research, Tc013628, Tc001977, and Tc001978 were renamed TcAOX1, TcAOX2 and TcAOX3, respectively, in this study.
Phylogenetic tree of TcAOXs with AOXs of other insects. The phylogram was reconstructed in MEGA 7.0 using the neighbor-joining method. Bootstrap support values (in percent) based on 1000 replicates are indicated.

Molecular characteristics analysis of TcAOXs
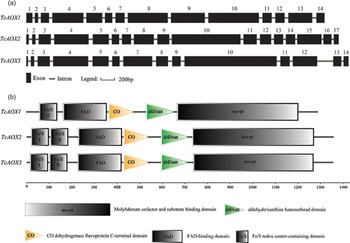
To further characterize the putative TcAOXs, we analyzed its molecular characteristics. For sequence analysis, TcAOX1 is 3776 bp in length and has an ORF of 3711 nucleotides encoding 1236 amino acid residues with a molecular mass of 136.99 kDa and a pI of 8.01; TcAOX2 is 4257 bp in length and has an ORF of 4038 nucleotides encoding 1345 amino acid residues with a molecular mass of 148.98 kDa and a pI of 7.11; and TcAOX3 is 4327 bp in length and has an ORF of 3786 nucleotides encoding 1261 amino acid residues with a molecular mass of 138.91 kDa and a pI of 5.25 (table S2). Further, by comparing T. castaneum AOX cDNA sequences and genome sequences, we find that TcAOX1, TcAOX2, and TcAOX3 genome DNA sequences contain 14, 17, and 14 exons, respectively (fig. 2a). In addition, the structural prediction and multiple sequence alignments for the TcAOXs show that each subunit contains a typical structure with a N-terminal domain containing two iron-sulfur (2Fe-2S) redox centers followed by a flavin-containing region (FAD-binding domain) and a C-terminal domain comprising the molybdenum cofactor (MoCo)-binding site within the substrate-binding pocket domain (fig. 2b, fig. S1).
Schematic representation of TcAOXs genomic (a) and domain organizations (b). Solid blocks represent exons. Introns of known sizes are indicated by full lines. The ORFs from T. castaneum were compared and analysed by SMART.

Stage- and tissue-specific expression of TcAOXs
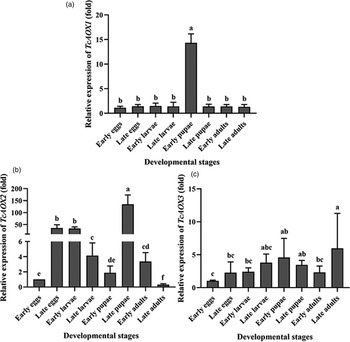
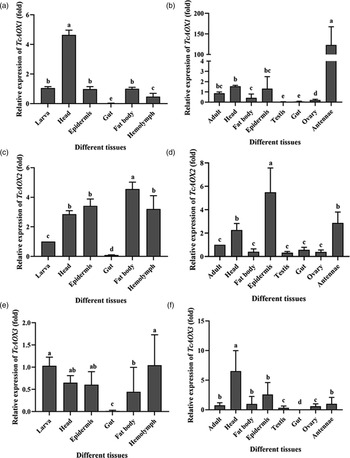
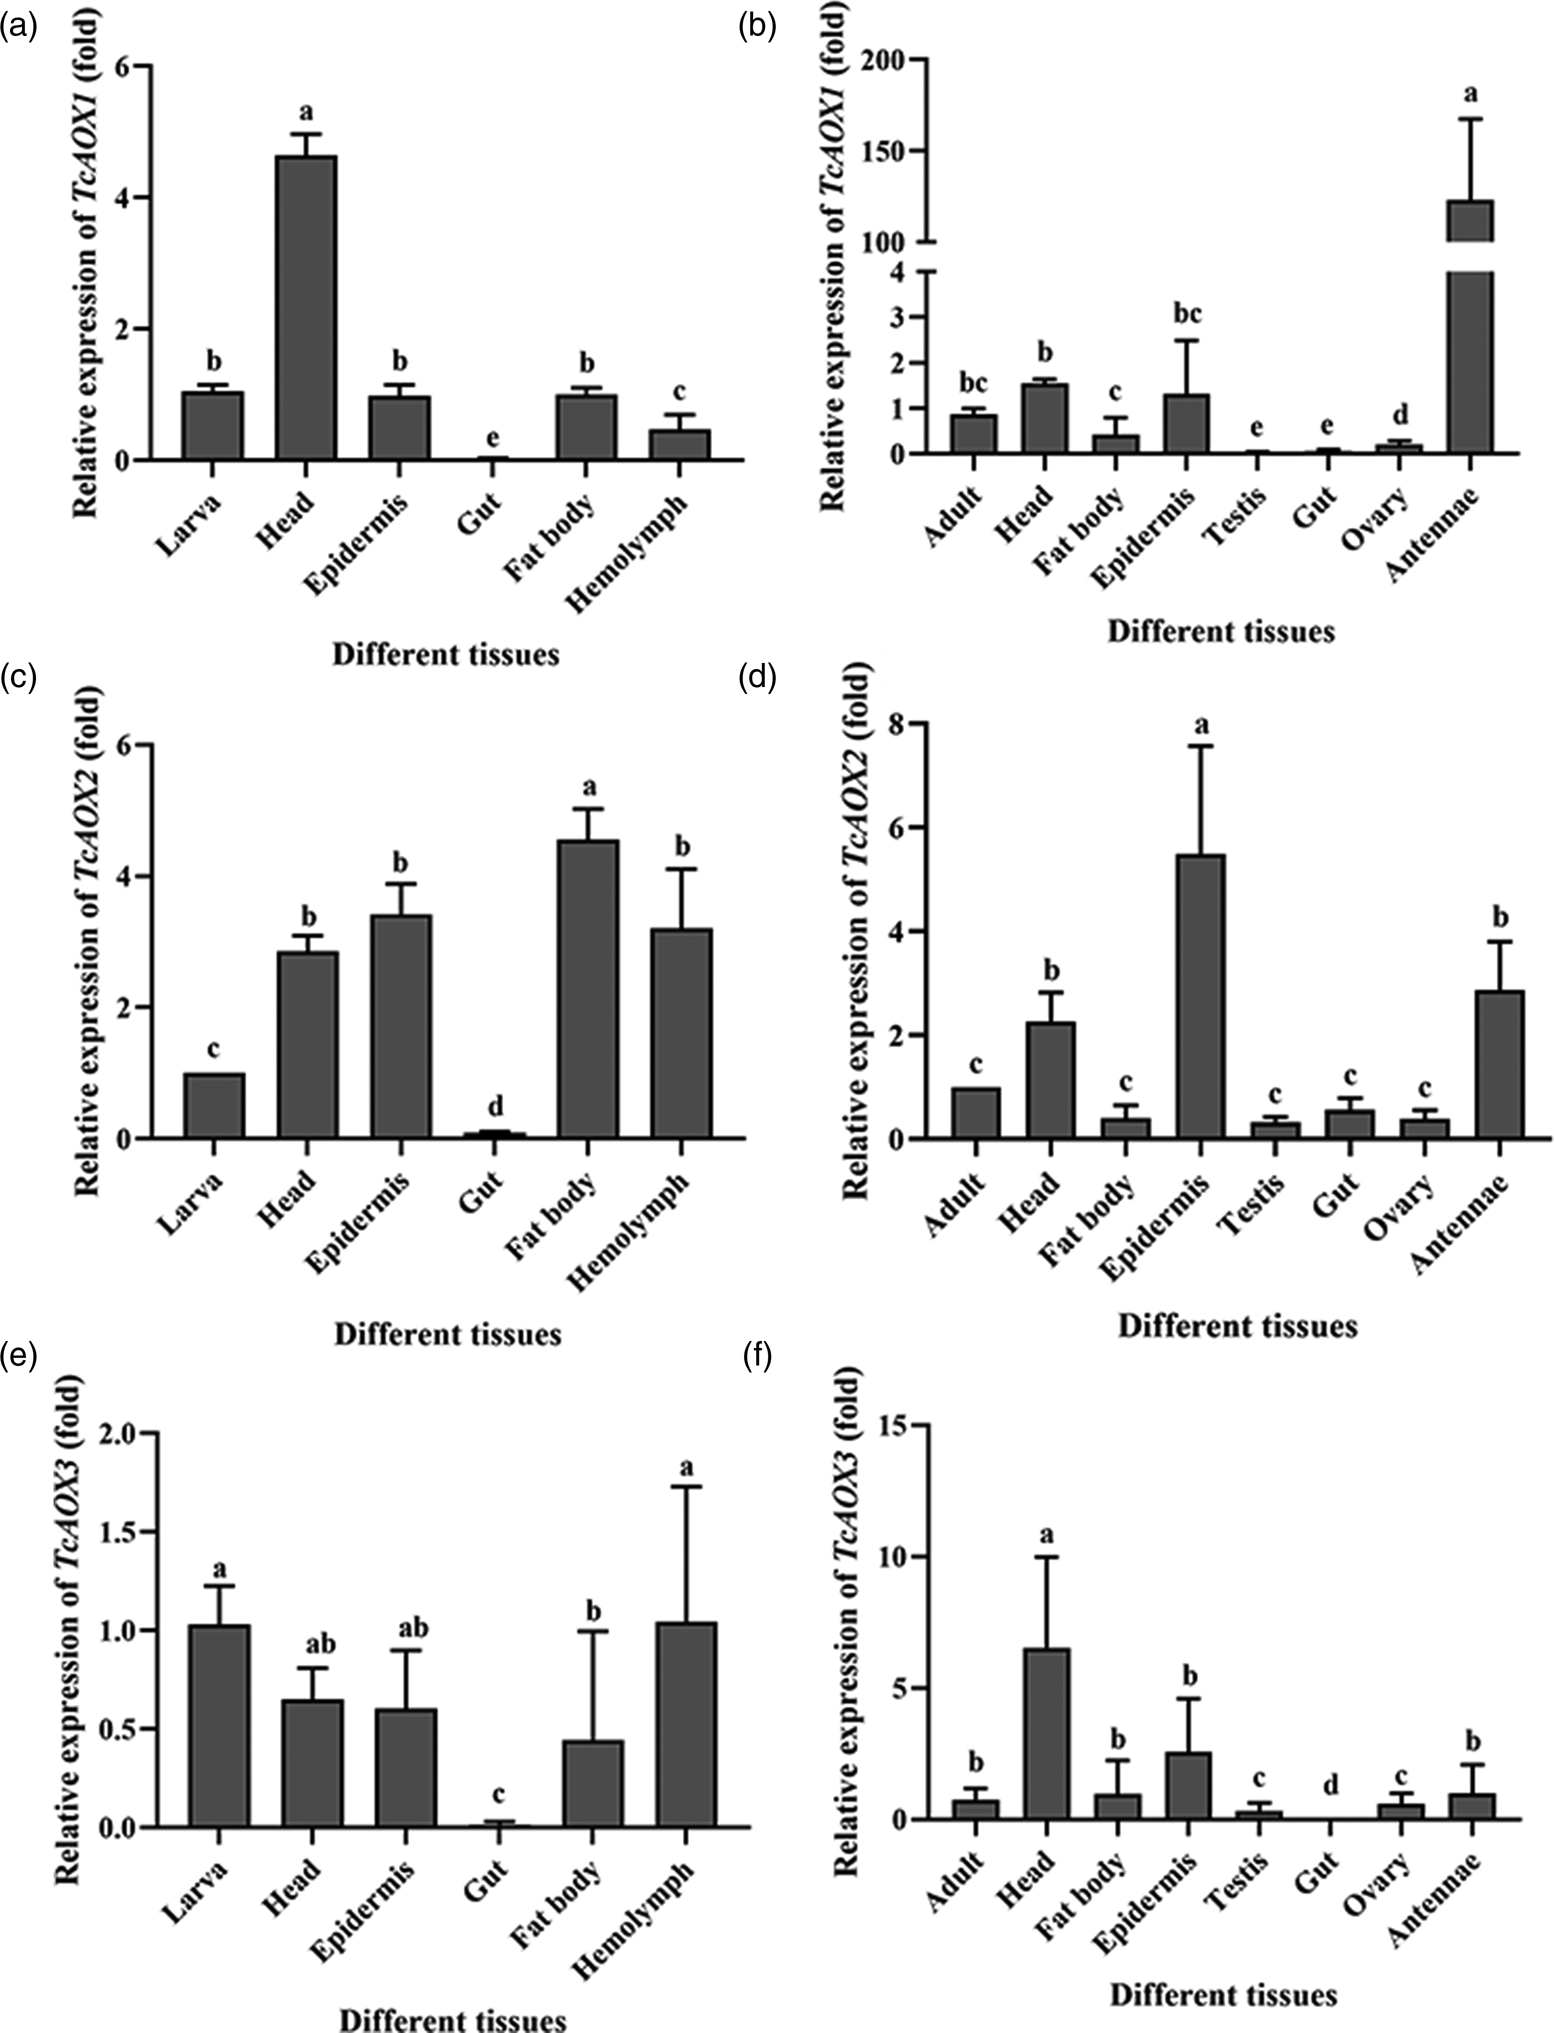
To get an insight in the functional and developmental significance of these three genes, the relative transcript levels of TcAOXs in different developmental stages and different tissues dissected from T. castaneum were investigated (figs 3 and 4). TcAOXs were transcribed throughout all developmental stages/ different tissues of T. castaneum, but expression levels differed significantly among the developmental stages/different tissues (figs 3 and 4). qRT-PCR revealed high levels of the transcripts in the EP stage for TcAOX1 (fig. 3a), the LE, the EL and LP stages for TcAOX2 (fig. 3b). In contrast, TcAOX3 exhibited homogenous levels of the transcripts in stages from embryo to adults (fig. 3c). Further investigations with the various tissues found that the expression levels of TcAOX1 were highest in the head and antennae dissected from larvae and adults, respectively, and lower expression levels were observed in the remaining tissues of the T. castaneum (fig. 4a, b). The TcAOX2 transcript was found to be moderately expressed in larva fat body, epidermis and hemolymph, while exhibited the highest expression in adult epidermis, antennae, head (fig. 4c, d). In addition, TcAOX3 was not highly expressed in all larva tissues, while had relatively high expression in adult head (fig. 4e, f).
The expression pattern of TcAOXs during the eight key developmental stages of T. castaneum. Early eggs (1 day old); Late eggs (3 days old); Early larvae (1 day old), Late larvae (20 days old); Early pupae (1 day old); Late pupae (5 days old); Early adults (1 day old); Late adults (10 days old). Vertical bars indicate standard errors of the mean (n = 3) and different letters on the error bars mean significant differences among the different developmental stages at the P < 0.05 by one-way analysis of variance (ANOVA).

The expression patterns of TcAOXs in the different tissues of T. castaneum. The (a), (c) and (e) represented the tissues of T. castaneum larvae including head, epidermis, gut, fat body, hemolymph. The (b), (d) and (f) represented the tissues of T. castaneum adults including head, fat body, epidermis, testis, gut, ovary, antennae. Vertical bars indicate standard errors of the mean (n = 3) and different letters on the error bars mean significant differences among the different tissues at the P < 0.05 by one-way analysis of variance (ANOVA).
Induction of TcAOXs by plant toxicant
To determine whether the expression of TcAOXs could be induced by plant toxicant, the transcript levels of these three genes were assessed by qRT-PCR after 15-day-old larvae treated with A. vulgaris EO at different time points (fig. 5). In comparison to the control, expression of TcAOX1 was no significant changes from 12 to 72 h after exposure to plant toxicant (fig. 5a). Interestingly, similar expression trends were observed for TcAOX2 and TcAOX3 following plant toxicant treatment. TcAOX2 and TcAOX3 were significantly upregulated by plant toxicant treatment and reached peak levels at 36 and 48 h, respectively, which were 2.63- and 3.0-fold greater than those of the control treatment group (fig. 5b, c); subsequently, the expression levels of these genes in the plant oil-treated groups gradually returned to lowered levels at 48 and 60 h, respectively (fig. 5b). However, the expression levels of TcAOX3 approached normal levels at 72 h following exposure to plant oil (fig. 5c).
Transcriptional expression of TcAOXs after exposure to A. vulagris. The 15-day-old T. castaneum larvae were treated with 5%A. vulagris or acetone (negative control group, ascribed an arbitrary value of 1) at time points of 12, 24, 36, 48, 60, and 72 h. Data and error bars represent the mean and standard errors (SE) of three biological replicates. Asterisks mean significant differences between the control and the treatment at the corresponding levels (*P < 0.05, **P < 0.01, ***P < 0.001).

TcAOXs mediate plant toxicant susceptibility in the T. castaneum
To further demonstrate the causal role of TcAOX2 and TcAOX3 in plant toxicant susceptibility, RNAi of TcAOXs was performed to knock down its expression and the effect of this on the survival of plant toxicant-treated larvae of the dsTcAOX and dsTcVer (fig. 6). To show the interference is a specific segment of the gene, RNAi targeting of TcAOXs in 15-day-old larvae dramatically reduced their respective transcripts but did not significantly affect the expression of nontarget genes (fig. S2), indicating that there was no off-target effect of our RNAi in T. castaneum. After 96 h of injection double-stranded RNA (dsRNA) specific for TcAOX2 and TcAOX3, the mRNA levels of these genes significantly decreased by about 83 and 84% as compared to controls, respectively (fig. 6a). Subsequently, susceptibility of dsTcAOX2- and dsTcAOX3-treated larvae to plant oil were evaluated. Knockdown of TcAOX2 and TcAOX3 significantly increased the mortality of larvae from 24 to 72 h, relative to the control, when treated with plant toxicant (fig. 6b).
Effect of RNAi treatment on the transcript levels of TcAOX2/TcAOX3 (a) and on susceptibility of T. castaneum larva to A. vulagris (B). The 15-day-old T. castaneum larvae were injected with 2 μg μl−1 dsRNA. Data and error bars represent the mean and standard errors (SE) of three biological replicates. Asterisks mean significant differences between the control and the treatment at the corresponding levels (*P < 0.05, **P < 0.01, ***P < 0.001).

TcAOXs mediate fecundity in the T. castaneum
To investigate the effect of TcAOX on fecundity, RNAi was performed using late pupa (25-day-old) that had been separated out male and female (fig. 7). After injection, the TcAOX1 silencing efficiency was detected by qRT-PCR on the fourth day, and the transcript level of TcAOX1, TcAOX2 and TcAOX3 were reduced by about 87, 85, and 70% as compared to controls, respectively (fig. 7). After TcAOX1 knockdown, the egg laying rate of the treatment group was reduced by 66.7% compared with the control group (fig. 8a). The egg numbers of the dsTcAOX2 and dsTcAOX3 knockdown group, by the contrast, were not significantly different from those of the controls (fig. 8a). Interestingly, investigating the hatching rate of eggs showed that nearly 100% of the eggs of the dsTcAOX1, dsTcAOX2, and dsTcAOX3 knockdown groups hatched into larvae (fig. 8b), suggesting that TcAOX1 is important for fecundity in T. castaneum.
Effect of RNAi treatment on the transcript levels of TcAOX1 (a), TcAOX2 (b), and TcAOX3 (c). The 25-day-old T. castaneum pupae were injected with 2 μg μl−1 dsRNA. Statistical comparisons were performed among the insects injected with the same amount of dsTcVer (T. castaneum vermillion, GenBank AY052390), WT (wild-type beetles that did not receive an injection) and dsTcAOX (beetles injected with TcAOX double-stranded RNA) by using the Student's t-test. Data and error bars represent the mean and standard errors (SE) of three biological replicates. The three asterisks indicate significant differences between the control and the treatment at P < 0.001 level.

Statistical analysis of reproduction. (a) The number of oviposition events 3 days in each group after RNAi of TcAOX1, TcAOX2 and TcAOX3 in the late pupae stage (25-day-old). (b) The survival rate of the eggs in each group after knockdown of TcAOX1, TcAOX2 and TcAOX3 in the late pupae stage (25-day-old). Statistical comparisons were performed among the insects injected with the same amount of dsTcVer (T. castaneum vermillion, GenBank AY052390), WT (wild-type beetles that did not receive an injection) and dsTcAOX (beetles injected with TcAOX double-stranded RNA) by using the Student's t-test. Data and error bars represent the mean and standard errors (SE) of three biological replicates. The double asterisks and three asterisks indicate significant differences between the control and the treatment at P < 0.01, and P < 0.001 levels, respectively.

Discussion
AOXs, a kind of multigene family, exist widely in plants and animals. Different species are characterized by a different complement of AOX genes. Currently, 1~4 AOX genes had been reported in Arabidopsis thaliana (Sekimoto et al., Reference Sekimoto, Seo, Kawakami, Komano, Desloire, Liotenberg, Marion-Poll, Caboche, Kamiya and Koshiba1998), Mus musculus (Kurosaki et al., Reference Kurosaki, Terao, Barzago, Bastone, Bernardinello, Salmona and Garattini2004), D. melanogaster (Garattini et al., Reference Garattini, Fratelli and Terao2008), Pisum sativum L. (Zdunek-Zastocka, Reference Zdunek-Zastocka2008), Bos taurus (Calzi et al., Reference Calzi, Raviolo, Ghibaudi, de Gioia, Salmona, Cazzaniga, Kurosaki, Terao and Garattini1995), Zea mays (Sekimoto et al., Reference Sekimoto, Seo, Dohmae, Takio, Kamiya and Koshiba1997), Gallus (Terao et al., Reference Terao, Kurosaki, Barzago, Varasano, Boldetti, Bastone, Fratelli and Garattini2006), Canis familiaris (Garattini et al., Reference Garattini, Fratelli and Terao2008), Homo sapiens (Garattini et al., Reference Garattini, Mendel, Romão, Wright and Terao2003), and Danio rerio (Garattini et al., Reference Garattini, Fratelli and Terao2008). In addition, 8 AOX genes had identified in B. mori which is by far the most insects of AOX (Pelletier et al., Reference Pelletier, Bozzolan, Solvar, François, Jacquin-Joly and Maïbèche-Coisne2007; Yang et al., Reference Yang, Lin, Yang, Wang and Xia2010). In our study, we identified three candidate genes encoding sequences of AOX proteins in the T. castaneum genome sequences. Gene structure analysis shows that all candidate genes contain two [2Fe-2S] domains, one flavin adenine (FAD) containing domain, and one molybdopterin-binding domain (fig. 2), according with the structural characteristics of AOX (Garattini et al., Reference Garattini, Mendel, Romão, Wright and Terao2003; Mahro et al., Reference Mahro, Coelho, Trincão, Rodrigues, Terao, Garattini, Saggu, Lendzian, Hildebrandt, Romão and Leimkühler2011). These conserved structural regions further confirmed that candidate genes did belong to the AOX gene family (fig. S1). Furthermore, phylogenetic analysis showed that the AOX and XDH of insect clustered with different clan (fig. 1), suggesting they have been diverged a long time ago (Marelja et al., Reference Marelja, Dambowsky, Bolis, Georgiou, Garattini, Missirlis and Leimkühler2014; Xu and Liao, Reference Xu and Liao2017; Okamura et al., Reference Okamura, Inada, Elshopakey and Itami2018). In fact, XDH genes is the ancestor of all AOX genes, and a series of subsequent/separate gene duplication and suppression events led to the present enzymes in plants, insects and vertebrates (Garattini et al., Reference Garattini, Mendel, Romão, Wright and Terao2003, Reference Garattini, Fratelli and Terao2008). Simultaneously, it just goes to show why different organisms have different AOX genes, and why AOXs/XDHs cluster with the different branches.
Different from previous researches (Coleman et al., Reference Coleman, Vontas and Hemingway2002; Merlin et al., Reference Merlin, François, Bozzolan, Pelletier, Jacquin-Joly and Maïbèche-Coisne2005; Pelletier et al., Reference Pelletier, Bozzolan, Solvar, François, Jacquin-Joly and Maïbèche-Coisne2007; Huang et al., Reference Huang, Liu, Su and Feng2016; Xu and Liao, Reference Xu and Liao2017; Okamura et al., Reference Okamura, Inada, Elshopakey and Itami2018), the candidate AOX gene sequences contained 14–17 exons (fig. 2a), the ORF was 3711–4038 bp which encoded a putative protein of 1236–1345 amino acids, the molecular weight was 137~149 kDa, and the isoelectric point was 5.28–8.01 (table S2). This may be due to the differences of AOX among species. For instance, a minor 130 kDa subunit was produced by cleavage at the N-terminal side of the 150 kDa subunit in the monkey, whereas was not detected in the mice (Asakawa et al., Reference Asakawa, Itoh, Adachi, Hoshino, Watanabe and Tanaka2008). For expression analysis of AOXs mRNAs, it is evident that TcAOX1 and TcAOX2 are expressed throughout development, with peaks in the early pupae and LP stages, respectively (fig. 3a, b). Similarly, H. armigera AOX5 and D. melanogaster AOX2 activity was detected only during metamorphosis too (Marelja et al., Reference Marelja, Dambowsky, Bolis, Georgiou, Garattini, Missirlis and Leimkühler2014; Xu and Liao, Reference Xu and Liao2017), suggesting it may be involved in the metamorphosis of insect development. However, no significant phenotype was observed after knocking TcAOX1 and TcAOX2 down in the metamorphosis of T. castaneum (data not shown), which might be had something to do with the differences of AOX among different species as well. TcAOX3, by contrast, is expressed throughout development, suggesting it may play a general role in different stages (fig. 3c), but the specific function still needs our further research.
In insects, the chemosensory tissues including antennae play an important role in communicating the availability of food sources, habitats, and oviposition sites as well as in locating mates (van der Goes van Naters and Carlson, Reference van der Goes van Naters and Carlson2006). When sex pheromone spreading into the surrounding conditions, the odorant receptors (ORs) of antennae could combine with it by odorant-binding proteins (OBPs) or chemosensory proteins (CSPs) selectively and specifically delivering; after being detected by the ORs, these semiochemical signals will be transmitted to insect brains by a series of cascade reaction in the body to guide insect behaviors including mating, host-seeking, and oviposition; finally, degrading enzymes will inactivate these semiochemical signals and the signal inactivation step is critical in insect odorant-mediated behaviors as well (Leal, Reference Leal2013). As one of the ODEs, AOXs in insect antennae is one of the key enzyme degradation of sex pheromone into inactive carboxylic acids and play an important role in insect behaviors (Rybczynski et al., Reference Rybczynski, Reagan and Lerner1989). Further investigations with the various tissues found that the expression level of TcAOX1 was the highest in antennae dissected from adults (fig. 4a). Moreover, it can significantly affect the fecundity of beetles after knocking TcAOX1 down in our study (fig. 8a), indicating that TcAOX1 may be involved in the fecundity of beetles by affecting the inactivation of sex pheromone. However, knocking TcAOX1 down can't affect the hating rate of eggs (fig. 8b). Interestingly, significantly low expression of TcAOX1 in testis and ovary were observed (fig. 4b), and further dissection of dsTcAOX1-beetles discovered that the testis and ovary developed normally (fig. S3). Thus we conclude that TcAOX1 may be involved in the fecundity of beetles by affecting the inactivation of sex pheromone between insects instead of the reproductive organ. HarmAOX2 is a candidate ODE to inactivate the sex pheromone components (Z)-11-hexadecenal and (Z)-9-hexadecenal (Xu and Liao, Reference Xu and Liao2017). Recombinant AtraAOX2, PxylAOX3, BmAOX5 from the A. transitella, P. xylostella and B. mori, respectively, could degrade the sex pheromone or plant-derived volatiles in vitro (Choo et al., Reference Choo, Pelletier, Atungulu and Leal2013; Zhang et al., Reference Zhang, Yang, Shen, Mao, Jiao and Lin2020; Wang et al., Reference Wang, He, Wang, Ma, Dewer, Zhang and He2021). Therefore, we further need to prove this conjecture by expressing AOX protein in vitro to verify whether it can bind sex pheromone substances.
The TcAOX2 transcript was found to be moderately expressed in larval detoxification organs including fat body, epidermis and hemolymph, while exhibited the highest expression in adult epidermis (fig. 4c, d). In addition, TcAOX3 was not highly expressed in all larva and adult tissues (fig. 4e, f). In mammals, the role of AOXs is well known as they play a significant role in the detoxification of environmental pollutants (xenobiotics) such as pesticides (Yoshihara and Tatsumi, Reference Yoshihara and Tatsumi1997). Acetaldehyde, one of the environmental pollutants including highly toxic, is naturally produced in leaves or fruits of plants and must be degraded into non-toxic products (Kimmerer and Macdonald, Reference Kimmerer and Macdonald1987; González-Mas et al., Reference González-Mas, Rambla, Alamar, Gutiérrez and Granell2011). Some volatile aldehydes such as propanal and (E)-2-hexenal even were reported as having insecticidal activity in fumigation assay (Hammond et al., Reference Hammond, Rangel and Kubo2000; Hubert et al., Reference Hubert, Münzbergová and Santino2008). In fact, the involvement of AOX in insecticide resistance of C. quinquefasciatus had previously been reported (Coleman et al., Reference Coleman, Vontas and Hemingway2002). Metabolism of acetaldehyde by cytosolic oxidizing enzymes is important for the survival of D. melanogaster (Heinstra et al., Reference Heinstra, Geer, Seykens and Langevin1989; Anderson and Barnett, Reference Anderson and Barnett1991), and AtraAOX2 degrade the pesticide containing an aldehyde functional group (acrolein) indicate that it functions as a xenobiotic-degrading enzyme in A. transitella (Choo et al., Reference Choo, Pelletier, Atungulu and Leal2013). Furthermore, P. xylostella PxylAOX3 could participate in olfactory neuron protection by inactivation of redundant odorants and xenobiotic detoxification (Wang et al., Reference Wang, He, Wang, Ma, Dewer, Zhang and He2021). With the further rearch of AOX, it is no wonder that AOX plays a significant role in the detoxification of insects.
In our study, we also found that the expression of TcAOX2 and TcAOX3 could be induced by plant volatiles (fig. 5b, c), implying that they might play a vital role during the response to plant toxicant treatment. RNA interference has become a powerful tool to study gene function in a wide range of multicellular organisms and single cells (Meister and Tuschl, Reference Meister and Tuschl2004; Kim et al., Reference Kim, Soumaila Issa, Cooper and Zhu2015; Silver et al., Reference Silver, Cooper and Zhu2021). Further, RNAi against TcAOX2 and TcAOX3 prior to plant toxiant exposure led to even higher mortalities (fig. 6b), indicating that TcAOX2 and TcAOX3 definitely performed plant toxicant susceptibility in the beetles, providing further evidence for the involvement of TcAOX2 and TcAOX3 in detoxication in T. castaneum. Of course, some shortcomings such as how AOXs participate in metabolic detoxification and whether AOXs are similar to the classic metabolic detoxification phase is still our further exploration.
Supplementary material
The supplementary material for this article can be found at https://doi.org/10.1017/S0007485322000049
Acknowledgements
This research was sponsored by the Staring Foundation for the Doctor, Anyang Institute of Technology (BSJ2019009), the Staring Foundation of Innovation and Practice Base for Postdoctors, Anyang Institute of Technology (BHJ2020008), the Scientific and Technological Project of Henan Province (grant number 212102110444).