

The initiatives undertaken by secondary schools, universities and government departments over recent decades have yielded a marked rise in the participation levels of Aboriginal and Torres Strait Islanders (Australian Bureau of Statistics, 2011). Although more can be done before the representation of Indigenous students in higher education is proportionate to that in the general population (Australian Government Department of Education, 2014), it is clear that endeavours to improve the recruitment process, raise Aboriginal student awareness, and offer alternative forms of entry have, to some extent, been effective. Completion rates, however, remain a major concern. It is estimated that less than half of the Indigenous students who embark on tertiary studies fulfil their academic goal (James et al., Reference James, Anderson, Bexley, Devlin, Garnett, Marginson and Maxwell2008).
This pattern persists despite evidence that most Aboriginal university students across Australia regard their academic experiences as gratifying and affirming (Asmar, Page, & Radloff, Reference Asmar, Page and Radloff2011; Oliver, Rochecouste, & Grote, Reference Oliver, Rochecouste and Grote2013). The extent to which they immerse themselves in their studies has also been shown to be at a level similar to or higher than that of non-Indigenous students (Asmar et al., Reference Asmar, Page and Radloff2011). Regardless of their commitment to finish their programs, Aboriginal students encounter obstacles triggering their withdrawal at higher rates than their non-Aboriginal peers.
The research reported here was undertaken in response to demands for more nuanced understandings of the complex issues that compel dedicated students to abandon their studies (Asmar et al., Reference Asmar, Page and Radloff2011; Craven & Dillon, Reference Craven, Dillon, Craven and Mooney2013; James & Devlin, Reference James and Devlin2006; Oliver et al., Reference Oliver, Rochecouste and Grote2013; Pechenkina & Anderson, Reference Pechenkina and Anderson2011). In this paper, we focus on the qualitative component of a study conducted at a university in Western Australia (Oliver, Rochecouste, Dann, & Grote, Reference Oliver, Rochecouste, Dann and Grote2014) with the aim to explore student perceptions of the strategies they believe enable them to achieve their academic goals, and to describe those obstacles that can derail their academic progress.
Background
To contextualise the relationship between Aboriginal participation in higher education and their completion rates, this section provides an overview of issues that Indigenous university students negotiate as they engage in their studies. These include the impact of low socioeconomic status (SES), the quality of schooling available in their home communities as well as language and culture. We then consider research on the effectiveness of institutional interventions designed to assist Aboriginal students as they navigate university life.
SES Background and Educational Issues
Research has shown that students who are at most risk of withdrawing from their studies are those who come from low SES families, rural and remote environments, or Aboriginal communities (James et al., Reference James, Anderson, Bexley, Devlin, Garnett, Marginson and Maxwell2008). Schools in non-urban centres and low SES communities tend to struggle to provide the quality of education available in urban middleclass environments. Consequently, students attending such schools perform less well scholastically; their access to robust academic support and counselling at home and at school is limited. In addition, the level of their self-belief and self-assurance makes it difficult for them to envisage higher educational goals and broader career aspirations (James et al., Reference James, Anderson, Bexley, Devlin, Garnett, Marginson and Maxwell2008; McInerney & King, Reference McInerney, King, Craven and Mooney2013).
James and his colleagues (Reference James, Anderson, Bexley, Devlin, Garnett, Marginson and Maxwell2008) found that while non-Aboriginal students from such backgrounds find it challenging to adjust to the sociocultural context of university life, with sufficient support they attain their academic objectives at rates that exceed those of their Aboriginal peers. Among the issues that contribute to this pattern are the linguistic and sociocultural issues that can impinge on the academic progress of Aboriginal students.
Home Language
Most Aboriginal students grow up in families where Standard Australian English (SAE), the language of education, is not spoken at home. Having acquired Aboriginal English (AbE) as a first language or dialect, as the majority of Aboriginal Australians do (Sharifian, Reference Sharifian2006), most children learn SAE as an additional dialect or language at school. For some Aboriginal children in many remote communities, AbE and SAE are learned as additional languages. Although AbE and SAE are mutually intelligible to some extent, they diverge significantly in terms of phonology, syntax, lexis, morphology, conceptual understandings as well as in their pragmatic and discourse practices (Department of Education Western Australia, 2012; Grote & Rochecouste, Reference Grote, Rochecouste, Beresford and Partington2012; Oliver, Rochecouste, Vanderford, & Grote, Reference Oliver, Rochecouste, Vanderford and Grote2011; Sharifian, Rochecouste, & Malcolm, Reference Sharifian, Rochecouste and Malcolm2004).
It is now well understood that learning in a language or dialect other than one's home language severely disadvantages young learners (Siegel, Reference Siegel2010). This is particularly true when students’ proficiency in SAE is assumed, as is common among school teachers in Western Australia (Oliver et al., Reference Oliver, Rochecouste, Vanderford and Grote2011). Acquiring a sufficient level of proficiency in SAE and its affiliated academic literacy practices is fundamental to learners’ progress early on and throughout their academic careers.
Dialect differences can also impact upon AbE speakers in university settings where SAE language and literacy skills are essential for understanding lectures, learning resources, assignments, and exams, and for engaging in the oral and written academic discourse of tertiary education (Malcolm & Rochecouste, Reference Malcolm and Rochecouste2003; Malcolm, Rochecouste, & Hayes, Reference Malcolm, Rochecouste and Hayes2002). This can be particularly problematic for mature-aged Aboriginal students, many of whom matriculate through nontraditional pathways. Students often discover that their use of AbE linguistic and discourse features can disadvantage them in oral and written assessments, while adopting the SAE literacy practices associated with non-Aboriginal culture can challenge their sense of ownership of their academic work and unsettle their notion of self (Malcolm & Rochecouste, Reference Malcolm and Rochecouste1998).
Aboriginal Culture
Research with Aboriginal university students (Oliver et al., Reference Oliver, Rochecouste and Grote2013) has shown that the central importance of the family in the cultural lives of Aboriginal people can be a great asset, but it can also create situations that are less supporting of academic success. On the one hand, family members who have prior higher education experience can offer support; ensure that the student's needs for a quiet space (and time) for study time are met; and offer constructive advice and encouragement during stressful periods. On the other hand, some family members may be unfamiliar with the demands and rewards of university study and consequently withhold support or openly express resentment (Oliver et al., Reference Oliver, Rochecouste and Grote2013). Flood (Reference Flood, Craven and Mooney2013), who entered university as a mature-aged student, reported mixed reactions when she undertook her studies. While some of her family members and friends offered ‘encouragement’, others told her that she ‘was “too old” and [that] it was “a waste of money”’ (p. 217). Clearly for students who are first in their families to attend university, particularly mature-aged students, positive reinforcement and support from other sources is needed (Flood, Reference Flood, Craven and Mooney2013; Oliver et al., Reference Oliver, Rochecouste and Grote2013).
Mature-aged students, particularly women, comprise a substantial proportion of the Aboriginal student population (ABS, 2011). Many have to manage their study load in conjunction with familial and financial responsibilities, so taking a leave of absence from their employment is rarely an option (Flood, Reference Flood, Craven and Mooney2013). However, even younger Aboriginal students, unlike many of their non-Aboriginal peers, have to maintain their employment and look after family members while coping with a full course load, all of which can weaken their resolve to continue their studies (Flood, Reference Flood, Craven and Mooney2013; Oliver et al., Reference Oliver, Rochecouste and Grote2013).
A further cultural phenomenon that can impact on a student's academic performance (and therefore their progress) is shame (Oliver et al., Reference Oliver, Rochecouste and Grote2013). AbE speakers use this term to refer to the shyness or embarrassment that they feel when positive or negative attention is focused on them. This can occur when in the presence of someone with power, such as a teacher, police officer, employer or even friends who might ridicule them. They often feel a strong urge to withdraw from the situation, regardless of the consequences (Eagleson, Kaldor, & Malcolm, Reference Eagleson, Kaldor and Malcolm1982; Harkins, Reference Harkins1990; Oliver, Grote, Rochecouste, & Exell, Reference Oliver, Grote, Rochecouste and Exell2012; Oliver et al., Reference Oliver, Rochecouste and Grote2013). However, Anderson, R. (2013, personal communication) points out that experiencing shame these days depends on an Aboriginal person's background so some young people may not experience shame.
In some cases, anticipating a situation which might bring about shame can cause Aboriginal students to simply evade the encounter or circumstances entirely. This was illustrated in research with Aboriginal vocational education trainees who spoke SAE as an additional language. They acknowledged that they rarely asked their non-Aboriginal trainer clarifying questions and sometimes just avoided talking to them because they feared ‘getting shame’ because ‘other kids might laugh at them’ (Oliver et al., Reference Oliver, Grote, Rochecouste and Exell2012, p. 236). This was attributed to their lack of confidence and fear of being judged on their SAE skills. Aboriginal university students have also been known to refrain from posting comments in an online forum for similar reasons even though it was a unit requirement (Oliver et al., Reference Oliver, Rochecouste and Grote2013).
Competing Knowledge Systems
Aboriginal students have also reported conflicting feelings regarding the notion of self when engaging with Western concepts that disregard Aboriginal worldviews (Malcolm et al., Reference Malcolm, Rochecouste and Hayes2002; Sonn, Bishop, & Ross, Reference Sonn, Bishop and Ross2000). Indeed, Torres Strait Islander academic Nakata (Reference Nakata2013) notes that ‘Understandings of us will always be positioned in academic knowledge in ways that will never fully account for our histories, traditions, and concerns’ (p. 301). Nakata, Nakata and Chin (Reference Nakata, Nakata and Chin2008) assert that universities have a responsibility to equip Indigenous students with the skills that enable them to negotiate the ‘contested knowledge space’ between Aboriginal and Western worldviews (p. 141). Nakata (Reference Nakata2013) points out, however, that focusing on the dissimilarities between Aboriginal and Western conceptual understandings can be a distraction from the overall aim of Aboriginal higher education, that of ‘improving the life-enhancing outcomes for Indigenous people’ (p. 302).
Indigenous Participation and Completion Rates
Increasing both the participation and completion rates of Indigenous students is crucial to effectively address the factors associated with socioeconomic disadvantage that undermine the quality of life in Aboriginal communities (James & Devlin, Reference James and Devlin2006; Pechenkina, Kowal, & Paradies, Reference Pechenkina, Kowal and Paradies2011). While the participation rate is now more than three times that in the mid-1980s (ABS, 2013), recent estimates show Aboriginal students comprising only 1.0% of the entire university student population, which is about half the representation of the general population (ABS, 2013; Australian Government Department of Education, 2014). Moreover, because of their low completion rates, only about 5% of the Aboriginal population have bachelor's degrees, a proportion far smaller than that in the non-Indigenous population (24%) (ABS, 2011; Pechenkina et al., Reference Pechenkina, Kowal and Paradies2011).
Research suggests that a large proportion of the Aboriginal students who do complete their degrees come from middle class families and that those who withdraw are likely to come from lower SES backgrounds (Asmar et al., Reference Asmar, Page and Radloff2011). Of the 526 Indigenous Australians included in the 2009 Australasian Survey of Student Engagement (AUSSE), almost three-quarters came from mid-level SES families and about 44% were not the first in their family with university experience (Asmar et al., Reference Asmar, Page and Radloff2011). This suggests an underrepresentation of students who are disadvantaged by their SES, geographical location or home language (Craven & Dillon, Reference Craven, Dillon, Craven and Mooney2013).
The AUSSE research also found that approximately 36% of Indigenous students considered or intended to abandon their programs (Radloff & Coates, Reference Radloff and Coates2010). Evidence suggests that those most at risk of withdrawal are likely to share one or more of the following characteristics: being in the first year of study, from non-urban centres, a financial aid recipient, an external student, disabled and/or male (ABS, 2011; Asmar et al., Reference Asmar, Page and Radloff2011; James & Devlin, Reference James and Devlin2006). Although these factors may be useful to identify students who might be struggling, Willems (Reference Willems2012), whose research focused on students in distance education, foregrounds the importance of taking into account aspects of the student's life situation which can easily be overlooked. These include linguistic and education background, health, family obligations, accommodation, access to computers and the reliability of their Internet service. However, many of these issues must also be dealt with by students in other modes of study.
University-Based Support Initiatives
Research on the performance of universities in addressing the needs of Aboriginal students suggests that most have developed strategies to increase participation or completion rates, but few are successful at doing both (Pechenkina et al., Reference Pechenkina, Kowal and Paradies2011). A study across 40 Australian universities over a five-year period (2004– 2008) showed substantial variability in terms of the level of support provided. The establishment of Aboriginal support centres is a case in point: some institutions have no centralised support entity while others have a network of three or more, including those connected to particular faculties or schools. The forms of services provided also vary with the more sophisticated support systems offering academic assistance, teaching, and research facilities specialising in Aboriginal studies. Pechenkina and her colleagues (Reference Pechenkina, Kowal and Paradies2011) found that the presence of designated research centres of this kind showed a moderate relationship with high completion rates.
The value of Aboriginal support centres was demonstrated in another research project involving four universities (Oliver et al., Reference Oliver, Rochecouste and Grote2013). Data collected through an online survey showed that most (73%) of the Aboriginal respondents used the services provided by the centres, with the largest proportion seeking academic support. The majority of these students (69%) viewed the services as ‘adequate’ (p. 37) for their needs. These findings are generally consistent with those of the 2009 AUSSE project (Asmar et al., Reference Asmar, Page and Radloff2011), in which 64% of the Aboriginal respondents felt that their university made available ‘quite a bit’ or ‘very much’ (p. 9) academic support. However, whether this assistance was provided by the centres or by other academic staff was not specified. Page and Asmar (Reference Page and Asmar2008) note that although support staff at Aboriginal centres offer academic assistance, they also advise students to seek help from Aboriginal academic staff members, who often provide support that goes well beyond academia. Considerable discussion occurs in the literature regarding the demands placed on Aboriginal centres to extend their support and to provide staff with professional development (e.g., Universities Australia, 2011). This adds to the workload of staff who may not have the appropriate training (Rigney, Reference Rigney, Behrendt, Larkin, Griew and Kelly2012). Several authors, therefore, have called for greater attention to these issues at the higher university administrative level (see Walter, Reference Walter, Behrendt, Larkin, Griew and Kelly2012).
Of particular interest to the present study was a finding from the AUSSE research that showed a strong association between the support levels perceived by students and their intention to complete their program (Asmar et al., Reference Asmar, Page and Radloff2011). In response to calls for research to extend understandings about the barriers that impede student progress and, importantly, the support mechanisms that facilitate it (Asmar et al., Reference Asmar, Page and Radloff2011; Craven & Dillon, Reference Craven, Dillon, Craven and Mooney2013; James & Devlin, Reference James and Devlin2006; Oliver et al., Reference Oliver, Rochecouste and Grote2013; Pechenkina & Anderson, Reference Pechenkina and Anderson2011), the present study aimed to explore student perceptions about these issues.
Methodology
The multimethod design of this project entailed a two-stage process to collect qualitative and quantitative data. In the initial phase, an Aboriginal research team member conducted semistructured interviews with ten participants. Handwritten field notes taken during the interviews were typed into Microsoft Word files and analysed for themes to identify factors that can trigger withdrawal from university and those that facilitate completion. These preliminary findings were augmented with those drawn from a literature review and used to develop an electronic survey instrument for the second stage of data collection. The online survey was designed to elicit student perceptions about which issues might compel them to quit their studies. Participants were also invited to comment freely about factors that had facilitated their progress toward completion. Members of the research team reviewed the format and language of the survey to ensure that it was linguistically and culturally appropriate. The feedback obtained was used to further refine the instrument. A flyer drafted to explain the project and recruit student participants was subjected to the same review process.
SurveyMonkey, Inc. software was used to construct the four-part survey. Questions in the first section gathered the respondent's background information (e.g., gender, age and pathways to university enrolment). The second section asked about the nature of students’ studies, such as course level, subject area and mode of study (e.g., internal, block release, etc.). Details about their accommodation, geographic origins, the prior university experience of family members and their participation (or not) in orientation programs were elicited in the third part of the survey. The fourth section collected quantitative data on particular issues that might contribute to their withdrawal. They were also invited to comment freely on these or other potential triggers. An open-ended prompt was also used to obtain student perceptions about the kinds of support mechanisms and strategies that helped them to continue with their program. This paper reports on the qualitative data drawn mainly on the first three sections of the electronic survey as well as from the preliminary interviews. The quantitative findings are currently being analysed for future publication.
At the beginning of the second semester of 2014, the flyers advertising the project were placed in prominent places across campus, distributed through the Aboriginal research team member's networks and emailed to all students who self-identify as Aboriginal. In order to maximise participation, and in addition to the original permission to undertake the research, further permission was granted from the university's ethics committee to include a draw enabling participants to win one of two iPads. The survey was then made available to students online for 10 weeks. Fifty-seven survey responses were received; 53 were answered in full. The 57 responses represent a 28.5% return rate for the total Aboriginal student population at the university.
The findings from the qualitative data drawn from the initial interviews and the survey of the current study are presented in this paper. Following a profile of the participants, we describe the themes that emerged through an analysis of the qualitative data obtained from the open-ended prompts and interviews. Considering the specificity of the open ended questions, the brevity of the responses and the number of participants, Content Analysis (see Krippendorff, Reference Krippendorff1989, Reference Krippendorff2004) was considered the most appropriate and effective approach.
Findings and Discussion
Profile of Respondents
The students who responded to the survey represent a diverse group in terms of age, gender, community origins (i.e., urban, regional or remote), their current housing arrangements, the educational attainment of family members, their pathway into university, course level, academic focus and mode of study. Since not all respondents answered every survey question (as noted above), the percentage figures in this section represent the proportion of either the 56 or 57 total responses received for each question.
Age and Gender
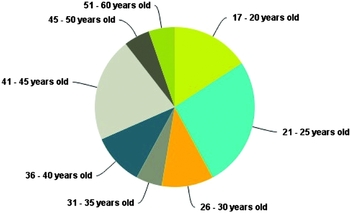
The participants ranged in age from 17 to 60, with those between 17 and 25 years of age comprising the largest group (52.6%; n = 30). This may be a reflection of a growing trend in higher education which has seen a tripling in the numbers of 15 to 24 year old Aboriginal students since 1986 (ABS, 2013). Figure 1 provides an overview showing respondents aged 21 to 25 and those between 41 and 45 as having the greatest representation. The youngest cohort (aged 17 to 20) comprised the next largest group.
Survey participant ages.

The majority of respondents were women (77.2%), a pattern that is consistent with the 2009 AUSSE data (Asmar et al., Reference Asmar, Page and Radloff2011). (See Flood, Reference Flood, Craven and Mooney2013 on the higher rates of mature aged Indigenous women in Australian universities; and ABS, 2013 regarding the higher rates of women in the overall university student population.)
Home Communities, Living Arrangements and Family Experience in Higher Education
Data in the present study showed that the participants came from diverse geographic backgrounds, with about half (50%) from urban environments, just over a third (35.7%) from regional towns and a few (14.3%) from remote areas. At the time of data collection, the majority (62.5%) lived with family members, almost a quarter (23.1%) shared housing with non-relatives and only a few (about 9%) were living on their own.
Just over half (53.6%) of the respondents had family members who had attended university. This proportion is somewhat lower than that indicated in the 2009 AUSSE data (Asmar et al., Reference Asmar, Page and Radloff2011). It is interesting to note, however, that in our data, among those whose family members had university experience (46.4%; n = 27), most were the second (56.7%; n = 17) or third (13.3%; n = 3) generation to participate in higher education.
Entry Pathways, Course Levels, Academic Interests and Modes of Study
Nearly a third of respondents (29.9%) indicated that they had entered university through the traditional pathway following high school. The next largest group (26.3%) enrolled as mature-aged students, with the remaining enrolling through TAFE, Aboriginal bridging courses, Aboriginal admission programs, undergraduate degrees, diplomas or other alternative pathways. Although most were undergraduates (82.1%), a few were postgraduates (16%); one respondent was enrolled in a bridging course. Most of the 57 respondents (67.9%) were studying on campus, others externally (16.1%) or in block release programs (16.1%). A slight majority (55.4%) studied full time while others were enrolled in either part-time (26.8%) or in block release (17.9%) arrangements.
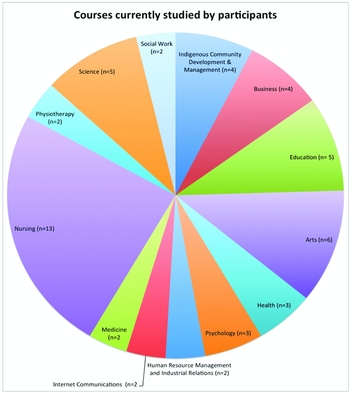
Participants were studying in a variety of fields, a finding which supports the work of Oliver et al. (Reference Oliver, Rochecouste and Grote2013) in which it was reported that Aboriginal student interest was no longer limited to the traditional areas of Indigenous Community Development, History, Health (e.g., Nursing, Midwifery) or Education (although enrolments in these areas of study were still evident). Our data show Aboriginal student participation in areas including IT, Psychology, Physiotherapy, Science (e.g., Engineering, Geology and Environmental Biology) and the Arts (e.g., Graphic Design, Professional Writing, Journalism & Photography). Figure 2 shows this considerable distribution across faculties.
Percentage enrolment areas of survey participants.

Most Valued Support Structures
In response to the open-ended survey question: What things have helped you to continue with your studies? (List the types of academic support, personal support, or other strategies you have used to help you get through your studies), and the interview question: What things have assisted you in your studies? the most frequently cited support mechanisms were participants’ families and other individuals within the students’ personal, professional and university-based networks. There was also frequent mention of their own personal qualities and the study practices which they adhered to in order to ensure academic progress.
Family
Support from family members featured most prominently in the qualitative data and was often deemed to be the major factor in the students’ completion, for example, ‘[I get] a lot of support from my family and they are the only reason I have been able to complete university.’ They also noted the ‘unwavering support of my family’, ‘the unconditional love/support from family & friends’, and that ‘[m]y mother has been in constant contact & kept reassuring me that everything is going to be OK’. Previous research has demonstrated the value of a supportive family structure (Flood, Reference Flood, Craven and Mooney2013; Oliver et al., Reference Oliver, Rochecouste and Grote2013), but it cannot be ignored in terms of recommended advice for all future students regardless of their backgrounds.
Personal and Professional Networks
The networks that the participants had developed in their personal, professional and university lives also emerged in the data. The assistance of friends and work colleagues was prominent, including valuing the ‘support network’ developed on a ‘friendly campus’ and noting ‘supportive people at university’. As one respondent reported, for example ‘I am involved with good people who want to see me succeed.’ Others underscored the importance of their ‘relationships with fellow students’ and ‘hearing other Indigenous students’ success stories.’ Those studying via block release arrangements highlighted the importance of ‘peer support from fellow students who are going through the same things’, ‘the feeling of not being on your own to study’ and benefitting from ‘friendships with fellow students’.
Support from Academic Staff
Although mentioned less frequently, support from staff (i.e., lecturers, tutors, and Aboriginal centre staff) still featured strongly. Participants valued ‘connecting’ with ‘supportive lecturers.’ A student enrolled in a block release program noted that ‘lecturers have been instrumental in supporting me through this course, as are the students. I feel this is a saving grace.’ Similarly, there was mention of lecturers who are ‘easy-going and approachable’, ‘who are just as keen to teach as you are to learn’ who were the ‘biggest support’, and of ‘get[ting] the one in a million lecturer who is positive, supportive, helpful and interesting’ which is ‘a major factor’ in succeeding. A valuable strategy employed by some students was ‘[c]onnecting with lecturers on a personal level by taking the time to get to know them’. This they felt was advantageous to their academic progress.
Support from Aboriginal Centres
Several respondents singled out the support provided by their Aboriginal centre, especially the access to the library and computers. The staff at Aboriginal centres were described as ‘friendly’ and ‘extremely helpful’ and contributing to their academic progress. For others the Aboriginal centre provided more than resources, such as the opportunity ‘just to be with other Aboriginal people’ and described it as a ‘comfort zone . . . to relax and chill.’ Clearly Aboriginal centres play an important role in student completion and are of considerable benefit to students; however, Oliver et al. (Reference Oliver, Rochecouste and Grote2013) raise a cautionary concern about the extent to which the use of these centres prevents students from fully engaging with the mainstream university community.
A number of students highlighted the value of the tutors organised by the Aboriginal support centres through the Indigenous Tutorial Assistance Scheme (ITAS). They stated that being able to ‘connect with’ the tutor and that ‘having an ITAS tutor is the biggest help. This not only helps me with my academic progress, but also keeps me motivated as well’.
Support from University Services
The mainstream services and resources that were provided by the university were also recognised by students as facilitating their progress. While some students might take these for granted, one participant valued amenities ‘such as the [library name] being open 24/7, the computers. . ., the renovated campus, the food available on campus, the consultation times available with the unit coordinators and the tutorials available, the counselling services. . . and health services. . .’. Other services mentioned included counselling, the Equity Officer, cadet programs and being able to communicate with lecturers by email.
Orientation Programs
Participants in the present study who attended their centre's orientation program reported finding it generally helpful. For example, the session made it possible to make ‘friends, as well as helped me understand the university life and it motivated me to do the best at university with a great support system.’ Additionally the information offered was very practical in alerting students to the availability of ‘scholarship support services, tutoring opportunities and printing needs, as well as giving me familiar faces and a point of contact for any questions.’ The financial support provided by scholarships was also noted by numerous participants in enabling them to continue with their studies.
While the respondents were generally satisfied with the orientation session provided by their Aboriginal support unit, several expressed a desire for more initial information and on-going contact with mainstream schools and faculties. For example, disappointment was expressed in that the ‘faculty orientation [was a] one off to inform me who staff was and support.’ A valuable comment was provided by a third-year undergraduate student who was obviously able to reflect on a study experience of some years. She asserted that the Aboriginal centre should take a more holistic approach to assisting students, particularly those in mainstream courses. She argued that
More preparation and support is needed to ensure students can reach full potential [and be] inclusive of the individual's emotional wellbeing. . . [L]earning about the practicalities of time management and organisation should be addressed as early as possible. The [Aboriginal centre name] needs to encourage more social events to combat isolation as an Aboriginal or Torres Strait Islander student in the mainstream courses. Those in mainstream should be assigned a suitable mentor at the beginning of their study journey and this mentor should be fully skilled and equipped with a MAINSTREAM [emphasis original] understanding!
Individual Qualities and Study Practices
Reference to one's personal abilities, whether described as motivation, ambition, strength, determination, desire, drive or commitment to success, has rarely been the focus of studies of Aboriginal university students. However, one recent study has found a relationship between self-concept, disciplined learning practices and academic achievement among Indigenous Australian and Native American university students (McInerney & King, Reference McInerney, King, Craven and Mooney2013) and two other studies have explored self-concept in relation motivation to pursue further education among Indigenous high school students (Bodkin-Andrews, Dillon, & Craven, Reference Bodkin-Andrews, Dillon and Craven2010; Bodkin-Andrews, Harwood, McMahon, & Priestly, Reference Bodkin-Andrews, Harwood, McMahon, Priestly, Craven and Mooney2013). The present study demonstrates that students themselves believe that their own personal qualities are an essential resource to sustain their studies. This is exemplified in the following statements: ‘A large component is motivation through goal setting’, ‘My own determination to finish’, being ‘self-motivated’, ‘self-disciplined’ or having a ‘personal desire’ to succeed. In some cases, participants turned (what others saw as) potential impediments into resources. Mature aged students noted, for example, that they could draw on their age and maturity as assets, despite previously thinking that ‘being too old to study’ would be problematic –– a finding also evidenced in the 2013 research of Oliver et al. One student however reported feeling ‘weird and outta place’ when ‘seeing a lot of young people around’. Another referred to ‘stress’ as a source of motivation. Alternative strategies included professional ambition, such as ‘wanting a better, well-paying job’ and being a model for one's children. Others foregrounded their own organised, systematic approach to studying, detailed as ‘[I] plan out my “to do list” and also do assignments at university [since I] cannot study at home’. Another student maintained that her ‘quiet area to study at home’ was requisite.
Several respondents were motivated by their own ‘interest in the subjects and learning material’, for example, being ‘excited about marketing’ or driven by an ‘interest in journalism and the willingness to go forward.’ Such confidence and commitment was aptly stated in the assertion that ‘nothing I face now can make me quit my studies.’
Proving oneself in spite of evidence of the lack of educational success among Aboriginal people was also a motivator, for example:
I started to think about all the literature I had read over the years, the studies completed that statistically ranked me as being in a group of individuals who are unlikely to succeed at tertiary education. It was a challenge to continue studying as everything I read told me I should not be able to do what I was doing. I had to change the way I think.
Reference was also made to overcoming the disbelief at having completed undergraduate study and having entered postgraduate study: ‘The experience of finishing my undergraduate degree in Anthropology hadn't really sunk in. So what I did to further motivate myself is to get the university to write a letter to myself to state that I’ve finished my undergraduate course’.
Others saw their Aboriginality as a resource that kept them focused on their aspirations. For example, being motivated by a determination for ‘helping my mob.’ (See also Oliver et al., Reference Oliver, Rochecouste and Grote2013, on students being motivated by a desire to ‘give back’ to their communities.) In the following comment, ‘seeing the bigger picture of helping my mob’ illustrates this degree of commitment:
RESPECT AND UNDERSTANDING [emphasis original] of/for the historical and contemporary struggles of our ancestors and community today. This alone empowers me. Wanting to provide better for my family and serve the community in my chosen discipline. Raise and address the historical injustices of the past and those that continue to be experienced by the majority of Aboriginal communities, both urban and remote today.
Impediments to Completion
Data in this section were collected in response to the open-ended survey question: Do you have any final comments to make about what would make you quit your studies? And the interview question: Have you experienced any issues that may make you think about withdrawing/deferring? When asked to comment freely about these factors, many participants indicated that a lack of academic support could be an obstacle. Financial stress and workload pressures were also common themes which were mentioned separately or in conjunction with family responsibilities and health matters.
Availability of Support from Teaching Staff, Schools and Faculties
Some participants commented about the lack of assistance available from teaching staff, schools and faculties. Three undergraduates in health-related programs, for example, indicated their inability to obtain help from lecturers and schools. One explained that he was
really disappointed in the lack of support for mainstream Indigenous students and also feeling isolated as I am the only Aboriginal student in my class. There has been no mentoring or contact from the Indigenous school faculty to see how I am progressing or if I have any problems.
This suggests a hiatus between support provided by Aboriginal centres and that available to mainstream Aboriginal students. Considerable discussion on whose responsibility this is has been raised in the literature (see Andersen et al., Reference Andersen, Bunda and Walter2008; Oliver et al., Reference Oliver, Rochecouste and Grote2013).
Difficulties for those students living in a remote community and studying in block release mode were also identified. One respondent referred to ‘not having the opportunity to have tutors is . . .[an] issue because out in remote areas, it is very difficult to get mentors or tutors who can fully understand what you are doing.’
Other respondents communicated their dissatisfaction with the ways in which teaching staff responded to their requests for help. Several described staff members as being ‘dismissive’ and ‘unhelpful’, with one indicating that ‘there have been times when I wanted to quit’ because of such incidents. A first-year undergraduate explained that she ‘felt really SHAME [emphasis original] at times to ask for help from my lecturers and when I did try, he said “I don't have time to help you” [and] immediately turned his back.’ Another first-year undergraduate characterised a lecturer's response as ‘condescending’ when she asked for an extension and the lecturer talked to her in a ‘simple way.’
The following interview extract illustrates the commitment that can stem from detrimental attitudes:
I felt like the big bosses at the top of the university wanted to get rid of me and was just gonna sweep me under the rug. I was also dealing with my wife at home battling cancer and I really felt helpless and alone. I came across a fella named [name] one of the staff members at [name of Centre] told me I should do a test for learning styles and I found out for the first time in my life that I have dyslexia. This sort of made me realise I wasn't dumb and stupid as I’ve come to believe from my whole schooling life. The next step that happened for me was the Centre [name] staff had gotten on my side and vouched that I should be in uni and all I can say is I’m now here studying. . . . Nothing I face now can make me quit my studies because I believe for the first time in my life that I’m not feeling belittled from learning capabilities of having dyslexia. I also have to do it for my two little children and show them that daddy is gonna come on top, and if I quit, what example am I setting for them.
Stereotyping by a non-Indigenous staff was also reported. One participant described how she had been very disheartened by comments from a unit coordinator. ‘Comments have been made to me such as “you people”, “those people” and also . . . presumptions made about my “learning needs” without having spoken to me first. Academic staff's ignorance to Aboriginal people is appalling. For this reason I almost left [university name] last semester’.
‘Juggling’ Finances, Jobs, Family and Course Workload
A number of participants reported that financial ‘constraints’, ‘difficulties’, ‘hardship’ and ‘not having a job to help [finance] their studies’ could threaten their ability to complete their programs. Others who did have jobs noted the difficulty of ‘juggling family, work [and] study.’ In addition to covering living expenses while studying was the cost of honouring family and community responsibilities such as the ‘financial burden of travelling to Tasmania’ to attend funerals of family or community members, and the time that this involves: ‘I’ve attended a lot of funerals because I’m from a huge family and it takes away time from uni’. Thus, while specific information about participants’ backgrounds was not collected in the survey, the above familial and cultural responsibilities do indicate considerable impact on students’ university experience.
Some participants noted that the stress of managing family responsibilities along with their course workload was a potential reason for withdrawing. (See also Flood, Reference Flood, Craven and Mooney2013 regarding Aboriginal women who often postpone their studies because of family responsibilities.) Difficulties arose not only because of the ‘end of year workload’, but also the ‘fact that [the] course is inflexible’. It was explained that in addition to the challenge of managing a ‘heavy workload’, which included ‘attendance in pracs [that were] 100% mandatory’, there was the need to help ‘transport’ family members and attend funerals. The time commitment to studies was also noted: ‘[the] course expects 48 hours [of] study per week, with at least 20 contact hours on campus. This would be impossible if I didn't have family caring for [my son] for free for long hours. This would be the most likely reason for quitting.’
In some cases, the health issues of family or community members can impact on study time. This included having ‘to deal with [a lot of] sickness, chronic disease, tragedies and even deaths from the region and the community I come from. . . .[This is] the challenge I am faced with on a daily basis’.
While many students reported highly supportive families, some mentioned a lack of understanding and support or even discouragement among family members which imposed an impediment to academic success. This included the attitudes of some family members which were ‘a big obstacle.’ One student, for example, had to ‘manage’ comments from her father such as ‘[you] think ya better than everyone else?’ (See also Flood, Reference Flood, Craven and Mooney2013 and Oliver et al., Reference Oliver, Rochecouste and Grote2013 above regarding similar reports from Indigenous students.) For others, it was the inability to access family support because of the distance from the home community: ‘having no family support down here in Perth and I felt real lonely unlike back home there was ten family members I could bounce off of when I needed some[one] to yarn with for company’. Leaving family and community caused a number of students to feel ‘homesick’, ‘left on my own’, due to having no local support network or having to cope with the ‘loneliness’ of studying ‘at PhD level’.
Financial issues were frequently reported as affecting the wellbeing of students and, therefore, their ability to continue with their studies. Sometimes family members were able to help financially and motivationally, for example, ‘my mother flew in and gave me some money to sort out my finances and had a good yarn with her. It then reinspired me for studying and looking at her for inspiration of juggling family and work has made me more motivated to finish my studies’. However, it was not unusual for a student to be unaware of the support that is available or even to have been awarded financial support and then to be unaware of it, for example
[I] suffered greatly from mental illness for most of my course and it greatly affected many of my studies. . . My illness stemmed greatly from my financial situation and my inability to receive help from the government due to my parent's financial situation. I never knew there was help available.
Scholarships have been great for supporting me financially but I didn't realize I got them. Since everything is sent to your [name] channel email.
Similar evidence of students failing to receive the support they qualify for has been reported in Oliver et al., Reference Oliver, Rochecouste and Grote2013.
Experiencing the University System
Several respondents mentioned that they had not been made aware of ‘how overwhelming the uni experience is, such as moving from A to B, and you’re but one person to a class of well over 70 people. So you’re just expected to know you’re way to and from lecture theatres’. Respondents described how they felt that there was an expectation that they would no longer need the support offered during their Bridging program, for example, ‘once Bridging was done you’re left alone and expected to know exactly what you’re doing’. They noted a lack of support at the faculty or school level and a need for on-going mentoring. Others noted ‘cultural alienation’ and exclusive references such as ‘you people’ and ‘those people’ (as seen above) and an overall ignorance among staff regarding Aboriginal people. Such implicit cultural insensitivity has been noted as more concerning to students than the explicit racism reported in Sonn et al. (Reference Sonn, Bishop and Ross2000). In fact, there was only one report in the current data implying the existence of racism, ‘I have been fortunate to have developed a sense of resilience over time to deal with certain difficulties, like racism etc., and won't let it stop me from reaching my goal, and from helping my people do the same’.
No reference was made in the qualitative data to difficulties in mastering academic literacy skills posing a barrier to completion. This is in spite of the majority of respondents (68.42%) being in their first undergraduate year. While specific information about participants’ language backgrounds was not sought in the survey, it appears that a considerable proportion of the cohort would have had some experience with the demands of academic reading and writing. For example, some 73% of the cohort had been enrolled in a university course previously; had already completed a certificate or diploma; or were enrolled in post graduate studies having previous completed an undergraduate degree.
Overall, the barriers to completion experienced by the student cohort in the current study showed marked similarities to those found by previous scholars (e.g., Ellender, Drysdale, Faulkner, Kelly, & Turnbull, Reference Ellender, Drysdale, Faulkner, Kelly and Turnbull2008; Malcolm et al., Reference Malcolm, Rochecouste and Hayes2002; Oliver et al., Reference Oliver, Rochecouste and Grote2013).
Conclusion
This study demonstrates a diversity of make up within this cohort of Aboriginal student participants in terms of their personal backgrounds, living and studying arrangements and academic interests. Although some are enrolled in courses with an Aboriginal focus, most are engaged in mainstream disciplines. This pattern supports previous research (e.g., Oliver et al., Reference Oliver, Rochecouste and Grote2013) and indicates that universities and faculties need to be aware of the broad spectrum of interest among contemporary Aboriginal students. Further, this is not just the responsibility of Aboriginal centres –– it also has implications for universities as a whole, particularly as there were several participants in our study who reported feeling isolated and left to fend for themselves in their mainstream programs.
Although there was some consensus among the students who participated in this study regarding the positive support received from teaching staff, there was still evidence of requests for help being thwarted. Supportive relationships with lecturers are basic to students’ academic progress and their eventual completions. Yet some respondents report that such connections are rarely sustained beyond the initial introductory sessions. This finding provides further support for the claims of Andersen, Bunda and Walter (2008, after Attinasi, 1989) who suggest a need ‘to optimise the degree of comfort, cultural and academic, of beginning students. The first semester and the first year are critical times for Indigenous students’ (p. 4).
Recommendation: Schools, faculties and the Aboriginal support centre(s) need to adopt a collaborative and across university approach to improve communication with Aboriginal students and in order to track their progress, throughout their course, but especially in their first year. (See also Oliver et al., Reference Oliver, Rochecouste and Grote2013.)
It is also clear that there remains a need among university staff to develop understanding about Aboriginal students’ learning requirements, such as building positive relationships as this is critical for their educational success (Byrne & Munns, Reference Byrne, Munns, Beresford and Partington2012; Grote & Rochecouste, Reference Grote, Rochecouste, Beresford and Partington2012; Universities Australia, 2011).
Recommendation: Schools and faculties need to ensure that their teaching staff respond to student needs appropriately by providing mandatory professional development programs that encourage them to develop positive relationships with their students (Bradley, Noonan, Nugent, & Scales, Reference Bradley, Noonan, Nugent and Scales2008; Grote, Reference Grote2008; Oliver et al., Reference Oliver, Rochecouste and Grote2013; Universities Australia, 2011).
Increasing the retention and completion rates of Aboriginal students, particularly in the broad range of study areas in which they are now enrolled, as shown in this study and in that of Oliver et al. (Reference Oliver, Rochecouste and Grote2013), requires a broader approach. However, establishing Aboriginal student success as core business in the higher echelons of university appears to be no mean feat. Gunstone (Reference Gunstone2008) notes that university responsibilities towards a range of factors affecting Aboriginal students (including support and student success, completion and retention) have been of ‘critical importance’ in research for over 20 years. In spite of this, he claims that universities continue to fail to review their policies and governance structures to address these issues. Indeed in a review of university responses to support, retention and completion between 2000 and 2007, he noted an actual decline in these areas rather than improvement. This finding continues to be reflected in more recent research, and in the findings of this study, suggesting that universities are still failing to prioritise the needs of this student cohort.
Recommendation: Universities as a whole need to take more responsibility for supporting Aboriginal students rather than leaving it entirely to Aboriginal centres (see Andersen et al., Reference Andersen, Bunda and Walter2008; Oliver et al., Reference Oliver, Rochecouste and Grote2013). We support the view that student support and successful completion needs to be recognised as ‘core university business’ (Andersen et al., Reference Andersen, Bunda and Walter2008, p. 1).
In addition to students’ desire for learning and mentoring support, another issue to emerge concerns the financial struggle of many Aboriginal tertiary students. Despite the availability of scholarships and other forms of financial aid, ‘juggling family, work [and] study’ can impinge on their study time and compromise their wellbeing. While some students are able to access financial aid or other forms of assistance, others were less aware of the help available.
Recommendation: Explore more effective ways to disseminate information about financial support and scholarships.
Despite these concerns and areas for improvement, a number of positive outcomes emerged from the current data. While issues of racism and experiencing shame have been reported in earlier studies (see also Nguyen et al., 2014; Rochecouste, et al., Reference Rochecouste, Oliver, Mulligan and Davies2010), it appears that, although raised in passing, these issues alone are not contributing to decisions to discontinue studies by today's Aboriginal tertiary students. This could be the result of resilience built up during previous schooling or life events and changes to university practices.
Surprisingly there were also no references to difficulties with language or accommodating western knowledge systems in the identification of barriers to completion. This is in spite of much reference to these areas in earlier research (See Abdullah & Stringer, Reference Abdullah and Stringer1997; Malcolm et al., Reference Malcolm, Rochecouste and Hayes2002; Nakata et al., Reference Nakata, Nakata and Chin2008; Oliver, Grote, Rochecouste & Exell, Reference Oliver, Grote, Rochecouste and Exell2013a, Reference Oliver, Grote, Rochecouste and Exell2013b).
Most noticeable in the data was the self-reporting of high levels of motivation and determination (noted also by Oliver et al., Reference Oliver, Rochecouste and Grote2013). Unfortunately, as mentioned above, few studies have paid attention to such strengths. Therefore, we suggest that this opens an area of future study which would be fundamental in changing attitudes towards Aboriginal tertiary students and Aboriginal people as a whole.
Recommendation: Further research should be conducted, including a review of previous studies, with a particular focus on the motivation and determination of Aboriginal students.
Acknowledgments
The authors of this paper acknowledge the support and funding provided by the National Centre for Student Equity in Higher Education (NCSEHE) at Curtin University, Western Australia. We are also grateful for the many valuable contributions of students who volunteered to be interviewed and who responded to the survey.