In modern societies, crowds and mass gatherings are recurrent. A sporting or comedy event can attract up to 70,000 people. Mass gatherings can lead to problems. The combination of inadequate facilities and inefficient population management can lead to injury and death. A stampede to watch a football match in Hillsborough, England, in 1989 led to 95 deaths and 400 injuries.Reference Fruin 1 On July 2, 1990, during a religious ceremony in the MENA region near the city of Mecca, about 1400 pilgrims died because of crowd pressure.Reference Friberg and Hjelm 2 The World Health Organization defines a mass gathering as any organized or spontaneous situation in which a large number of people are present and the host of the event suffers effort and pressure in order to plan resources and respond to them. Crowd or overcrowd is the term known as another level of mass gathering in dome resources, which is mainly associated with replacement and population mobility.Reference Abubakar, Gautret and Brunette 3 Lorenzo defined a crowd as an excessive and intolerable density of people at a specific time and place.Reference De Lorenzo 4 Soomaroo and Murray defined a crowd, in a study conducted in 2012, as the movement of a dense crowd in a specified environment, which disables people to move.Reference Soomaroo and Murray 5 The World Health Organization as the most important research center on mass gatherings and crowd in the world classifies mass gatherings as follows: mass gathering, large mass gathering, ultra large mass gathering, very large mass gathering, and extremely large mass gathering. The size and number of the gathering, the location of the gathering, and the purpose and duration of the gathering are among the factors affecting management and accidents resulting from mass gatherings. In terms of the number of victims and injured, gatherings and overcrowding can be classified into slight (without any casualty or injured), medium (between 1 and 10 casualties), severe (11 to 100 casualties), devastative (more than 100 to 1000 casualties), and terrible (more than 1000 casualties). 6 Two crowd patterns of identical movement and direction and troubled movement are presented in terms of the crowd and the individuals’ behavior in gatherings, which can lead to accidents. Mass gatherings caused by accidents or mental stimulation of the people in the area can lead to crowds and can lead to injury or death due to population pressure.Reference Klupfel 7 Sudden escape due to disasters such as fires, explosions, or natural disasters such as floods and earthquakes, and the rumors and panic present at the gathering, can underlie the lack of control and collisions between individuals.Reference Reicher 8
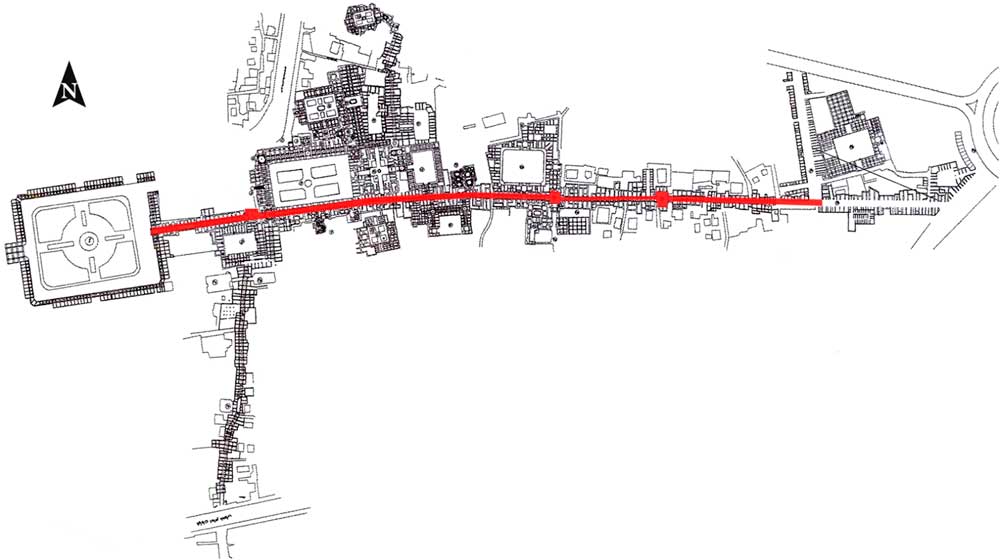
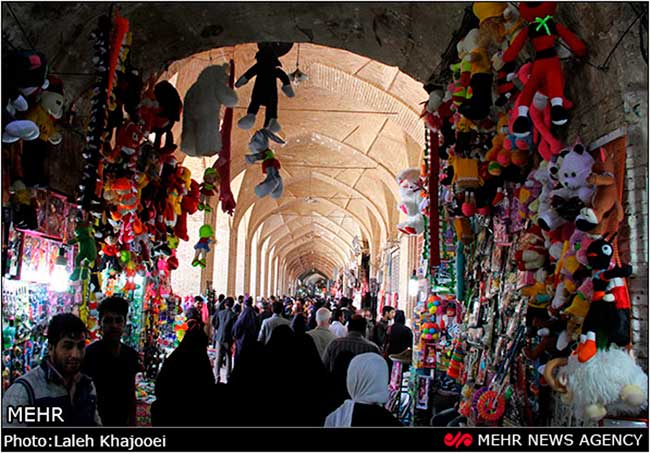
Among the areas in ancient and modern cities that have always been considered a crowded area are bazaars and commercial complexes. These places accommodate thousands of visitors and customers daily.Reference Oberhagemann 9 Kerman’s bazaar, which is the longest indoor bazaar in Iran dating back to about 400 years, is located in the center of Kerman city. An average of 5000 people visit the grand bazaar in Kerman every day. The whole length of the bazaar from East to West—from the Arge square to Mozaffari bazaar—is about 3 km, with an average width of 4.48 m and a height of 7.10 m from the bazaar floor to the center of the vault. The walls are made of brick and adobe in the Isfahani style and the Safavid era.Reference Re and Rouz 10
Simulating people’s behavior in crowds and gatherings can assist in the planning and management of gatherings, especially in emergency situations such as fire. Emergency evacuation of people in gatherings and crowds requires prediction and determination of population behavior patterns.Reference Foudil Cherif 11 Simulating crowd behavior allows for locating of emergency exits, access roads for aid groups providing humanitarian aid, and resources needed to manage the crowd.Reference Kuligowski 12
In the present study, we determined the crowd pattern and the critical gathering point in the grand bazaar of Kerman with regard to personal behavior in emergency conditions. Explaining individuals’ movement orientation and ultimately determining the orientation of an individual’s movement pattern may aid groups and responsible organizations in crowd management and planning to reduce injuries and human mass movement at the time of accidents such as fire explosion, emission of toxic gases, roof collapse, or natural disasters. Such planning may reduce losses with overcrowding as the result of weakness in aiding and predicting high-risk situations in the Kerman bazaar.
METHODS
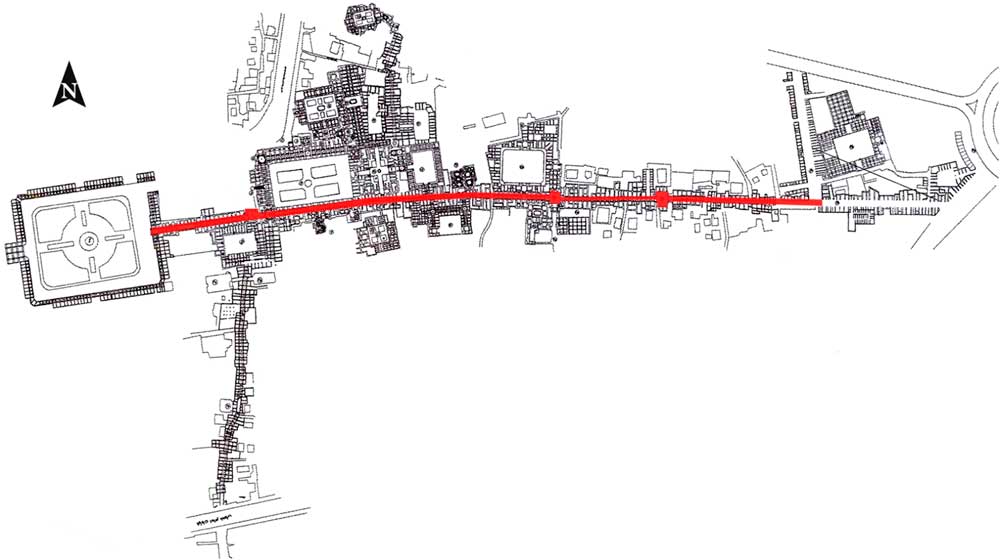
This study aimed to determine the population crowd pattern and the critical density point in the grand bazaar of Kerman. First, the length and width of the grand bazaar of Kerman were derived from reputable resources and maps in the Kerman Administration of Cultural Heritage (Figures 1 and 2). Then, along with interviewing experts and people who were regularly present in the bazaar, the right time was selected for the study regarding the day and time of implementation. In order to collect data, reliable maps of the Kerman bazaar were initially prepared. Next, the total length of the Kerman bazaar was divided into 20 sections of 26.5 by 4.5 m2. Three statistical volunteers in each section proceeded to collect the required data by a census method using a questionnaire, which included questions about age, gender, weight, height, accurate current position, and the escape direction of people who might be present in the bazaar after an accident. To determine the critical density point, height and weight data were placed in the formula
 $$s\,{\equals}\,\sqrt {{{L{\vskip -1.5pt \,\,\asterisk\,\,}M} \over {3600}}} $$
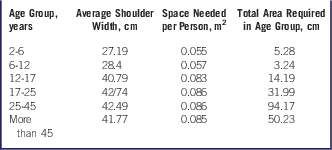
and the outer body surface of all the individuals in the bazaar was calculated. In this formula, s represents the body surface in square meters, L represents height in centimeters, and M represents weight in kg. The number resulting from this formula was the outer body surface of anyone in the bazaar. The outer surface can be used to determine the vertical occupancy rate of each individual. The land area occupied by the individuals was determined with respect to their shoulder width.Reference Oberhagemann 9 The average shoulder width of the Kerman people to the ratio of height and the relevant age group was extracted from the results of a previous study.Reference Hassan, Elyasi and Rashidzade 13 By studying the relationship between the occupied land area and the total usable area in Kerman bazaar, the crowd densities in normal conditions were determined by the formula
 $$D\,{\equals}\,{A \over S}$$
where D, A, and S are density, area, and body surface, respectively.
Aerial Map of Kerman Bazaar and the Ganjalikhan Complex of Kerman.
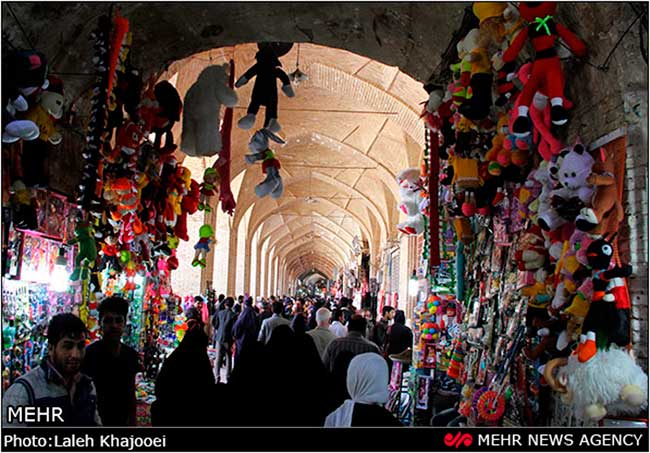
An Interior Image of Kerman Bazaar.
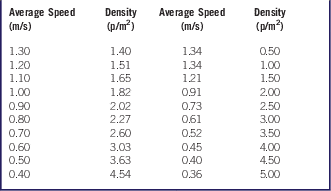
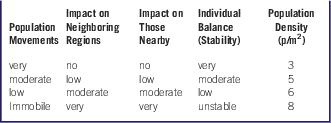
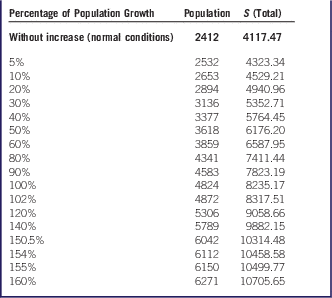
Then, the crowd density was increased by gradually adding the number of people in different age groups and with a constant coefficient. This process continued until the available space to each person reached 0.085 m2. The number of people at this point equals the critical density point of Kerman bazaar. Simulating the crowd was conducted by using flow-based modeling and according to data obtained from distributed questionnaires.Reference Almeida, Rosseti and Coelho 14 In this way, using the equation (Flow rate=Density * Speed), the flow rate was determined and by use of SketchUp Pro software (version 8; Trimble, Sunnyvale, CA), the movement of each person based on 4 directions and the general flow rate were simulated in the three-dimensional environment of Kerman bazaar. Crowd speed was obtained from the average population speed/density (Table 1).Reference Still 15 Using the calculated density at the critical gathering point and the movement speed of the crowd, the crowd pattern was simulated after an accident in Kerman bazaar. The effect of population density (number of people per square meter) on adjacent individuals and spaces will differ in various positions. To determine the effects of critical crowd density in different positions, the results of the study by Oberhagemann,Reference Oberhagemann 9 which studied fixed and mobile population densities at large social events, were used (Table 2). According to a study conducted by HagmanReference Oberhagemann 9 , if population density in an area reaches 50 cm2 for every person due to the overpopulation, the population may reach its critical crowd density. In these conditions, the created gathering and crowd changes to crisis and its primary outcome will be damage to the individuals; however, individuals walking in a large or a moving crowd need 2.3 m2 of space in normal conditions. In a space less than 30 cm2, the individuals unintentionally and involuntarily put others under pressure. In the case where physical space in a crowd is reduced to 20 cm2 per individual, the population pressure and subsequently the psychological pressure would reach a higher degree of danger.
Estimated Population Speed in Terms of Density

Impact of Population Density in Different Situations on Adjacent Areas and Individuals

Based on the above table, when the population density reaches 8 people or more per square meter, external pressure resulting from the population density increases and leads to severe movement restriction. In case the population density reaches 8 people per square meter, signs of asphyxia appear due to pressure on respiratory muscles of the chest wall. After about 2 to 3 minutes, loss of consciousness and irreversible damage to the brain will occur due to oxygen deficiency. In fact, these symptoms may occur when a force of 800 to 900 N imposes on the chest. In other words, the required force for such a lethal pressure may be due to the pressure of 10 to 12 rows of people in a population with a density of 8 p/m2. Mechanical injuries such as fracture of the organs can be caused by a force of 10 kN or the push-forward force by 120 rows of people in a crowd. In order to determine the critical population point of Kerman bazaar, the maximum population density per square meter was calculated. The maximum population density based on the minimum space required for an individual was calculated (0.085 m2) according to the area of usable space for pedestrians in the bazaar. The critical density in a moving population is an average of about 8 people per square meter. The space available to every person in this situation would be about 0.68 m2.Reference Hassan, Elyasi and Rashidzade 13
RESULTS
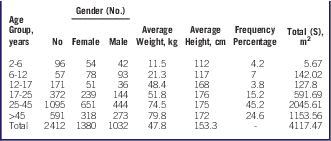
The demographic characteristics of the people in the studied area of the Kerman bazaar as collected by questionnaire are shown in Tables 3 and 4.
Demographic Data of the Research Population in Kerman Bazaar

Demographic Data of the Population Groups Studied in Kerman Bazaar

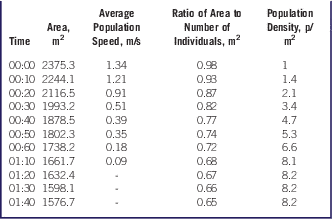
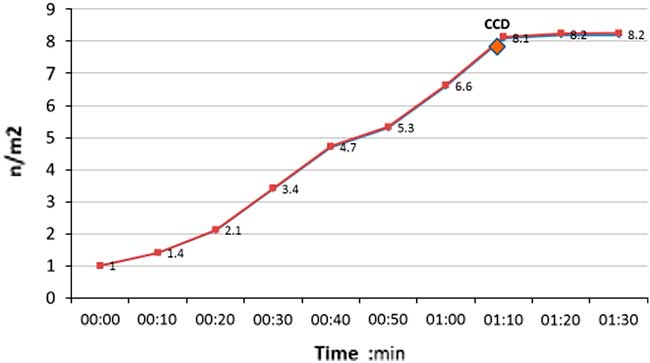
Population density at the time of the study and with 2412 people was determined to be 1.73 on the basis of the above results. Since the minimum required space for a person under normal conditions is about 0.085 m2 and according to the average S of the crowd present in the research environment, in an accident, if the population of the Kerman bazaar reached 6112 people with a total S of 10458.58 m2, the minimum space required for each of the people present in the crowd would reach 0.085 m2. In other words, under such circumstances, the population density would reach 8.1 p/m2 and the critical point. In such a situation, the psychological effects resulting from the crowd would unintentionally lead to increased population pressure and secondary damage such as asphyxia due to pressure on the chest and mechanical damage such as fracture in the ribs. Reaching the critical point density can occur after disasters, especially manmade accidents and a sudden injection of population from the lateral and main bases of the bazaar. In the case of an accident, followed by population density in the extent of 8.1 p/m2, population density side effects without an increased number of people are observed in the bazaar, especially in entry and exit (Tables 5 and 6).
Total External Surface (S) in Different Population Situations

Population Density at Time Intervals After an Accident

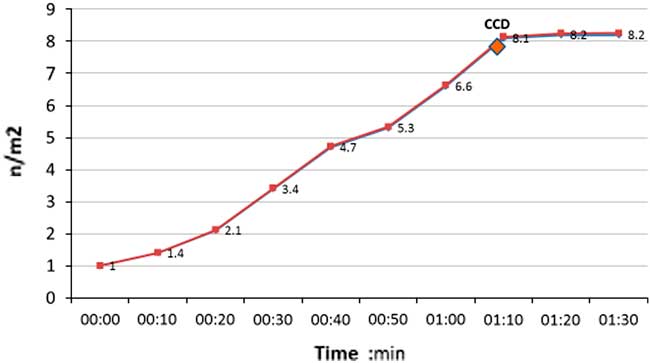
According to Figure 3 and based on the population flow rate in events such as an explosion or fire, the population density in Kerman bazaar will reach the critical crowd density in 1.10 minutes after the event. This density will be created at a 167-m distance from the eastern exit of Kerman bazaar and the lateral port.
Population Density and Critical Gathering Point (Density) of Kerman Bazaar After an Accident.
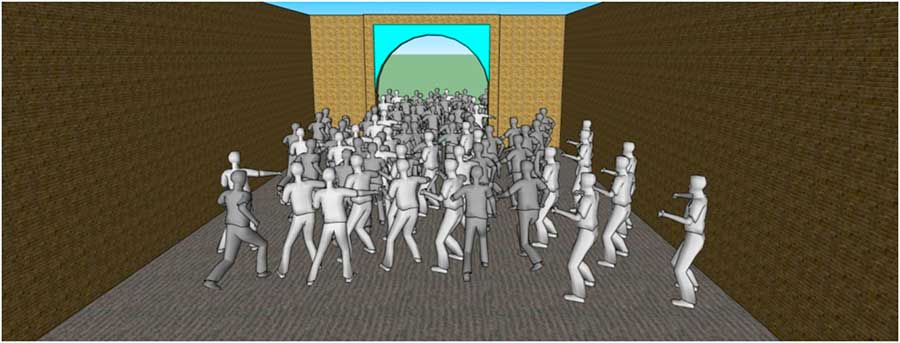
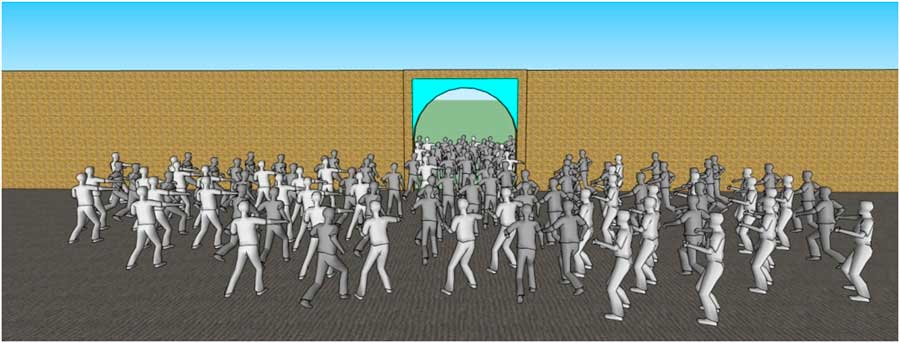
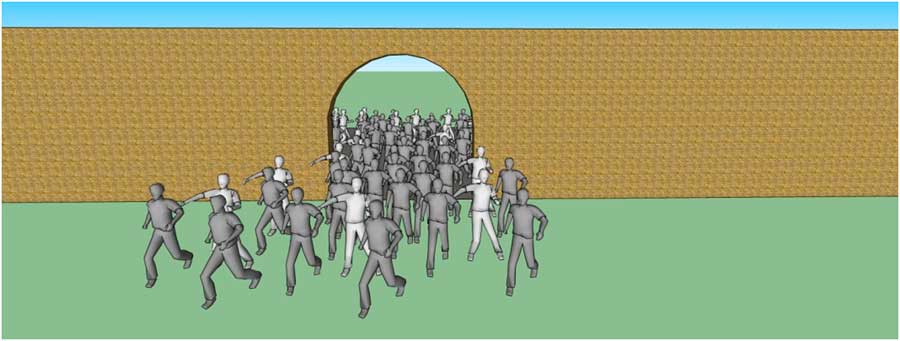
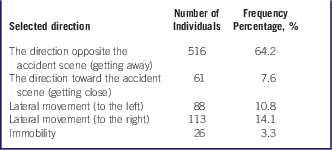
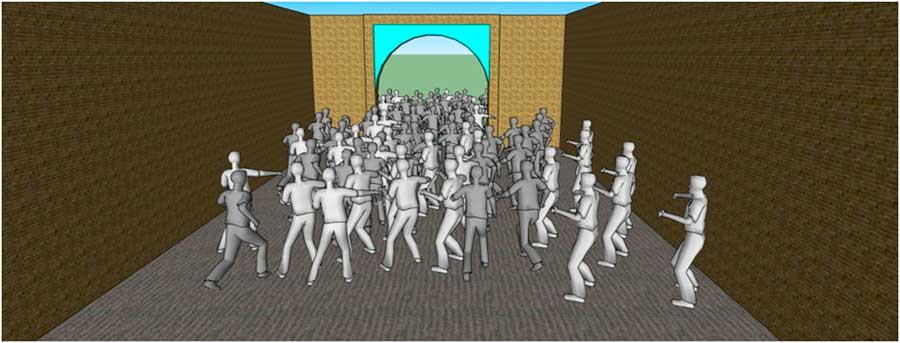
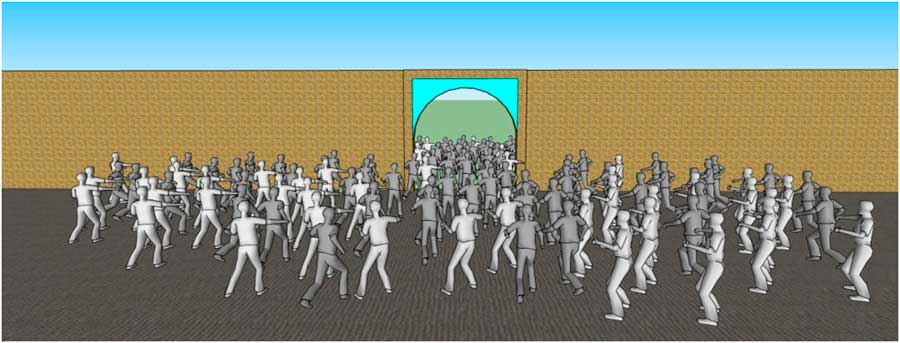
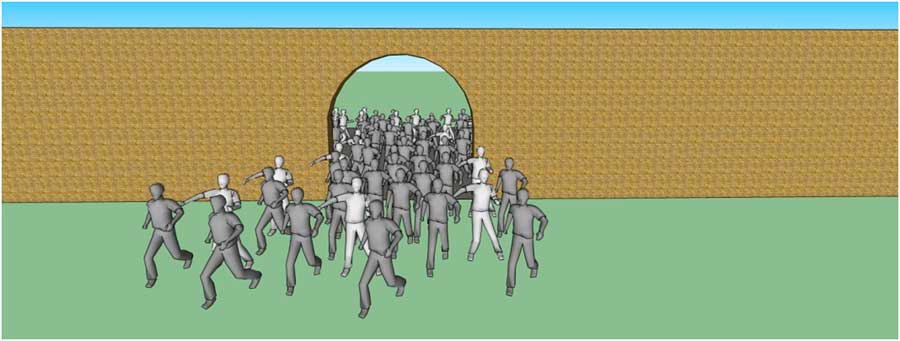
In this situation, as a result of par falling of the escaping people, interruption in the population flow toward the exit doors, lack of emergency exits, obstacles caused by hawkers on the main passageway, the roofed and encapsulated environment of the bazaar and the psychological effects resulting from it, the opposite population flow from the main entrances of the bazaar, smoke and the lack of horizontal vision caused by fire or explosion, and the altitude difference of the bazaar surface with some secondary routes (non-par falling) will lead to sudden population density at the bazaar’s entries and exits and secondary routes (Figure 4). The dominant density pattern will be the identical movement pattern with positive pressure (Figures 5 and 6). The frequencies of the selected directions in which people would move to get out of threatening situations in Kerman bazaar are shown in Table 7.
Simulation of Overcrowding at the Main Exit (Eastern) of Kerman Bazaar After an Accident.
Simulation of Overcrowding at Site Number 1 of the Secondary Exit of Kerman Bazaar After an Accident.
Simulation of Overcrowding at Site Number 2 of the Secondary Exit of Kerman Bazaar After an Accident.
Selected Direction of Kerman Bazaar Population in Emergency Situations

DISCUSSION
Our findings show that the population critical density point in Kerman bazaar would be 6112 people. In the case of an accident, the critical density in Kerman bazaar will be created in about 1 minute 10 seconds after the event. Jordao et alReference Jordao, Charalambous, Christie, Pettr, Jordao and Charalambous 16 estimated the critical gathering point around Wall Street in New York City at about 5000 people, which is consistent with the present study given the extent and area of the passages in comparison to the Kerman bazaar. Shendarkar et alReference Shendarkar, Vasudevan, Lee and Son 17 simulated crowd evacuation in Washington, DC, by using the BDI (belief, desire, intention) model. In that study, the critical crowd in the National Mall subway station in a terrorist explosion scenario was about 4000 people, which differs from the results of the present study of 6112 people. Time needed to reach the critical density point and evacuation process from the subway station in the Shendarkar et al study was about 40 s, whereas in the present study it was about 1.10 s.Reference Shendarkar, Vasudevan, Lee and Son 17 According to this study, the increase in population density in order to reach the critical point in Kerman bazaar was estimated to be 20% in the maximum time of 70 s post-event, which is inconsistent with the study conducted by Pellegrini et al,Reference Pellegrini, Gall, Sigal and Gool 18 who reported this value to be 50% in an enclosed virtual space and in the time interval of 3.5 minutes. HelbingReference Helbing 19 estimated the critical density at London’s Wembley Stadium as 65,302 people in 1.45 minutes post-event, which is consistent with the present study regarding the formation of the critical density. Yu and JohanssonReference Yu and Johansson 20 calculated the population flow rate at the maximum density point as 2 and the critical density point with maximum social pressure as 8.8 by using the social power model and the formula mi× dvi(t)/dt=fi(t). Jablonski and ArgyriouReference Jablonski and Argyriou 21 simulated the crowds in the street area in London using the method used in this research and by collecting information about passersby. The results of that study are fully consistent with those of the present study in the Kerman bazaar in terms of population density and the area of the study.Reference Jablonski and Argyriou 21 Other studies have merely used simulator software to determine critical density point and crowd simulation. Also, studies about the social psychology of populations used only psychological factors in society. In the present study, however, we used a combination of psychological and personal factors in emergency situations based on the people’s self-expression and by using a questionnaire to determine movement direction (Table 7) and more accurate software that may be noteworthy to other researchers in this area.
CONCLUSION
The present study used accepted methods related to population behavior and crowds in determining the critical gathering point and simulating the population; hence, the study provides a proper method for investigating and simulating population density in enclosed environments by applying information related to the behavior of simulated agents (pedestrians) as well as a bazaar-based approach to the spatial features of Kerman bazaar. The results of this study indicate that the crowd in Kerman bazaar has greater vulnerability in the field of relief aid in emergency situations owing to the bazaar’s location and lack of necessary provisions. Regarding estimation of the critical gathering point and stimulation of the crowd in this study, it seems necessary to identify and provide necessary solutions for reducing the risk of disasters caused by overcrowding in Kerman bazaar. It is suggested that researchers conduct studies to design safe and secure emergency evacuation of Kerman bazaar as well as proper planning for better and faster access of aid squads to potential victims at this location.