I. INTRODUCTION
Direct blue dye (DBD) is a popular colorant used in textile and other industries. Reference Mester and Tien1,Reference Saratale, Saratale, Chang and Govindwar2 However, it is known to be a toxic water pollutant, which is an alarming threat to the natural water resources. Reference Agrawal and Tratnyek3–Reference Zhang5 Transition metals including Fe and noble metals have been used to degrade and detoxify different organic water pollutants, including DBD. Reference Cao, Wei, Huang, Wang and Han6,Reference Yoshida, Ogata, Nakamatsu, Shimamune, Kikawa, Inoue and Iwakura7
Zero-valent transition metals, such as Fe, are specifically attractive in this regard owing to their excellent catalytic properties toward dissociating different organic chemicals, Reference Cao, Wei, Huang, Wang and Han6,Reference Nam and Tratnyek8–Reference Choe, Chang, Hwang and Khim11 low cost, and abundance. However, pure Fe needs rigorous processing to perform efficiently in catalytic decomposition reactions under ambient conditions. Furthermore, the poor durability and toxic reaction by-products (e.g., rust, Fe2O3·nH2O) restrict the use of pure Fe for the dissociation of organic chemicals in an aqueous medium. Reference Cao, Wei, Huang, Wang and Han6 Although noble metals exhibit excellent catalytic activity, their high cost limits their application as water purifier. Reference Yoshida, Ogata, Nakamatsu, Shimamune, Kikawa, Inoue and Iwakura7 Thus, there is a critical need for finding efficient, low cost, and durable catalyst, to detoxify water and remove harmful organic chemicals.
Metallic glasses are metastable amorphous multicomponent alloys Reference Schroers12,Reference Greer13 that have attracted lot of interest recently owing to their high catalytic activity, excellent chemical inertness, and durability. Reference Carmo, Sekol, Ding, Kumar, Schroers and Taylor14,Reference Sekol, Kumar, Carmo, Gittleson, Hardesty-Dyck, Mukherjee, Schroers and Taylor15 Due to the amorphous structure, the catalytically active components in the alloy are uniformly dispersed in a chemically homogeneous environment. Hence diffusion limitations, often a problem in traditional heterogeneous catalysts, do not affect the surface reactions in amorphous materials. Phase formation in crystalline alloys is dictated by phase diagrams and thermodynamic constraints. In contrast, the uniform and random distribution of atoms in MGs allows continuous control of their electronic and catalytic properties. Recently, Fe-based MG alloys have been reported to be catalytically active toward the degradation of organic chemicals including azo dye. Reference Wang, Liu, Chen, Xie, Louzguine-Luzgin, Inoue and Perepezko16–Reference Zhang, Zhu, Zhang and Hu19 The higher catalytic activity of the zero-valent amorphous alloys compared to their corresponding crystalline counterpart is attributed to their lower activation energy for electron transfer. However, these reports have not addressed the following specific issues: (i) mechanism for dye dissociation, (ii) factors affecting the catalytic activity such as size and morphology of the catalyst, and (iii) the influence of crystalline versus amorphous structure on the charge transfer process during dye dissociation. Catalytic processes are surface activated, where the rate of chemical reaction is proportional to the rate of electron transfer. Therefore, one strategy to enhance the catalytic activity of the FeMG particles is to substantially increase its reaction surface area and activate its surface to promote rapid charge transfer. Reference Özkar20
In this work, we report on significant enhancement in catalytic activity of FeMG particles for rapid degradation of DBD at room temperature. High speed mechanical milling was performed to increase the surface area by reducing particle size to submicrometer level (200–800 nm). This results in improvement of contact area for charge transfer during the chemical reaction. In addition, surface imperfections resulting from high-energy mechanical milling act as catalytically active charge transfer sites for dye degradation. Since there is no bottom-up process for synthesizing complex multicomponent MGs, mechanical milling serves as a valuable approach to tune the size and surface defect density in these novel catalytic materials. Finally, we investigated the mechanism for the DBD degradation reaction using Raman spectroscopy and infrared (IR) spectroscopy. We found that it proceeds primarily by breaking off the –C–H–, –C–N–, and –N=N– bonds of the dye molecules.
II. EXPERIMENTAL
Iron (Fe) based MG powder of composition Fe48Cr15Mo14Y2C15B6 was synthesized by arc melting the constituent pure elements followed by gas atomization. The particle size was found to be in the range of 1–10 µm [Figure S4(a), Supporting Information].
A. Differential scanning calorimetry (DSC)
The glass transition temperature (T g) and the crystallization temperature (T x) for the FeMG powder were measured using a DSC (NETZSCH STA 449 F3, Germany). About 5 mg of the sample was placed in an alumina crucible and was heated from 473 to 973 K in inert (Ar) atmosphere. The rate of heating was kept at 20 K/min during this calorimetric measurement.
B. Activation of the FeMG amorphous alloy by mechanical milling
FeMG microparticles were activated using high speed mechanical milling in a liquid medium (methanol) inside a high purity Zirconia jar with alumina balls. The rotation speed during milling was kept at 500 RPM and the milling was performed for different times (6, 9, 12, and 20 h).
C. X-ray diffraction (XRD)
The phase formed in gas atomized and activated particles was identified using an x-ray diffractometer (Rigaku Ultima) with the samples exposed to Cu Kα radiation of wave length of 1.54 Å. For XRD measurement, all the samples were placed on the clay, which was mounted on a glass slide.
D. Scanning electron microscopy (SEM)
The microstructure of the FeMG particles was observed using SEM (Quanta 200, FEI, Hillsboro, OR). All the micrographs were captured at a voltage of 15 kV with a working distance of ∼5 mm. The powdery samples were dispersed in a liquid medium followed by drop casting onto a Si substrate prior to SEM observation.
E. Transmission electron microscopy (TEM)
FEI Technai F20 field emission TEM was used for structural characterization of submicrometer MG particles. The TEM samples were prepared by dispersing the powder samples in a liquid medium followed by drop casting on to a 200 mesh TEM grid (SPI Supplies, West Chester, PA).
F. DBD degradation tests
Commercially available DBD was purchased from Sigma-Aldrich and 0.015 molar dye solution was prepared after mixing the equivalent amount of powder with deionized water. The FeMG microparticles and activated FeMG particles were dispersed in the dye solution followed by sonication for 5–7 min. The absorption spectra of the solution were measured using UV–visible spectroscopy. The instrument was calibrated and the measurement baseline was corrected using deionized water before each measurement.
G. Raman and IR spectroscopy
After the reaction, all the metal particles were extracted from solution and dried overnight under ambient atmospheric conditions for further characterization in Raman and IR spectroscopy.
1. Raman spectroscopy
Raman spectroscopy was carried out for all the samples at room temperature from the frequency range 0–4500. The Raman spectrometer (Enwave optronics Inc., Pro Raman-L) is inbuilt with a green argon (Ar) laser with a wave length of 532 nm.
2. IR spectroscopy
IR spectroscopy was obtained using an IR spectrophotometer (PerkinElmer Spectrum FT-IR Spectrophotometer) equipped with both transmission and attenuated total reflectance (ATR) modes. The IR spectrometer was used for data collection over a wave number range of 370–7800 cm−1 using a fast recovery deuterated triglycine sulfate detector with KBr splitting. All the data collected using an IR spectrophotometer were quantitatively analyzed by using Spectrum One software.
III. RESULTS AND DISCUSSION
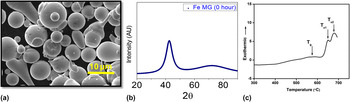
The gas atomized MG particles (size range of 1–10 µm) were activated using high speed mechanical milling for different times (6, 9, 12, and 20 h) to reduce the particle size and increase the catalytic activity. Figures 1(a)–1(c) show the SEM, XRD, and DSC plot for the gas atomized FeMG particles. Figure 1(a) illustrates the morphology of gas atomized FeMG particles, which are spherical, smooth, and in the size range of 1–10 µm [Figure S4(a), Supporting Information]. The XRD of gas atomized FeMG particles (i.e., FeMG 0 h milled) shows a broad hump without any crystalline peaks, depicting the fully amorphous nature of the particles [Fig. 1(b)].
(a) Scanning electron micrograph of gas atomized FeMG particles; (b) XRD plot of gas atomized FeMG particles showing fully amorphous structure; (c) DSC of those gas atomized FeMG particles with distinct glass transition and crystallization temperatures.

DSC of gas atomized powder was done at a heating rate of 20 K/min. DSC analysis of the powder is shown in Fig. 1(c). The MG powder has a glass transition temperature (T g) of 575 °C, primary crystallization temperature (T x1) of 653 °C, and secondary crystallization temperature (T x2) of 684 °C. A wide supercooled region of ΔT (= T x − T g) ∼78 °C indicates good glass-forming ability of this alloy.
Figure S1 (Supporting Information) shows that even after mechanical activation of 6 and 9 h for FeMG particles, no crystallization peaks are observed in XRD, except a single broad hump. However, with the increase of milling time to 12 h, a large number of crystalline peaks appear in the XRD, which further increase after 20 h as shown in Figure S1 (Supporting Information). The crystalline phases identified for 12 and 20 h are marked alongside the peaks in Figure S1 (Supporting Information).
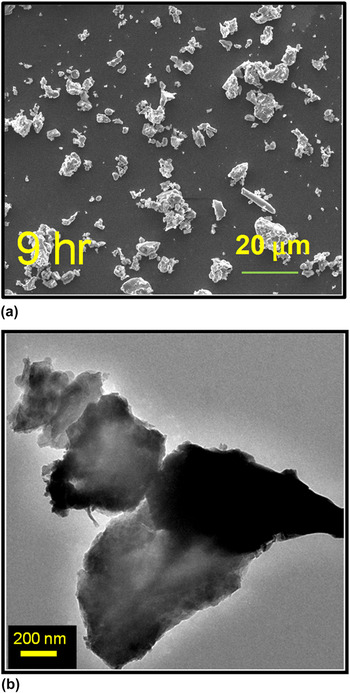
Figures 2(a) and 2(b) show the SEM and TEM images of 9 h activated particles, respectively. Even though the particle size for 9 h activated samples varies over a wide range, majority of the particles are in the size range of 200–800 nm [Figure S4(b), Supporting Information]. It is clearly seen from Figs. 2(a) and 2(b) that the 9 h activated FeMG particles do not exhibit spherical morphology, but are in the form of flakes with multifaceted sharp edges. With a further increase in milling time to 12 and 20 h, there was no significant change in the morphology or particle size [Figure S2, Supporting Information]. The morphology of a few isolated single particles of the 9 h milled FeMG sample was further investigated using TEM. It is clearly seen from Fig. 2(b) and Figs. S3(a) and (b) that the 9 h mechanically activated FeMG particles exhibit corrugated surfaces with sharp edges. These corrugated surfaces result from the high energy impact between particles during the activation process by mechanical milling. The surface defect sites in metals have high free energy and typically show high catalytic activity. Reference Lang and Kohn21,Reference Rodriguez de la Fuente, Gonzalez-Barrio, Navarro, Pabon, Palacio and Mascaraque22 Therefore, these corrugated surfaces are likely to act as catalytically active sites for charge transfer. Reference Lang and Kohn21–Reference Hammer, Nørskov, Bruce and Gates23 Iron is a transition metal, which can exhibit different oxidation states (e.g., Fe2+ and Fe3+), thus capable of accelerating redox reaction by donating electrons to the reactants. This electron transfer process likely plays a key role in the redox reaction to decompose the DBD. Highly corrugated surfaces of materials exhibit lower activation energy and facilitate faster electron transfer from the catalyst surface to the reactant. For 9 h milled particles, we believe that the particle size and surface activated catalytic sites are optimized such a way that generates a synergistic catalytic effect toward electron transfer during redox reactions with DBD solution.
(a) Scanning electron micrograph showing the morphologies of 9 h milled particles, (b) transmission electron micrograph of 9 h milled FeMG particles showing sharp edges and defects, which likely act as catalytically active sites.

DBD degradation tests were performed in a UV–visible spectrometer at room temperature and the absorption peaks of the dye solution were characterized before and after reaction with different FeMG samples. Sonication was carried out during each experiment to disperse the particles in the solution to establish a homogeneous reaction of the dye. The dark blue appearance of the starting 0.015 (M) DBD solution is shown in Figure S5 (Supporting Information). After the reaction of DBD solution with various (nonactivated/activated) FeMG powders, the absorption peak intensity diminishes with time as the dye molecules are continuously degraded.
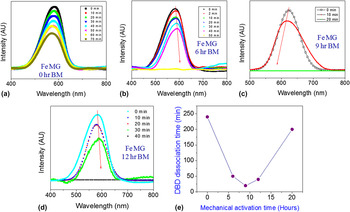
To obtain the rate of reaction, we performed systematic measurement of the absorption spectrum till the solution was reduced to 0% absorption. The intensity versus wave length plots for each sample is shown in Figs. 3(a)–3(d). The effect of dye dissociation of pristine FeMG particles is shown in Fig. 3(a), which illustrates that even after 70 min the DBD degradation reaction was not complete. However, the absorption peak of the dye solution was found to be 0% (i.e., completely transparent) for 6, 9, and 12 h milled particles within 50, 20, and 40 min, respectively [as shown in Figs. 3(b)–3(d), respectively]. Figure 3(e) illustrates the DBD degradation time versus an activation time plot demonstrating the cumulative performance for each type of FeMG catalyst particles. We also performed the same experiment using pure Fe crystalline particles, which took almost 60 min to dissociate the DBD. Although Fe particles completely degraded the DBD, it produced a residue from the reaction with water indicating its poor corrosion resistance compared to FeMG [Fig. 4(a) and Figure S6, Supporting Information].
UV–visible spectroscopy showing the absorption peak for the DBD solution with time for (a) gas atomized FeMG, (b) 6 h FeMG particles, (c) 9 h FeMG particles, (d) 12 h FeMG particles, and (e) comparative plot showing the DBD degradation time versus milling times of the particles.

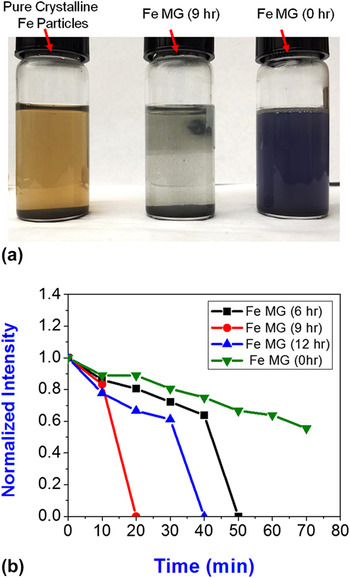
(a) DBD solution treated with (from the left to right) pure crystalline Fe particles, 9 h mechanically activated FeMG particles, and gas atomized FeMG particles; (b) normalized intensity versus time plot illustrates the fastest DBD degradation occurs in the 9 h activated sample compared to the other FeMG samples.

The appearance of DBD solutions after reaction with different particles is shown in Fig. 4(a). From Fig. 4(a), it is clearly seen that the 9 h milled FeMG particle (middle one) produces a clear solution much sooner compared to the gas atomized FeMG particles. On the other hand, pure Fe microparticles left a brownish solution of organic residues as reported earlier. Reference Cao, Wei, Huang, Wang and Han6 We also found that the furnace crystallized MG powder showed no catalytic activities at all, indicating that the intermetallic phases formed after crystallization are inherently inactive.
Figure 4(b) shows the normalized intensity of absorption spectra versus reaction time with different catalyst particles. The slope of the curve indicates the degradation rate of DBD solution. From Fig. 4(b), it can be seen that the activated FeMG particles exhibit faster DBD degradation reaction compared to the gas atomized one. Among the different activated FeMG particles, we found that the 9 h milled sample shows the fastest dye degradation rate compared to other samples. Gas atomized FeMG particles took a total of 250 min for complete dye degradation. Similarly, 20 h milled FeMG particles also took around 200 min to finish off the dye degradation reaction.
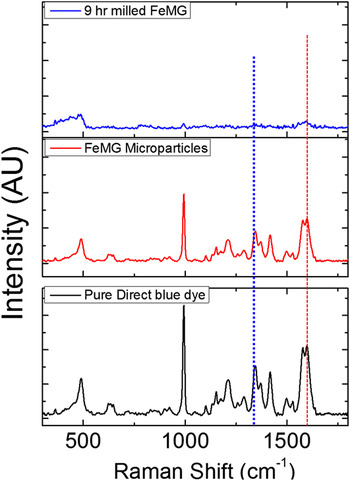
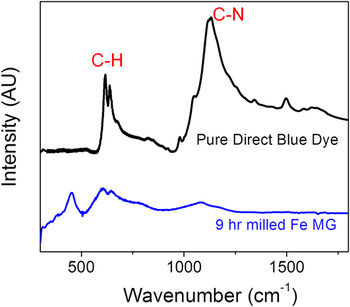
As discussed in the previous section, we believe that the rate of dye degradation for the activated particles is faster compared to the gas atomized pristine FeMG particles owing to their large surface area and sharp increase in the number of catalytically active sites, which helps in rapid electron transfer during the redox reaction. More specifically, high energy milling not only reduced the particle size (i.e., increases the surface area), but also created the surface activated catalytic sites at the edges of the particles [Figures S3(a) and S3(b), Supporting Information]. We believe that catalysis for the MG proceeds by a surface mediated redox (oxidation–reduction) reaction in contrast to direct oxidation of pure iron to form a corrosion product. Reference Weber24,Reference Matheson and Tratnyek25 The transfer of electrons to the unsaturated bonds results in dissociation of the organic compounds. Reference Agrawal and Tratnyek3,Reference Cao, Wei, Huang, Wang and Han6 In this work, we found that 9 h milled FeMG particles show faster dye degradation owing to their larger surface area, highly activated surface with large number of catalytic edges, and amorphous structure. The size of the gas atomized FeMG particles was 1–10 µm, which was reduced to 200–800 nm after 9 h high energy mechanical milling. It should be noted that the reduction in particle size creates a larger surface area for the same amount of powder, which increases the rate of DBD degradation reaction. In addition, the milling induces catalytically active defect sites on the particle surface, which further help in promoting charge transfer during the catalytic reaction. Reference Xia, Xiong, Lim and Skrabalak26–Reference Ma, Kuang, Jiang, Xie, Huang and Zheng28 Consequently, the 6 and 9 h milled particles show faster dye degradation compared to the gas atomized particles. However, the degradation time increases to 40 min for 12 h milling samples. The reason behind this drastic change may be formation of crystalline phases (like Mo12Fe22C10, Mo2B, Mo2B4, and Fe3C), due to prolonged mechanical milling of the amorphous particles [Figure S1 (Supporting Information)]. These nonactive crystalline phases likely reduce the activity of the particles. With further increase of mechanical milling to 20 h, large number of crystalline phases form as demonstrated in the XRD data in Figure S1 (Supporting Information). Due to the larger fraction of crystalline phases, it takes longer for complete DBD degradation (∼200 min). Consequently, the synergistic catalytic effects of the activated FeMG particles are proportional to their active surface sites, while retaining their amorphous structure. To understand the mechanism of DBD degradation, we performed Raman spectroscopy and IR spectroscopy as shown in Figs. 5 and 6, respectively. We separated the powders and solution after reaction and dried overnight. This was followed by the collection of Raman spectra to verify the mechanism of DBD dissociation after the redox reaction. Figure S6 (Supporting Information) shows the comparative before and after images for pure Fe particles [Figure S6(a) and S6(c)] and gas atomized FeMG particles [Figure S6(b) and S6(d)] after the reaction with DBD solution.
Comparative Raman spectrum of all the post reaction extracted samples demonstrating complete dissociation of DBD by 9 h milled FeMG particles.

IR spectrum illustrates the complete breaking of C–H and C–N bonds of DBD after reaction with 9 h activated FeMG particles.

The change in the color of Fe microparticles from black to yellow [Figure S6 (a) and (c), Supporting Information] is clearly seen and this is most likely due to the formation of harmful by-products of iron oxides/hydroxides as reported earlier. Reference Cao, Wei, Huang, Wang and Han6,Reference Abazari, Heshmatpour and Balalaie29 In contrast, there was no color change observed for FeMG particles after reaction with DBD molecules [Figure S6 (b) and (d), Supporting Information]. The extracted dried particles after the reaction were further used for the investigation of Raman and IR spectroscopy to observe the difference in stretching bond vibrations of the DBD molecules. We observed a clear distinction of dye molecules before and after reaction, and these are illustrated in Figs. 5 and 6.
Figure 5 shows the characteristic Raman peaks of different –N=N–, –C–N–, and –C–H– stretching mode of DBD. It is clearly seen from Fig. 5 that activated FeMG particles dissociated the DBD completely, whereas gas atomized FeMG did not. Similarly, comparative IR spectroscopy is shown in Fig. 6 illustrating the complete dissociation of –C–N– bonds and partial breaking of –C–H– bonds of DBD using catalysis redox reaction with FeMG particles. We believe that the dissociation of –C–N–, –C–H–, and –N=N– bonds via surface mediated redox reactions causes the color change in the DBD after reaction. Breaking of these bonds transforms the dark blue dye solution into a transparent one after reaction. In light of the Raman and IR spectroscopy results, the dye dissociation mechanism is shown in Figure S7 (Supporting Information).
IV. CONCLUSIONS
We investigated the synergistic catalytic effect of FeMG particles for room temperature dissociation of DBD, a toxic water pollutant and health hazard. In addition, we successfully demonstrated the effect of high-energy mechanical milling on improvement of catalytic activity of the MG particles. XRD was used to identify the different phases formed, whereas SEM and TEM studies were performed to evaluate the size distribution and morphology. The 9 h milled particles were found to dissociate DBD within the shortest time of 20 min at room temperature. The FeMG particles were found to be corrosion resistant, without any harmful by-products during the catalytic reaction in aqueous solution. The catalysis mechanism of the FeMG particles was studied using Raman and IR spectroscopy. Breaking of –C–H–, –C–N–, and –N=N– bonds of DBD molecules was found to be primarily responsible for the dye degradation reaction. The catalytic reaction proportionally increases with increasing amounts of activated edge-plane like sites in the particles. The synergistic catalytic effect of mechanically activated particles likely originates from the increase in surface area as well as the number of active sites in the FeMG particles, while retaining its amorphous structure. This study sets the stage for efficient room temperature degradation of hazardous organic pollutants using MGs.
Supplementary Material
To view supplementary material for this article, please visit http://dx.doi.org/jmr.2015.090.
ACKNOWLEDGMENT
The authors gratefully acknowledge the Center for Advanced Research & Technology (CART) at the University of North Texas (UNT).