INTRODUCTION
Minimum tillage (MT) systems of seedbed preparation for crops, without soil inversion by mouldboard plough, are widely used throughout the world (Cannell Reference Cannell1985; Allmaras & Dowdy Reference Allmaras and Dowdy1985; FAO 2001; Hobbs Reference Hobbs2007) and continue to increase (Basch Reference Basch2009). The main benefits of the system include control of soil erosion (Woodruff & Siddoway Reference Woodruff and Siddoway1965; Wischmeier & Smith Reference Wischmeier and Smith1978; Mannering & Fenster Reference Mannering and Fenster1983), reduced production costs with yields at least as good as conventional tillage (CT; Allmaras & Dowdy Reference Allmaras and Dowdy1985), reductions in fuel use, machinery costs and working time (Davies Reference Davies, Baumer and Ehlers1989; Rasmussen Reference Rasmussen, Baumer and Ehlers1989; Bonari et al. Reference Bonari, Mazzoncini and Peruzzi1995; Sijtsma et al. Reference Sijtsma, Campbell, McLaughlin and Carter1998), the sequestration of carbon in the soil as organic matter (Balesdent et al. Reference Balesdent, Chenu and Balabane2000; Vinten et al. Reference Vinten, Ball, O'SullivanO'Sullivan and Henshall2002) and improvements in soil biota (Holland Reference Holland2004; Rothwell et al. Reference Rothwell, Chaney, Haydock, Cole and Schmidt2005). The main disadvantages of the MT system are considered to be an increase in the abundance and activity of all species of slugs (Voss et al. Reference Voss, Ulber and Hoppe1998; Andersen Reference Andersen1999) as well as increased weed infestations, particularly grass weeds such as sterile brome (Anisantha sterilis L.) (Lintell Smith et al. Reference Lintell Smith, Freckleton, Firbank and Watkinson1999; Davies & Finney Reference Davies and Finney2002; Torresen et al. Reference Torresen, Skuterud, Tandsaether and Hagemo2003; Kreye Reference Kreye2004; Bond et al. Reference Bond, Davies and Turner2005). The current interest in reduced/minimum tillage throughout Europe is part of a wider response to smaller financial returns (Davies & Finney Reference Davies and Finney2002) and this, together with high work rates and lower costs (Fortune et al. Reference Fortune, Kennedy, Mitchell, Dunne, Murphy, Connery and Grace2005), is among the reasons for the adoption of the system by Irish cereal growers. MT crops need to be sown and established in good soil conditions; therefore their sowing date needs to be much earlier than for crops sown by CT methods. This earlier sowing raises major concerns regarding the vulnerability of MT crops to the serious, yield-reducing, barley yellow dwarf virus (BYDV) disease, which is one of the most widespread and destructive virus diseases of small grain cereals worldwide that is obligately transmitted by aphids (Rochow Reference Rochow1960; Plumb Reference Plumb, Plumb and Thresh1983; Henry et al. Reference Henry, George, Arnold, Dedryver, Kendall, Robert and Smith1993; Power & Gray Reference Power, Gray, D'Arcy and Burnett1995). Major yield reductions in autumn-sown cereals due to BYDV have been recorded in Britain and France (Plumb Reference Plumb1977; Barrett et al. Reference Barrett, Northwood and Horellou1981; Kendall & Smith Reference Kendall and Smith1981), while in Ireland reductions of up to 3·4 t/ha have been recorded in autumn-sown barley (Kennedy & Connery Reference Kennedy and Connery2001). The latter investigations have shown that aphid abundance, virus incidence and yield reductions are greatest in early-sown crops (before mid-September) and decline with lateness of sowing over the following 2 months. While Kendall et al. (Reference Kendall, Chinn, Glenn, Wiltshire, Winstone, Tidboald, Glenn, Greaves and Anderson1995) noted BYDV infection was nearly always more prevalent after ploughing than after non-inversion tillage or direct drilling, there is an absence of empirical data and advice for growers on the threat posed to MT cereals by BYDV. The objective of the present investigation was to test the hypothesis that BYDV disease and its aphid vector abundance are similar in MT and CT autumn-sown cereals. Confirmation of the hypothesis would indicate that MT crops, because they are sown earlier than CT crops, are at greater risk of yield loss due to BYDV. It was also hypothesized that aphid numbers on wheat heads would be similar on crops grown by each method of cultivation. Since many MT practitioners dispose of the straw by chopping and spreading during harvesting, a secondary objective of the study was to determine the impact of this practice on aphid and virus occurrence in the subsequent cereal crop.
MATERIALS AND METHODS
Experimental design
A split-plot experimental design was used. MT and CT plots, 24×36 m2 (main plots), were sown with winter barley at the same location from 2001 to 2003 and with winter wheat from 2004 to 2006. Plots of each system of cultivation were randomized within each of four adjacent blocks. Plots were split so that a randomly selected half (12×36 m2), received a treatment of chopped straw (detailed later). The effects of method of cultivation and soil incorporation of straw on autumn aphid infestation and incidence of BYDV in spring were measured.
Soil
The trial site soil type is described as Baggotstown–Carlow Complex. This is a moderately deep, free-draining Brown Earth derived from limestone gravels with sandy loam texture and low moisture-holding capacity, being prone to drought in dry periods (Conry & Ryan Reference Conry and Ryan1967). The preceding crops on the site were three spring barleys, prior to which was winter barley that was preceded by a grass ley.
Straw
Straw from elsewhere on the farm was weighed, spread and chopped in situ by means of a precision-chop forage harvester on 23 August 2001. The combine harvester used in subsequent years had an integrated straw chopper and spreader. This enabled straw from the preceding crop to be applied to those plots selected for straw incorporation and also determined the mass of straw applied. Straw was chopped to less than 100 mm in length. The weight of straw applied was estimated based on weighing both straw and grain from other experimental plots over a number of seasons. In the case of winter barley and winter wheat, the yields of straw for both were half those of grain yields, respectively. The weight of straw applied in 2001 was 4·3 t/ha. MT plots received an estimated 3·6 and 1·6 t/ha in 2002 and 2003, respectively, while CT plots received 3·2 and 1·3 t/ha. The estimated weight of straw was based on the measured grain yield from these plots in the preceding season and on the straw:grain ratio outlined above. The wheat crops from 2005–07 received straw amounts of 1·8, 2·7 and 4·4 t/ha, respectively, for CT plots, whereas the MT plots received 1·3, 2·9 and 4·5 t/ha.
Cultivations
MT comprised two passes with a shallow tine cultivator without soil inversion within 1 week of harvesting the preceding crop. A trailed Horsch FG 7·5 m cultivator with wide sweep shares was used in 2001. Subsequently, a similar type mounted Horsch Terrano 3 FX 3 m cultivator was used. Cultivation depth was c. 75 mm. Cultivation was followed by rolling (one pass) with a Cambridge-type roller (Vaderstad Rollex 620, 2500 kg and 6·2 m). CT comprised ploughing, 200–250 mm deep, with a Kverneland ES 80 four-furrow reversible plough. Soil was cultivated (one pass) with a rotary-powered harrow and crumbler roller (Lely Roterra 2·5 m) immediately prior to sowing. Cultivation depth was 100–120 mm. Plots were sown with a trailed Vaderstad Rapid 300 S disc cultivator drill, 3 m wide with a drill spacing of 125 mm. Sowing depth was 40 mm.
Husbandry
The herbicide glyphosate (120 g/l) (Sting) was applied at 4 litres/ha to vegetation in the days prior to cultivation. Barley was sown on 12 September 2001 and 10 September 2002 and 2003. The cultivar Regina was sown in 2001 and 2002 but was not available in 2003; it was replaced by Pearl. Wheat was sown on 17 September 2004, 6 September 2005 and 15 September 2006. The cultivar Claire was used in 2004 and 2005 but was unobtainable in 2006, when it was replaced by Einstein. The two barley and two wheat cultivars were considered not to differ, within species, either in their impact on aphid infestation or subsequent virus infection. This was based on an unpublished work (Kennedy & Connery, personal communication) that showed that, unlike the cultivars used in the present experiment, only those cultivars that differed in their vegetative growth habit differed in aphid infestation levels and virus incidence. The fertilizers applied to barley were: 37 kg phosphorus/ha+74 kg potassium/ha (0:10:20, N:P:K) during the first week in November at growth stage (GS) 24–25 (Tottman et al. Reference Tottman, Makepeace and Broad1979). Nitrogen (0·275 calcium ammonium nitrate (CAN)) was applied in three splits comprising 70 kg in the first week in March, GS 25–29, and a similar amount in the first week in April, GS 30–31, followed by 30 kg during the last week in April, GS 37–39. Winter wheat received 17 kg phosphorus/ha+74 kg potassium/ha (0:7:30, N:P:K) in early November, GS 22–24. Nitrogen (0·275 CAN) was applied in two splits of 85 kg during the fourth week in March, GS 30–31, and a similar amount in the third week in April, GS 31–32. The herbicide diflufenican (100 g/l)+isoproturon (500 g/l) (Cougar) was applied at 2 litres/ha to barley during the third week in October each season and to wheat during the second week in November. Isoproturon (236 g/l)+pendimethalin (236 g/l) (Trump), 5·5 litres/ha, was applied on 23 September 2003 for the control of grassweeds. Sulfosulfuron (80% w/w) (Monitor) was applied at 12·5 g/ha on 31 March and 11 May 2005 to wheat for grassweed control, while on 28 April 2006 and 27 April 2007 mesosulfuron-methyl (30 g/kg)+iodosulfuron-methyl-sodium (10 g/kg) (Pacifica), at 250 g/ha, was used for this purpose. The fungicides applied to barley were propiconazole (62·5 g/l)+cyprodinil (250 g/l) (Stereo), 2 litres/ha, during the second week in April followed by epoxiconazole (125 g/l)+kresoxim-methyl (125 g/l) (Allegro) applied at 1 litre/ha during the second week in May. The fungicides treatment of wheat comprised prothioconazole (250 g/l) (Proline), 0·8 litre/ha, together with chlorothalonil (500 g/l), 1 litre/ha, (Bravo 500) in the third week in April. Epoxiconazole (125 g/l) (Opus), 1 litre/ha, was applied in the third week in May and a tank mix of tebuconazole (250 g/l) (Folicur), 1 litre/ha, +azoxystrobin (250 g/l) (Amistar), 0·5 litre/ha, was applied in mid-June.
Aphid sampling and identification
Aphid sampling was carried out in the autumn using a vacuum insect net (D-vac; Dietrick Reference Dietrick1961), fitted with a 0·0929 m2 sampling cone. Samples consisted of 20 sub-samples per plot, taken at random, and each of 15 s duration. Repeat aphid sampling of winter barley, by a D-vac sampler, was undertaken in April. Aphids on wheat heads were recorded in early July by examining ten randomly selected heads, in situ, per plot. The keys of Stroyan (Reference Stroyan1952), Prior (Reference Prior1975) and Taylor et al. (Reference Taylor, Palmer, Dupuch, Cole, Taylor and Taylor1981) were used to identify aphids.
Plant and tiller density
Plant populations were recorded at GS 22–23 by counting plants within a quadrat (0·5 m2). Quadrat counts were made at two positions, c. 12 m from plots ends and 12 m apart on the longitudinal axis 3 m from the plot's edge. The wheat head density was recorded in a similar manner at GS 90.
Barley yellow dwarf virus
Cereal leaves (10–15) were collected for virus testing at five separate locations per plot at GS 41–43 to determine the strain of virus present. Sampling locations were at 6 m intervals on the same axis as that used to record plant density. Sap was extracted from 1 g of leaf sample and tested for MAV and a 50:50 mixture of PAV- and RPV-type viruses using TAS-ELISA (Neogen® Europe Ltd). Samples were considered positive when their spectrophotometer reading (405 nm) was 3-fold greater than the mean value of negative controls. The proportion of BYDV in each cereal plot was determined by counting tillers with and without symptoms in each of four quadrats per plot. Symptoms were recorded at GS 43–49 using quadrats of 0·25 m2 at equidistant positions on the longitudinal axis of plots.
Harvesting
Harvesting was by means of a modified Duetz-Fahr 3370 combine harvester (modifications by Trials Equipment Ltd, Essex, UK). A strip of 2·3×36 m2 was harvested in each plot when grain dry matter content reached 800 g/kg FW, and yields were recorded. Grain moisture was measured in a hot-air oven at 90°C for 16 h. Yields were adjusted to 850 g DM/kg FW for analysis.
Data analysis
Data were analysed using Analysis of Variance for Split-plot design (PROC MIXED) (Statistical Analysis Systems Institute SAS 9.1; SAS 2004). The model had terms for cultivation method, straw, cultivation method×straw, and incorporated block and block×cultivation method as random effects. Pre-specified hypotheses were tested at P⩽0·05. Subsequently, pair-wise comparisons were made and these were considered significant where Tukey–Kramer-adjusted P values were less than 0·05. Experimental outcomes such as aphid number and weight of straw differed markedly between years and consequently data analysis was confined to within-year measurements. Aphid numbers were log transformed and virus incidence was transformed to the arcsin of the square root of incidence before statistical analysis.
RESULTS
Aphids
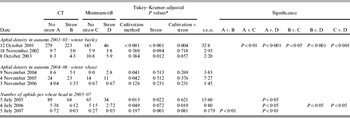
The method of cultivation (MT or CT) affected the number of aphids on barley and wheat plants in autumn and on wheat heads in summer. Differences in aphid numbers between the two methods of cultivation were significant during autumn for two of the six seasons in which crops were grown and on wheat heads in one of the three seasons in which wheat was grown. Aphids on winter barley in autumn 2001 reached a maximum density of 279/m2 (Table 1). In 2002 and 2003, the season maximum density was 11 aphids/m2. The maximum aphid density on winter wheat was 24 aphids/m2 recorded in 2005. Fewer than 10 aphids/m2 were found on wheat in 2004 and 2006. In 2001, a year when aphids were abundant, there were significantly (adjusted P=0·016) fewer aphids on MT barley relative to CT barley. This is contrary to the original hypothesis. There was also a significant interaction between method of cultivation and straw application on aphid density (P<0·004). The proportion of aphids on MT barley without straw, in autumn, was only 0·52 of that for CT plots. The low number of aphids in 2002 and 2003 precluded an effect of cultivation on these pests. Aphid numbers on winter wheat in autumn were relatively low; nevertheless, numbers differed significantly between the two methods of cultivation in two of the three seasons investigated. There were significantly fewer aphids on MT plots in 2004 (P=0·041) and 2005 (P=0·042) when compared with CT plots. Averaged over the six seasons, 0·76 of aphids on crops in autumn were wingless (range 0·5–1). These results are, again, contrary to the original hypothesis that cultivation method would not affect aphid numbers.
Aphid density (per m2) of winter barley (autumn 2001–03) and winter wheat (autumn 2004–06) and aphid infestation on wheat heads in early July 2005–07

* Analysis of log transformed data.
The mean autumn aphid species composition on winter barley in the three seasons showed that Rhopalosiphum padi comprised 0·63, Sitobion avenae 0·25, Metopolophium dirhodum 0·05 and unidentified 0·07. By late April the species composition was S. avenae 0·71, M. dirhodum 0·24, R. padi 0·04 and unidentified 0·01. The aphids on winter wheat in autumn 2004–06 were S. avenae 0·68, M. dirhodum 0·10, R. padi 0·09 and unidentified 0·13. Aphids (S. avenae) on wheat heads during early July were plentiful in 2005, less plentiful in 2006 and were scarce in 2007. The mean number per head on wheat grown in CT plots without straw incorporation was 89, 5·4 and 0·7, respectively, for the three seasons (Table 1). The effect of method of cultivation on the number of aphids per wheat head was significant only in 2005. MT wheat had significantly fewer aphids than CT wheat in 2005. The soil incorporation of straw during cultivations (combined methods) reduced the number of aphids on plants in autumn and on wheat heads in summer. Reductions were significant in the case of barley in 2003 and wheat heads in 2005 and 2007. MT plots treated with straw in 2003 had 32% fewer aphids (P<0·001) than CT plots to which straw was applied. Despite an interaction between cultivation and straw on aphid numbers, straw-treated plots had significantly fewer aphids within the MT method but not within the CT method. Wheat in plots of each cultivation method in which straw was incorporated had significantly fewer aphids, per head, relative to no-straw plots, in 2005 and 2007. In 2005, CT wheat plots with straw had 68 aphids/head, while those without straw had 89 aphids/head. In the case of MT plots, those with straw had 34 aphids/head and those without straw had 65 aphids/head. The comparable comparisons in 2007 were: 0·03 and 0·7 aphids/head (CT with and without straw, respectively) and 0·05 and 0·27 aphids/head (MT with and without straw, respectively). In 2006, MT with straw had significantly fewer aphids/head than those without straw (Table 1).
BYDV symptoms
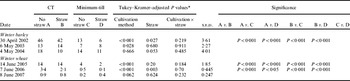
The incidence of BYDV was high in 2002, moderate in 2003, 2004 and 2005 and low in 2006 and 2007 (Table 2). The proportion of tillers exhibiting virus symptoms in CT plots without straw was 0·46, 0·13, 0·18, 0·13, 0·03 and 0·01 for the period 2002–07, respectively. Comparing the effect of method of cultivation on the incidence of BYDV disease showed a similar trend for each of the six seasons of the study, with the two methods differing significantly in four seasons. MT winter barley had significantly reduced incidence of disease when compared with CT barley in 2002 and 2003 (P<0·001 and P=0·028). In the case of winter wheat, virus incidence was lower each season in MT plots than CT plots, being significant in 2005 and 2006. This outcome differs from that hypothesized. Straw-treated barley plots had significantly reduced incidence of virus than non-straw plots in 2002. Overall, there was a lower incidence of virus in straw-treated wheat plots relative to those without straw but the difference was significant only in 2006 (Table 2). There was a positive relationship between virus incidence and aphid abundance for barley (r=0·88, n=12, P<0·001) but not for wheat.
Percent tillers having BYDV symptoms for winter barley in 2002–04 and winter wheat in 2005–07

* Analysis of arcsin transformed data [t11].
Virus strains
From the 480 leaf samples serologically examined for BYDV over the six seasons (5/plot/season), 326 tested positive for the MAV strain and only a single sample was positive for a mixture of PAV and RPV strains. There was no significant difference in the number of samples positive for the MAV strain between the two methods of cultivation or between straw and no-straw plots within either cultivation method.
Tiller and plant density
MT plots of winter barley had a marginally greater plant density in autumn for the three seasons when compared with CT plots. The plant density for MT plots in which straw was incorporated was lower than straw-treated CT plots in 2001, greater in 2002 and similar in 2003. Overall, there was no significant difference in tiller density for comparisons between cultivation methods either with or without straw. The barley head count in early July was marginally and non-significantly lower for MT relative to CT plots. Straw incorporation did not significantly affect head density. The plant density for winter wheat in autumn for the period 2004–07 did not differ significantly between MT and CT methods of cultivation. Plant density was significantly (P=0·023) lower where straw was incorporated compared with no-straw plots for only one of the three seasons (2006). The winter wheat head density, prior to harvest, was significantly lower for MT relative to the CT method in 2005. Minimum tillage straw-incorporated wheat plots had significantly fewer heads than CT plots in 2005 (P=0·005) and 2007 (P=0·006). In the absence of straw, there were significantly fewer wheat heads in MT plots when compared with CT plots in 2005 (P=0·007). There was a significant interaction between cultivation method and straw incorporation on head density in 2007.
An infestation of sterile brome (Anisantha sterilis L.) occurred in the MT barley in 2003. The infestation was more severe in 2004; MT plots (without straw) had 92·3 sterile brome tillers/m2 on 20 May 2004, while the CT plots did not have sterile brome. The infestation of this weed, recorded on 20 May 2005, showed the CT plots without straw were not infested, while the straw-treated plots had 2·3 tillers/m2. In the case of MT plots, those without straw had 20·1 tillers/m2 and those with straw had 60·2 tillers/m2. Estimates of the occurrence of this weed in 2006 and 2007 indicated a similar infestation as that of 2005.
Grain yields
Only in 2002 was there a significant difference (P=0·019) in barley grain yield between the two methods of cultivation, with the MT plots having 0·95 t/ha (16%) greater yield than CT plots. The impact of straw on barley grain yield in each of the three seasons was not significant. However, in 2002, minimum-till plots with straw had 0·8 t/ha (13%) greater yield than CT plots with straw and a significant (P=0·036) 1·24 t/ha (21%) greater yield than CT plots without straw. The grain yield of winter wheat did not differ significantly between the two methods of cultivation or between straw and no-straw plots in 2005 and 2006. In 2007, wheat grain yields for CT wheat plots without straw were 1·4 t/ha (23%) greater than that for MT plots without straw. The latter difference, however, was not significant because of a significant interaction between method of cultivation and straw incorporation on grain yield. Straw-treated CT plots yielded 8·32 t/ha, which was significantly (P=0·009) greater than the yield of 4·36 t/ha for straw-treated MT plots. MT plots without straw significantly (P=0·052) outyielded MT plots with straw by 1·8 t/ha. The relationship between head density and grain yield, in 2007, was r=0·987 (P=0·012).
DISCUSSION
Effect of cultivations on aphid numbers
The method of cultivation was found to affect the number of aphids on barley and wheat plants in autumn and on wheat heads in summer. These findings contradict the stated hypotheses, with the results for differences in aphid numbers on wheat heads in summer being particularly unexpected. The effect of method of cultivation on aphid abundance was greatest (and so most significant) in the season when these pests were plentiful. Overall, aphids in autumn were significantly fewer in MT relative to CT plots in three of the six seasons investigated. The absence of a cultivation effect on aphid numbers in the second and third seasons of winter barley was due to low aphid occurrence. Burton & Krenzer (Reference Burton and Krenzer1985) were among those who have previously recorded an effect of method of cultivation on aphid infestation of cereals; these workers found that the aphid Schizaphis graminium (R.) was less abundant in plots of winter wheat of reduced/conservation tillage with surface residues when compared with conventional till plots where residues were low. The findings of the present study on aphid number and tillage system support those of Kendall et al. (Reference Kendall, Chinn, Glenn, Wiltshire, Winstone, Tidboald, Glenn, Greaves and Anderson1995), who recorded fewer aphids on non-ploughed winter cereal plots relative to CT plots; these workers suggested that reduced aphid numbers in the less-cultivated plots could be a result of reduced visual cues to flying aphids in non-ploughed plots due to straw and stubble on the soil surface, and also to the higher numbers of polyphagous predators found in non-plough plots compared with CT plots. Polyphagous predators, including carabid and staphylinid beetles, spiders and earwigs, have been shown to feed on cereal aphids (Sunderland Reference Sunderland1975; Sunderland & Vickerman Reference Sunderland and Vickerman1980; Kennedy Reference Kennedy1990). Studies related to the present work found aphid DNA in 0·15 of carabids captured in plots between October 2004 and April 2005 (McDonald, personal communication), but the extent of predation on aphids in each system of cultivation was not measured. Other trials (McDonald Reference McDonald2007) found the number of winged aphids infesting conventionally tilled winter barley receiving 0, 1·9, 3·8 or 5·7 t/ha of chopped straw were significantly fewer during October on straw-treated plots, relative to those without straw. Additionally, the number of winged aphids decreased as the rate of straw applied increased. The latter supports the conclusion that differences found in the present work in aphid infestation levels between CT and MT cereal crops was mainly due to immigration of winged aphids, which in turn was influenced by differences in the visual cues between the two crops. Stubble trash associated with MT and straw on the soil surface are, therefore, less attractive to flying aphids than CT crops exhibiting green foliage against a darker soil background. In contrast, Sempruch et al. (Reference Sempruch, Starczewski and Tkaczuk2007) found greater densities of S. avenae and R. padi on triticale grown on reduced tillage system, in Poland, relative to CT. In the USA, Quisenberry et al. (Reference Quisenberry, Schrotzko, Lamb and Young2000) found tillage method had only limited impact on aphids in winter wheat and spring barley. Conflicting evidence has been reported in cotton crops on the impact of method of cultivation on the cotton aphid, Aphis gossypii (G.); Gencsoylu & Yalcin (Reference Gencsoylu and Yalcin2004) noted that this aphid was unaffected by the type of tillage system in Turkey, whereas in the USA, Marti & Olson (Reference Marti and Olson2007) recorded fewer aphids on plants in reduced tillage than under CT. In the case of spring wheat and barley in South Dakota, Hesler & Berg (Reference Hesler and Berg2003) found R. padi to be more abundant in plots with no pre-plant tillage than in plots receiving pre-plant tillage and attributed this to the fact that increased surface residues provided a favourable microclimate for this aphid, which is known to prefer to feed on the lower leaves and stems of cereals (Dean Reference Dean1973 b, Reference Dean1974; Plumb Reference Plumb, D'Arcy and Burnett1995; Gianoli Reference Gianoli2000; Qureshi & Michaud Reference Qureshi and Michaud2005).
The finding of significantly fewer aphids (S. avenae) on the heads of wheat grown in MT compared with CT plots during early July was unexpected. Aphid abundance on heads in the various treatments was broadly similar to that on plants in the preceding November. This may indicate that aphid infestations on wheat heads in June/July are determined, to some extent, by the infestation level the previous autumn. It is unlikely that factors such as the presence or absence of cereal trash, associated with the two methods of cultivation and which influenced the influx of winged aphids in autumn, still retained a strong visual difference in summer, thereby influencing the alighting of winged aphids. The higher aphid wheat head infestation in 2005 relative to 2006 and 2007 was most probably due to lower rainfall during May and June. The rainfall in this period in 2005 was 25% lower than in 2006 and 34% lower than in 2007, respectively. The cereal aphids S. avenae and M. dirhodum were found by Ajayi & Dewar (Reference Ajayi and Dewar1983) to be more numerous on BYDV-infected wheat, oats and barley plots than on healthy plants, and the authors suggested that the colour of infected barley and oats was the probable reason for the higher numbers in these crops but also noted that the colour of symptoms in the case of wheat was insufficiently different to be responsible for differences in aphid numbers. While Ajayi & Dewar (Reference Ajayi and Dewar1983) found that S. avenae were more fecund and more numerous on infected than on healthy plants, aphid numbers never exceeded 10/tiller and, in one of the two seasons, only reached a mean density of 1·8 aphids/tiller. Virus symptoms in the present wheat trials were confined to the flag leaf and were not very pronounced or extensive; they were not regarded as being responsible for the differences in aphid numbers on wheat heads in plots of each method of cultivation. Grain aphids (S. avenae) are known to disperse by moving from tiller to tiller by ‘falling’ to the ground and reclimbing (Dean Reference Dean1973 a; Carter Reference Carter1987; Sopp et al. Reference Sopp, Sunderland and Coombes1987; Holmes Reference Holmes1988). This aphid fall-off from wheat heads can be as great as 0·35 of the head population (Kennedy Reference Kennedy1990), and while on the ground, aphids are vulnerable to polyphagous predators such as carabid beetles. Larger carabid species (and presumably the more voracious) such as Pterostichus melanarius were more numerous in MT plots, whereas smaller predators such as Bembidion were more plentiful in CT plots; however, overall carabid numbers did not differ between the two systems of cultivation (McDonald Reference McDonald2007). Despite the activity of predators and the differences in beetle species composition between the two systems of cultivation, the lower occurrence of aphids in MT relative to CT and in straw relative to no-straw plots is considered as being mainly a consequence of the relative aphid abundances in these plots in the preceding autumn. In the present study, the incorporation of straw into the soil resulted in fewer aphids on plants during November and on the heads of wheat during early July. The most significant reduction in aphid numbers was between straw and no-straw plots within the MT system and in the season of greatest aphid abundance. The greater aphid-reducing effect of straw in the MT relative to conventional till plots was not surprising since the latter system of cultivation resulted in considerably less straw on the soil surface due to greater incorporation in the soil. The use of straw enhanced the effect of the stubble trash in the MT in suppressing aphid numbers. Lower aphid infestations in straw relative to no-straw in the present and other trials (McDonald Reference McDonald2007) are attributed to a reduction in the visual attractiveness of straw-treated crops to flying aphids. The immigration of winged aphids to wheat crops in summer was most unlikely to be affected by either surface stubble or straw from the previous autumn, since most visible semblances of straw would have vanished. If this were true, then the differences in aphid numbers between the two systems of cultivation and also between straw and no-straw plots were most likely due to aphid colonization of plots in the preceding autumn.
Effect of cultivation system and straw on virus incidence
The incidence of BYDV was lower in MT plots when compared with CT plots and lower in straw-treated plots within each system of cultivation relative to no-straw plots. The positive relationship between autumn aphid abundance and subsequent virus incidence agrees with the findings of Kennedy & Connery (Reference Kennedy and Connery2001) and was greater for barley than for wheat, which was mainly due to the occurrence of high aphid infestations in barley in autumn 2001. Reduced BYDV infection resulting from reduced seedbed cultivations has been recorded for winter barley by Kendall et al. (Reference Kendall, Chinn, Smith, Tidboald, Winstone and Western1991, Reference Kendall, Chinn, Glenn, Wiltshire, Winstone, Tidboald, Glenn, Greaves and Anderson1995) ; these workers recorded the greatest infection in CT plots, quite low infection in direct drilled plots and intermediate infection between these two for non-ploughed cultivated plots. They also noted more infection in plots from which straw was removed than those in which straw was incorporated. They conjectured that fewer winged aphids settled on non-ploughed ground because of the reduced contrast between young seedlings and the soil surface, due to straw and stubble on the surface. The application of straw mulch to protect newly emerged crops from virus diseases vectored by aphids has been reported for crops other than cereals. Bwye et al. (Reference Bwye, Jones and Proudlove1999) found that spreading straw on the soil surface suppressed cucumber mosaic virus in lupins, in the range of 0·4–0·75 of the level of virus in the unprotected crop; they also noted that virus suppression increased with the amount of straw, while stubble retention and MT also reduced incidence of the disease. Heimbach et al. (Reference Heimbach, Eggers and Thieme2001) found that applying straw mulch to potatoes and rape reduced aphid infestation with subsequent lower incidence of potato virus Y (PVY) in potatoes and turnip yellows virus in rape. The control of PVY by means of straw mulch was investigated by Saucke & Döring (Reference Saucke and Döring2004), who found that straw mulch was most effective early in the year, when vectors were plentiful; the straw acted as a PVY protectant for young plants. In the present experiments, the lower incidence of virus in MT relative to CT and straw-treated relative to no-straw plots at GS 49 was related to the abundance of wingless aphids during the preceding autumn, which in turn was determined by the extent of earlier colonization by winged aphids. McDonald (Reference McDonald2007) found that the extent to which winged aphids colonized cereals in autumn was influenced by the presence and amount of chopped straw on the soil surface. The straw and stubble debris was regarded as masking the establishing cereal plants, thereby reducing their visibility to and colonization by virus-carrying winged aphids. The present results show that the risk of BYDV to MT cereals in autumn is lower than that to CT crops and, consequently, MT crops need less insecticide treatment in order to control this disease.
Virus strain
All plants serologically examined for BYDV tested positive for the MAV strain, with 0·003 of those also positive for a mixture of PAV and RPV viruses. The results of serological screening of plants in 2001/02, when the disease was prevalent, are surprising in that only the MAV-strain virus was detected, while R. padi, which mainly vectors RPV and PAV strains (Rochow Reference Rochow1969, Reference Rochow1979, Reference Rochow1982; Gill Reference Gill1969; Plumb Reference Plumb, D'Arcy and Burnett1995), comprised 0·9 of the aphids on barley on 12 October 2001. This species only constituted 0·53 of the aphid fauna on 15 November 2001, and on 8 March 2002, it represented only 0·01 of the population, with 0·86 being S. avenae and 0·11 M. dirhodum. The latter two species are vectors of the MAV strain (Rochow Reference Rochow1970, Reference Rochow1979; Gildow & Rochow Reference Gildow and Rochow1983). While BYDV strains are named after their principal vector (Rochow Reference Rochow1970), specificity is not absolute (Rochow Reference Rochow1959, Reference Rochow1961; Creamer & Falk Reference Creamer and Falk1989; Halbert et al. Reference Halbert, Connelly, Lister, Klein and Bishop1992). The coincidence of high numbers of R. padi in autumn 2001 and the high MAV-virus incidence subsequently suggests that this aphid may have had some role in introducing the disease into the crop. While a low rate of transmission of MAV-strain BYDV by R. padi is possible (Rochow Reference Rochow1970; Plumb Reference Plumb, D'Arcy and Burnett1995; Power & Gray Reference Power, Gray, D'Arcy and Burnett1995; Sadeghi et al. Reference Sadeghi, Dedryver, Riault and Gauthier1997), there is little evidence of widespread transmission of MAV virus by this aphid. In a separate study using real-time (RT)-PCR, McDonald (Reference McDonald2007) found 0·28 of R. padi on grasses and volunteer cereals and 0·06 of those on maize during autumn tested positive for MAV virus. However, the proportion of these aphids capable of transmitting this strain of the disease was not measured. While the role of R. padi in introducing the MAV virus to autumn sown crops in the present study was not determined, the spread of the disease within crops was considered to be due mainly to S. avenae and to a small extent to M. dirhodum. This conclusion was based on (i) an increase in the density of S. avenae throughout the autumn, winter and spring, (ii) the known dispersal activity of S. avenae within crops, (iii) the almost total absence of RPV and PAV strains, which are transmitted by R. padi, and (iv) the symptoms of the disease observed on plants were those associated with S. avenae (and M. dirhodum) symptoms. The dominance of the MAV strain in these trials is consistent with that recorded in earlier studies in Ireland (Kennedy & Connery Reference Kennedy and Connery2001) and confirms this strain and its principal vector S. avenae as the main components in the epidemiology of BYDV in Ireland.
Grain yield
In 2002, the MT barley plots had 16% greater grain yield than the CT plots, while the straw-treated plots within each system of cultivation outyielded the no-straw plots. This difference was due to lower virus incidences in the MT and straw plots when compared with that for CT and no-straw plots. The combined effect of MT plus straw, which had fewest aphids and lowest virus incidence, had the greatest yield, being 21% more than that for the CT without straw. The difference in grain yield between cultivation and straw treatments, corresponding to BYDV incidences, was significant but were also less than anticipated. Kennedy & Connery (Reference Kennedy and Connery2001) reported a yield difference of 3·2 t/ha for conventionally cultivated winter barley, corresponding to a difference in the proportion of plants with virus symptoms of 0·36. In the present study, a 0·4 difference in virus symptoms resulted in a yield difference of only 1·24 t/ha. Because both studies had the MAV-type virus and because disease symptoms were measured at the same stage of plant growth, this yield difference is most likely due to differences in soil type at each site. The site of the present investigation is a free-draining, drought-prone, light-textured soil (Conry & Ryan Reference Conry and Ryan1967) that produced a top barley yield of 7 t/ha, whereas the former site had a higher clay content and produced a top yield of almost 9 t/ha. In 2005, the grain yield of wheat was marginally greater for MT over CT and for straw-treated over no-straw plots within each system of cultivation, probably due to an aphid-mediated effect. The major element of this effect was regarded as a reflection of the differences in virus infection levels between treatments but was also probably due, to a small extent, to the impact of different aphid densities feeding on the heads of wheat during summer. Infestations of 20–30 aphids/head can cause a 10% reduction in yield, increasing to 30% where the attack is prolonged and reaches 150 aphids/head (Kolbe Reference Kolbe1969, Reference Kolbe1970; George Reference George1974; Kolbe & Linke Reference Kolbe and Linke1974). In two similarly treated winter wheat crops, one grown on the site of the current study and the other on a clay loam and having a peak aphid density of 16 and 17 aphids/head, respectively, the reductions in yield due to aphid feeding were 15 and 5% (Kennedy Reference Kennedy1990). Thus, soil type as well as other factors (aphid density, duration of feeding and plant GS when feeding commenced) affect the extent to which aphid feeding reduces grain yield. A further, although undetermined, yield-reducing effect may have been the occurrence of the grass weed Sterile brome, which was mainly found in MT plots and was more prevalent in those with straw. In 2006, yields were almost identical for both systems and for straw treatments within both systems. However, in 2007, the yield of wheat was significantly lower (19%) for the MT when compared with CT, while within the MT system straw-treated plots were 29% lower than no-straw plots. These differences were due to factors other than aphids and BYDV. The recording of plant densities on 27 October 2006 showed that plants were more numerous in MT plots, both with and without straw, than in CT plots. However, the density of wheat heads on 11 July 2007 was significantly fewer for MT plots compared with CT plots, while within the MT system straw-treated plots had significantly fewer heads than no-straw plots. The relationship between grain yield and head density, as expected, was strongly positive (R 2=0·975, P=0·012). The reasons for the lower densities were not established but must be due to soil factors with the MT being disadvantaged relative to the CT. Rainfall during April 2007 was only one third that of the 30 year average. This moisture deficit may have been greater for MT plots, and the presence of significantly more earthworms in MT compared with CT plots was noted, leading to greater drainage through the worm burrows. In a separate investigation on the agronomy of winter wheat grown on medium to heavy textured loam soils, at Oak Park, Forristal & Murphy (Reference Forristal and Murphy2009) found no difference in grain yield between wheat grown in MT and CT plots or between straw and no-straw plots. The average yield for MT crops was 10·4 t/ha and that for CT crops was 10·2 t/ha. It is concluded that: (i) cereals sown in autumn by the MT method have lower aphid infestations, less BYDV and lower yield reduction due to virus than CT crops, (ii) the effect of stubble from the previous crop in reducing aphids and virus in MT crops is further enhanced by soil incorporation of straw, particularly in the case of MT cultivations. The practical implications of these findings are a reduced need for both autumn and summer aphicide treatment of cereals grown by the MT system of cultivation. September-sown conventionally cultivated cereal crops in Ireland normally receive two aphicide treatments, one in mid-October and the second in early-November. In the case of autumn-sown MT crops a single contact aphicide application during the first week of November should prevent loss in grain yield due to BYDV. The routine application of aphicide to wheat heads, in MT crops, is unwarranted and should only be undertaken if aphid numbers are seen to increase and are a threat to grain yield.
The authors thank Dr J. Grant for assistance with statistical analysis.