

1. Introduction
Among the key elements in the development of financial markets are the quantity and quality of information provided to investors on financial assets and on their issuers. The French financial market experienced remarkable growth during the first wave of globalization, from 1870 to the start of World War I (Rajan and Zingales Reference Rajan and Zingales2003). Consequently, about two million investors held at least some of the several thousand stocks and bonds listed on the Paris stock exchanges (Neymarck Reference Neymarck1911).Footnote 1 Although newspapers were a unique medium for spreading financial information and there were ‘hundreds of living titles’ (Albert Reference Albert and Bellanger1972, p. 261), most observers writing at the time pointed to the dearth of truly informative content offered by the financial press (Lysis Reference Lysis1912; Kaufmann Reference Kaufmann1914). They linked this state of affairs to payments made to the press by the information providers, which clearly constituted a distinct feature of this media market.Footnote 2 Observers blamed these payments for creating a conflict of interest and, ultimately, for biasing the information published. Calling such arrangements bribery and decrying the venality of the French press, they further argued that ‘in our society, those who have money have the newspapers and, consequently, the public opinion’ (Lysis Reference Lysis1912, p. 168).
Most historians (see, e.g., Feis Reference Feis1930; Albert Reference Albert and Bellanger1972) subsequently went along with the assumption that these periodicals contained little valuable information. A closer look at this market, however, indicates that countervailing forces could have been at work. Leroy-Beaulieu (Reference Leroy-Beaulieu1906, p. 251), who edited L'Économiste Français, pointed out that there did exist sincere and fair newspapers. Albert (Reference Albert and Bellanger1972) wrote that ‘a reliable financial press did nonetheless exist although their independence of thought could have been questioned’. Martin (Reference Martin2006) discussed the so-called venality of the press and judged that the phenomenon could have been overestimated by commentators at the time, whose negative assessments were completely accepted by historians.
Although payments were part of the standard publication contract, the idea that newspapers slanted information still needs to be proved. After all, a newspaper was also paid by its readers and thus was unlikely to act against its own interests without suffering some loss of credibility. More precisely, from the literature on two-sided markets we borrow the idea that an intermediary can set up a payment structure requiring that both sides (information providers and readers) pay to cover the operating cost. Consequently, the mere existence of payments to newspapers by information providers does not, in itself, prove information distortion. Rather, the effect of such payments on editorial policy is an empirical question that requires quantitative assessment. In this article, we construct a quantitative test to assess whether the coverage of firms listed on the Paris stock exchanges was biased towards paying firms in a sample of financial periodicals.Footnote 3 The test allows us to distinguish the coverage explained by the firms' financial performance or readers' preferences from the coverage linked to payments made to newspapers. We show that payments did bias the distribution of published information towards paying firms but that this did not necessarily have a negative impact on readers. The conclusion is therefore that the corruption of the media was overemphasized and that the quality of the supply of news must have helped to sustain the development of financial markets.
Few papers study the historical aspects of the dissemination of financial information. Some have focused on the effect of the dissemination of price lists in newspapers before the Industrial Revolution and argued that this facilitated arbitrage (Neal Reference Neal1988; McCusker and Gravesteijn Reference McCusker and Gravesteijn1991; Flandreau et al. Reference Flandreau, Galimard, Jobst and Noguès-Marco2009). Flandreau (Reference Flandreau, Flandreau, Holtfrerich and James2003) addressed the production of financial information on securities during the Belle Époque. Gille (Reference Gille1959) gave a comprehensive history of the French newspapers during the Second Empire, and Esteves (Reference Esteves2007) carefully reviewed the specialized media that bondholders could have used to become more informed about their portfolio. Bignon and Flandreau (Reference Bignon and Flandreau2010) studied the microstructure of the pre-World War I media market, explaining it in terms of agents protecting their reputation from badmouthing by others.
This article is also related to the literature that developed at the crossroads of media economics and finance or political science. We borrow from the political science literature a focus on measuring bias. A few authors have recently attempted to measure bias in the news in the political arena (Groseclose and Milyo Reference Groseclose and Milyo2005; Gentzkow and Shapiro Reference Gentzkow and Shapiro2006). This article is also linked to those that measure the media's relationship with the financial markets. Some work in this vein shows that, by disseminating information, the press helped to reduce such economic inefficiencies as the private benefits received by CEOs (Dyck and Zingales Reference Dyck and Zingales2004). However, most of these papers were concerned with measuring and explaining the media bias in reported financial market information. Huberman and Regev (Reference Huberman and Regev2001) gave an example of the media's effect on stock prices that stemmed solely from the reporting of soft information. Some other researchers have used the ‘event study’ approach to test the impact of financial newspapers' stories on stock prices (Chan Reference Chan2003; Bhattacharya et al. Reference Bhattacharya, Galpin, Ray and Yu2004). In the field of finance, the most similar approach is that of Reuter and Zitzewitz (Reference Reuter and Zitzewitz2006), who studied the bias created by advertisements in the selection of a newspaper's coverage of mutual funds. In contrast, we study the coverage of listed firms and the impact of a different payment scheme. The accusation against French financial periodicals looks similar to that made by researchers studying newspapers in the United States in the nineteenth century – namely, that the political press was partisan (Hamilton Reference Hamilton2004) and biased (Gentzkow et al. Reference Gentzkow, Glaeser and Goldin2006). Because our article deals with financial periodicals, we are able to show the importance of such bias and whether it matters to subscribers.
The rest of the article is organized as follows. Section 2 explores the various scandals that hurt the financial press in France during the latter part of the nineteenth century and the beginning of the twentieth century. Section 3 discusses the hypotheses and derives the empirical measures of media bias. Section 4 details the sample, the coding methodology and descriptive statistics on media coverage. Section 5 describes the dataset. Section 6 presents and discusses the results, and Section 7 concludes.
2. Information slanting and firms’ payments to newspapers
Much as the payment structure of rating agencies is blamed for the agencies' failure to provide appropriate rankings, historians have used various financial scandals to infer the media's efficiency in disseminating information on financial assets. The anecdotal evidence demonstrates that payments made by information sources to newspapers distorted the published information. This evidence helps us isolate the appropriate variable to serve as a proxy for hidden payments made to newspapers in constructing the quantitative test that we implement in the article. Section 2.1 presents these various affairs and the claims historians have made after studying them. Section 2.2 examines the structure of the flows of payments made by firms to newspapers so that we may derive a proxy for them, which will be used later in our quantitative analysis.
2.1. Newspapers in turmoil: from the Panama scandal to the Rochette affair
During the two decades from the 1890s to World War I, it was commonly claimed in journals, books and parliamentary reports that the press was bribed by its information sources and that this distorted the information published. The opinion that the press was bribed to slant published information first arose in the aftermath of the 1892 Panama scandal.Footnote 4 This scandal was openly discussed and resulted in a report by a special commission of lawmakers as well as a court decision. It was thus revealed that politicians and newspapers had been paid to put a positive spin on the activities of the Panama Canal Company and, notably, to foster the success of the company's bond issues. The Panama Canal Company had paid newspapers and journalists for announcements, advertising and favourable editorial coverage. Between 1880 and 1888, it paid from 12 to 13 million francs to newspapers while raising about 1.5 billion francs from the public (Martin Reference Martin2006, p. 23).Footnote 5
The scandal led to charges of corruption levelled at both the press and the politicians. It caused Anatole Leroy-Beaulieu – then a professor at Sciences Po – to question the very organization of the democratic system, blaming ‘extravagant governments, drudge lawmakers and a venal press’. The press was especially attacked because the scandal revealed that it was at odds with the romantic notion of the journalist who uses his pen as ‘a sword pure of any shed blood’ and so is ‘the modern knight, the righter of wrongs’ (Leroy-Beaulieu Reference Leroy-Beaulieu1894, p. 733).Footnote 6 As a result of the Panama scandal, the perception of the newspapers’ accuracy changed among the general public and the elite. Discussions revolved around the role played by money in slanting published information. La Revue Bleue, an influential periodical among the elite, opened its columns in 1897 to debate on the ‘responsibilities of the press’. Henry Béranger, the discussion's initiator, argued that ‘cash, when it reigns, is never a principle of superiority and quite always a principle of corruption’ and that ‘our legislature planned the independence of the press towards judges or the police, but did not foresee the slavery of the press towards business and the plutocracy’ (Reference Béranger1897, pp. 708–9). Yet not all commentators shared this view. Georges Clémenceau – a lawmaker and journalist at L'Aurore – argued that the readers must be blamed for failing to identify the truth; also, the novelist Émile Zola and the socialist lawmaker Jean Jaurès pointed out that one should be confident in the outcome of a free market that sorts out good journals from the bad.
March 1908 saw another financial affair that linked politics, the financial market and the media. This was the Rochette affair, which also ended up in a commission of the National Assembly and a court judgment.Footnote 7 Henri Rochette was a financier who owned two banks, about a dozen other companies (notably mines) and three financial newspapers. When he tried to take over Le Petit Journal – a newspaper owned and managed by Senator Charles Prevet – the Paris préfet Lépine (the highest representative of the French government in Paris) searched for investors to lodge a complaint against Rochette, who was accused of releasing flawed and possibly altered information on his companies. According to the 1910 judgment, he attempted to influence investors through his own newspapers and by contracting with other newspapers to publicize his companies.Footnote 8 Rochette was convicted and sentenced to three years in jail. This financial turmoil revived the public debate on the mutual influence of newspapers and financiers.
In the context of periodic scandals, some commentators at the time such as Lysis (pseudonym of the journalist Eugene Letailleur) blamed the ‘quite universal corruption of our [French] press, paid, sold, indentured by the financial powers’ (Reference Lysis1912, p. 168).Footnote 9 Paul Leroy-Beaulieu, editor of L'Économiste Français, argued that when ‘articles and advertising are mixed up, it is clear that the press is losing its authority. It should no longer be regarded as a collection of information and people must distrust it’ (in Cassagnac Reference Cassagnac (de)1893, pp. 4–5). Zola (Reference Zola1880, p. 377), after noticing that ‘most newspapers that championed morality are indentured to the financial companies’, argued that they are ‘more or less noticeable cutthroat, organized robbery, lie and untruth printed in capital letters’. He concluded by adding that ‘many fly-by-night businesses experienced success while many families went bankrupt’ because of those practices. Eugene Kaufmann asserted that the financial press ‘does not have a value as a source of information; it is – besides few exceptions that are becoming rarer – an advertisement press rather than an opinion press’ (1914, p. 210; emphasis in the original). In 1925, Renard wrote that ‘the easiness with which the press extorts money had the effect of diminishing the consideration and authority that it could and should have enjoyed’ (p. 252).
Building on these judgments, historians – with the notable exception of Marc Martin – blamed this venality for weakening the press's credibility among the public. As Albert (Reference Albert and Bellanger1972) asserted, ‘financial advertising contributed to a significant extent to give to the French people a distorted view of the facts’ (pp. 266–7). Furthermore, ‘it exerted a real censorship on economic information, which resulted, in the short run, in discrediting the business world in French eyes and, in the long run, in diverting their attention from economic issues’ (p. 267). Jeanneney (Reference Jeanneney1981) observed that opinions published in newspapers ‘were surely not independent of secret subsidies’ (p. 210) and noted that financial advertising ‘takes the shape of misleading editorial analysis’ (p. 211). Although financial affairs clearly hurt investors, relying on extreme events to assess the quality of financial newspapers can be misleading. We therefore propose a methodology for measuring the bias implied by the advertisements. The next section uses historical evidence to derive a proxy for companies’ payments to newspapers.
2.2. Payments by companies to newspapers
Before World War I, two different terms were used to describe payments made by companies to newspapers in exchange for mention. The first was advertising. Leroy-Beaulieu (Reference Leroy-Beaulieu1906, p. 251) defined advertisements as ‘conspicuous announcements printed in special characters and appearing in a predefined section’. It was thus possible for the reader to distinguish them from the regular editorial content. The second term, réclame, is now considered outdated by French dictionaries. According to the dictionary Le Littré (1872–7), réclames – a special type of advertising – are laudatory articles that normally appeared in the editorial section of the newspaper and were paid for by the companies being lauded. Leroy-Beaulieu (Reference Leroy-Beaulieu1906, p. 251) warned investors that réclames were widespread and tended to substitute for advertising. Both types involved payments by companies to newspapers. A major difference is that payments made in the advertising section are obvious to both the reader and the researcher, whereas it is impossible to distinguish between regular articles and réclames.Footnote 10
There is much evidence that suggests how payments were made for réclames. According to Lajeune-Vilar (Reference Lajeune-Vilar1895, p. 53), they were an important – if not an essential – part of the budget of most independent newspapers. Oscar Marinitsch, who worked in the financial advertising sector, pointed out that ‘the good (and the bad) deals cannot succeed without the help of the press’ and that the information providers ‘contracted with the journalists or editor of the financial press or of the newspapers’ financial section’ (1892, p. 292). Leroy-Beaulieu (Reference Leroy-Beaulieu1906, p. 253) noticed that press campaigns using réclames usually lasted between one and three months, but they could have been maintained for several years as they were often paid for on a periodic and open-ended basis. Lajeune-Vilar (Reference Lajeune-Vilar1895, p. 53) distinguished between two types of payments: those made on a monthly basis and those that he called ‘expenditures in advertising granted by the investment bank that wanted to boost a new business or company’. In the latter case, the aim was to increase the trading of some security or the success of the introduction of a security on the stock exchange (Vallé Reference Vallé1893, p. 49).
In return for its payment, the payer expected to receive positive coverage. Soreph (Reference Soreph1909, p. 57) indicated that such sponsored securities were repeatedly promoted in the newspapers and that, in each new issue, the information disclosed became more ‘triumphant and precise’. Leroy-Beaulieu (Reference Leroy-Beaulieu1906, p. 252) advised investors that when the same type of sentences using clichéd language appeared in an article, it should be taken as self-serving (paid) advice. These facts all indicate that coverage could be taken as a proxy for slanting.
Companies did not pay the newspapers directly; instead, intermediaries, such as investment banks and specialized brokers, arranged for the payments to be made (Lajeune-Vilar Reference Lajeune-Vilar1895; Zeldin Reference Zeldin1993, pp. 519–26). Even Russia, one of the most important agents on the Paris financial market, did not bypass this complex market structure (see Raffalovich Reference Raffalovich1931, pp. 74, 176, 205, 208).Footnote 11 It delegated payments to its main investment bank, Banque de Paris et des Pays Bas, which further delegated the payments to newspapers through Lenoir, a specialized broker.Footnote 12 There were two principal advantages for delegating payments to investment banks: (1) pooling the payments of various firms gave banks more bargaining power;Footnote 13 and (2) banks knew much more than the firms about the workings of the media industry. The likely rationale for the delegation of payments by banks to specialized brokers was that the brokers had a special talent for enforcing the contracts. According to the parliamentary report on the Panama Canal affair, this was the company's motivation in 1886 for making payments to newspapers through the broker Batiau (Vallé Reference Vallé1893, p. 358).
One consequence of this complex structure – through which hidden payments flowed from companies to newspapers – is that yearbooks of securities such as Annuaire Desfossés provided information on the investment bank with which a company did business. Indeed, investment banks provided a bundle of financial services to companies, including legal representation, payment of the dividend or the coupon of securities, and, of course, the hidden payments made to newspapers.
3. Hypotheses and measures of media bias
Although hidden payments could have distorted the information available to investors and hence their allocation of funds to financial assets, we show in Section 3.1 that such payments do not, in themselves, prove information distortion. In order to assess the quality of the newspapers, Section 3.2 presents a quantitative test to construct a measure of media bias.
3.1. Hypotheses
A financial newspaper is an intermediary that selects information and presents it to readers. Dyck and Zingales (Reference Dyck, Zingales, Islan, Djankov and McLiesh2002) argued that the effect of these papers is to ‘selectively reduce [an] agent's cost of collecting information and evaluating information’ (p. 109). Most of the discussion implied by this definition revolves around the elements that determine the selection of news. The news reporting can be biased by conflicts of interest originating in the preferences of their readership (Mullainathan and Shleifer Reference Mullainathan and Shleifer2005), the view of the owner of the news organization, by journalists having career prospects (Baron Reference Baron2006), and/or their relationships with information providers and advertisers (Dyck and Zingales Reference Dyck, Zingales, Islan, Djankov and McLiesh2002; Besley and Prat Reference Besley and Prat2006).
Besley and Prat (Reference Besley and Prat2006) showed that payments by information providers reduce the informational content of the media when they have an interest in accepting bribes for suppressing the disclosure of bad news. In their model, the conflict of interest relies crucially on the assumption that the interests of readers and the government are in opposition when the dissemination of positive news is not credible. Since firms derive rewards for being mentioned in the media – because this influences the portfolio choice of investors (Merton Reference Merton1987) or generates an asset price above other comparable assets (Veldkamp Reference Veldkamp2006) – it follows that the firms have a vested interest in paying the media either to suppress some news or to publicize it among investors. In the context of financial newspapers, payments could motivate newspapers not to publish negative information on companies or to overweight the coverage of paying companies.
Another approach is provided by the two-sided market literature (Rochet and Tirole Reference Rochet and Tirole2006) that has been developed to understand markets involving an intermediary whose business consists of making connections between various types of agents (the two sides of the market).Footnote 14 A newspaper perfectly fits with this definition. On one side, it forms relationships with the information providers (the supply side of the news) and with the advertising market; on the other side, it interacts with readers by selling issues (the demand side). In this framework, the payment structure is an instrument for inducing both sides of the market to participate: the price charged to one side of the market can be used to subsidize the other side. Bignon and Flandreau (Reference Bignon and Flandreau2009) proposed a rationale for firms with good financial performances to pay for newspaper coverage, arguing that such payments are a strategy to counteract the threat of badmouthing. In this view, companies’ payments are complementary to readers’ payments, and newspapers should accept payments to publish réclames only from those companies that have performed well.
We thus have two competing explanations for the payment structure. One explanation, following Besley and Prat (Reference Besley and Prat2006), predicts that payments induced a coverage bias towards poor-performing firms, whereas the other explanation leaves the expected impact on the editorial policy undecided. Resolving the issue is therefore an empirical question. In order to gauge whether newspaper readers were hurt by these payments, we implement a quantitative test whose methodology proceeds in two steps. First, we use regression analysis to measure the existence of a coverage bias. Second, we compute the yields and returns of equity portfolios to measure the impact of this bias on the performance of these portfolios. In the following section we describe the variables and the method used to compute the results of the regressions and the stock portfolios.
3.2. A measure of the coverage bias
One can expect rational readers to buy one issue of a newspaper if the value of its informational content is greater than the cost of buying it. From the reader's point of view, a financial newspaper is a collection of pieces of information that could affect asset prices. A reader seeks information on the performance of firms (i.e. on the return and the risk of their stocks), but his/her preferences can also involve the firm's characteristics, which include its nationality, the country in which it is operated, and its sector of activity. A firm's nationality is likely to influence investors because it defines the legal system in which property rights can be enforced. We therefore check for any relationship between a firm's country of registration and its exposure in the press. This effect will be negative (resp., positive) if investors were reluctant (resp., more likely) to hold stocks issued by foreign firms. If investors formed preferences over a sector, then a media outlet may bias disclosed information toward that sector.
Another important determinant of the demand for newspapers is the ease with which an investor can find information on companies without buying a newspaper. In a world where investors hold stocks of firms operating abroad, this is likely to influence the purchasing decision of the readership because the increase in distance makes it more expensive to acquire information on foreign companies (as compared with domestic companies) without buying a newspaper. We therefore expect the media to give comparatively greater coverage to companies that operate abroad.
We also recognize that firms’ coverage may reflect the tendency of newspapers to write about enterprises for which there is a wide audience, where audience is measured by market capitalization. If it mattered, the effect would be to switch the distribution of published news towards big firms, in which case the coefficient of the firm's size would be positive. Newspapers might also have targeted readers who invested with different time horizons. If liquidity traders (i.e. traders who value the liquidity of assets) are targeted, then the newspaper will tend to cover equities characterized by higher liquidity and (relatively) lower price volatility. Another potential targeted readership was long-term investors (known as rentiers), whose buy-and-hold strategy entails more concern about the yield and security of investments. If the preferences of the readership were sufficiently diverse, then some newspapers could have targeted investors looking for stocks with low risk and low yield, while others tried to attract those seeking higher risk and higher yield.
Payments by firms to newspapers could have biased published information in favour of paying firms. First, as pointed out in Reuter and Zitzewitz (Reference Reuter and Zitzewitz2006), one can expect a positive correlation between a firm's coverage and the volume of its advertising.Footnote 15 The variable Ads measures advertisements made in special characters and appearing in a predefined section. Second, the regression also includes a proxy for réclames. We account for them by introducing a dummy variable that measures the link between the firm and the investment bank that paid the dividend to investors in lieu of the company. The dummy is set to 1 only if a link is found between a company and a given bank X (where X stands for the name of the bank). Because it could have been more likely that firms paid for advertising if they were raising funds on the financial market, we introduced a variable IPO that is set to 1 only if the company sold stocks to investors during the year of our study.
Media bias is assessed using regressions of the coverage of each company over its characteristics, performance and the payments it made. The following specification is considered:

where Exposures is the number of newspaper articles about a firm, FP is the set of variables measuring the financial performance of its stock, and FC is a set of controls for the firm's characteristics. The regression also included the dummy variable IPO. The variable Ads can be either the number of advertisements or a dummy variable (set to 1 only if the company advertised). The variable Bank X is a full set of dummies that accounts for the link between a company and a bank.
The null hypothesis is as follows. When a newspaper's readers are rational investors (i.e. they want to learn about events that can affect the value of their financial assets), we expect the editor to select the most accurate available information in order to maximize readership (and build a reputation). Thus, we expect the financial variables to be significant and the payment variables (both Ads and Bank X) to be insignificant. This effect could be offset by firms paying to boost their exposure in the newspaper. If so, then the financial variables might appear to be insignificant while the payment variables are significant, indicating that payments were the main driver of the editorial policy. Another possibility is that both the payments and performance variables are significant. In that case, the regression will not be informative about the effect of the payments on investors.
Of course, the mere existence of media bias does not mean that the bias is detrimental to readers. Indeed, even if the payment variables appeared to be positive and significant, investors would suffer only if a newspaper was characterized by a low ability or willingness to select companies accurately (i.e. if it switched its focus to poorly performing firms). As a preliminary step, we tackle this issue by checking whether newspapers chose the best-performing firms among those linked to Bank X. We introduce an interaction term between the Bank X and the FP variables (e.g. return on the firm's stock). A positive and significant coefficient for this variable indicates that, on average, paying firms with the best performance were highlighted by the press.
The regression results can merely provide a mapping between the companies’ coverage and its determinants, so in a second step we measure the impact of media bias on investors. Our aim is to judge the newspaper's coverage in terms of the financial yield to a reader who bought a portfolio of equities based solely on that coverage. The measures used to assess a portfolio's performance are the mean and the variance of the return, both computed for each newspaper based on the population of firms that it covered.
The weight of a company in the portfolio is computed as the ratio of the number of exposures (mentions) received by the company and the total number of exposures, with the sum of all weights set equal to 1. There are various ways to compute the weights. Coverage that is biased towards paying firms defines a portfolio subject to media bias. We can use the regression analysis results to compute the weights of unbiased portfolios by removing the effect of the payment variables on media coverage. The various weights are used to compute the return and variance of portfolios, which can then be compared to check whether unbiased portfolios performed better than biased ones. It will be seen that investors are worse off with a biased newspaper only if its biased portfolio performs worse than unbiased ones.
4. Sample, time period and coding of companies’ coverage
The choice of the sample of newspapers is discussed in Section 4.1, and Section 4.2 presents the time period chosen to implement the test. Section 4.3 describes the coding methodology and the descriptive statistics on coverage.
4.1. Sample of newspapers
The number of financial newspapers grew from 210 in 1889 to a peak of 287 in 1907.Footnote 16 None of these newspapers have been digitized and so, given that we had to count coverage manually, our selecting just a few was inevitable. The ideal criteria for selecting the sample would have been to choose those with the greatest circulation, because this would have provided a measure of their impact on investors. Unfortunately, figures on circulation were considered proprietary information and were kept secret by the editors.Footnote 17 The impact of newspapers must therefore be determined using other variables. To choose the proxies, we make the following assumption: because newspapers were the sole (public) information providers on firms and because no regulation required legal disclosures by firms, readers were rational and searched for informative, high-quality newspapers.
In selecting the sample we tried to avoid two pitfalls. First, we avoided newspapers with a bad reputation for accuracy but no circulation. Indeed, commentators recognized that some newspapers were managed by fly-by-night editors who tried to blackmail companies and/or sovereign states. They warned investors about them, adding that such periodicals were easy to recognize because they were cheaply produced (Lajeune-Vilar Reference Lajeune-Vilar1895, p. 50; Leroy-Beaulieu Reference Leroy-Beaulieu1906, pp. 250–1; Neymarck Reference Neymarck1911, p. 136). Soreph (Reference Soreph1909, p. 54) indicated that ‘we shall not expect careful readers to buy them’. Bignon and Flandreau (Reference Bignon and Flandreau2010) showed that the market structure limited the ability of these papers to extract money and that they appeared intermittently, which limited their readership. Although such newspapers were surely biased (this was their intention), it was unlikely that they affected the stock market through their readership. Therefore, a bad newspaper could garner readers only by copying the characteristics of quality newspapers.Footnote 18 Soreph (Reference Soreph1909) pointed out the recurrence of this strategy.Footnote 19
The second pitfall would be to select newspapers that were considered undoubtedly unbiased. Those periodicals that valued their reputation must have had the least incentive to bias information. However, most commentators did not consider even quality newspapers to be unbiased.Footnote 20 Lajeune-Vilar (Reference Lajeune-Vilar1895, p. 51) stressed that ‘less than a dozen newspapers such as Le messager de Paris, L'économiste [français] or Le capitaliste really had an influence on the financial business’ but admitted that ‘they had a stake in the various financial operations’ (pp. 51–2). Albert (Reference Albert and Bellanger1972) questioned the integrity and independence of the reputable L'Économiste Français and L'Économiste Européen (p. 262; Soreph Reference Soreph1909, p. 54). Because most financial newspapers were accused of being systematically biased, it appeared necessary to study the existence of bias also in reputable newspapers. However, we recognize that the few extremely expensive newspapers (i.e. those costing more than 80 centimes) must have had a lower tendency to mislead readers, so we excluded them from the sample.
The independence of newspapers with regard to the financial sector was hotly debated and must have been valued by readers. But some newspapers also realized this and proclaimed that they were independent – even if they were, in fact, owned by a bank or financial intermediary. While gathering information on ownership, we found that it was common to read on a newspaper's front page that it was independent when a simple verification showed that it was actually managed by a bank.Footnote 21 Some newspapers offered free services to their subscribers, including personalized financial advice, security trades and cashing of coupons or dividends. Those were typical services of banks and brokers and thus signalled their ownership. Many commentators at the time observed that bank-owned newspapers were not fully reliable if the bank used the newspaper to publicize its business. This was the goal assigned by Rochette to Finance Pratique (Folleville Reference Folleville (de)1911, pp. 126–7). Lajeune-Vilar (Reference Lajeune-Vilar1895, p. 52) indicated that such newspapers were subsidized by their owners to balance their budgets. Because this could have resulted in a lower need to rely on external payments, one can expect these papers to be biased towards the bank's own business. A countervailing argument, however, was that nothing precluded a newspaper from accepting payments from other firms. Indeed, Soreph (Reference Soreph1909, p. 58) argued that even a bank-owned newspaper could have been paid by that bank's competitor to highlight the competitor's activities. Therefore, it is worth considering both independent and bank-owned newspapers.
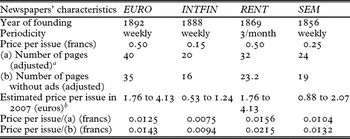
The sample was selected using a set of observable characteristics that were recognized by memoirs or investment manuals as proxies for quality newspapers (Feydeau Reference Feydeau1882, p. 171; Lajeune-Vilar Reference Lajeune-Vilar1895; Leroy-Beaulieu Reference Leroy-Beaulieu1906; Soreph Reference Soreph1909). These characteristics include a periodic appearance; the year of founding; a clear indication of the name of the editor; and the price, tone and organization of the editorial content. Four newspapers were included in our data set. Two were managed by independent journalists who were also economists or statisticians.Footnote 22L'Économiste Européen (hereafter EURO) and Le Rentier (RENT, published every ten days) enjoyed some reputation and did not offer free financial services. The sample also included the Journal des Intérêts Financiers (INTFIN), which was owned and managed by an investment bank (Crédit Mobilier), as well as La Semaine Financière (SEM), which was probably owned by a financial intermediary. Although it appeared to be independent and managed by journalist Charles Bourdon, SEM offered its readers brokerage services and had links with Banque des Français.Footnote 23 Of these, Favre (Reference Favre1909) classified only RENT and EURO as independent. The first issue of EURO was published in 1892, INTFIN in 1888, RENT in 1869 and SEM in 1856. These newspapers were published either weekly or every ten days, as were half of the financial newspapers in 1907.Footnote 24
Although the focus and organization of the news could have differed greatly among newspapers, our sample is limited to those that shared the same organization: a first section presenting and discussing macroeconomic events; a second section presenting detailed financial information on firms; a third section that pooled advertisements; and a final section that gave a list of asset prices. Alfred Neymarck advised investors to read periodicals for which they knew the name of the editors, trustees, or journalists (1911, p. 136). The endless repetition of this advice in investment manuals must have had an impact on readers, and we decided to follow it.
Soreph (Reference Soreph1909, p. 54) pointed out that price reflects quality and urged readers to care about this. Ernest Feydeau, a bank employee and novelist, remarked that readers must be concerned with the fact that the precision, accuracy and coverage of information by a newspaper is in proportion to its price (1882, p. 173). Newspapers priced less than 15 centimes per issue were thus excluded from our sample. As detailed in Table 1, one issue of EURO or RENT cost half a franc, whereas SEM cost 25 centimes and INTFIN 15 centimes. EURO and RENT were fairly expensive compared with the other financial newspapers, whose mean price was 34 centimes (the modal and median value was 25 centimes).Footnote 25 Deflated by the consumer price index, the 2007 value of these prices ranges between 0.88 and 1.76 euros (see Table 1). Computing the actual cost using hourly wages gives higher but comparable figures (between 1.24 and 4.13 euros).
Statistics on the newspapers in our sample

Source: Authors’ calculations.
a The number of pages per issue of RENT was adjusted to account for its larger format.
b Two methods were used to estimate the current price. The first number was computed using the general price index (1 franc in 1907 equals 3.51 euros in 2007). The second number was computed using the hourly wage in 1906 of a Parisian worker (0.85 francs) gathered from the 1946 INSEE yearbook and using the 2007 minimum wage (7.03 euros). The price of EURO in 1906 was 1.7 times an hour's work, but in 2007 its cost of 4.13 euros was less than 0.6 times an hour's work. Using both methods to replicate the price evolution of the sole newspaper (Le Figaro) that existed in 1907 and continues today shows that its 1907 price (0.15 francs) is valued at 0.52 euros using the price index and at 1.23 euros using the hourly wage (for a 2007 price of 1.10 euros). The second estimate is also comparable to the price of today's financial periodicals, suggesting that newspaper prices actually increased more than the price index.
4.2. Sample period
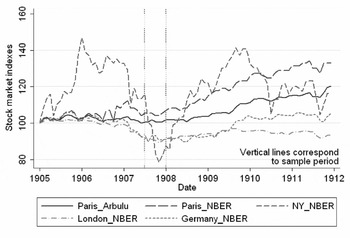
The data were collected for the period from 1 July to 31 December 1907. To minimize the possible effects stemming from a bear or a bull market, we chose a period that was characterized by a fairly stable stock index. Figure 1 depicts the evolution of the Paris stock index and compares it with those of the other main stock markets.Footnote 26 During the last half of 1907, the Dow Jones Industrial Average (DJIA) fell by 27.5 per cent, and the Berlin and London exchanges also suffered declines. In Paris, the decrease was 2.3 per cent during the first half of the year, but the index increased by 0.9 per cent during the second half (while London dropped by 2.4 per cent). There is no evidence that the substantial DJIA decline affected European stock markets to the same degree. The three biggest monthly drops in Paris in 1907 amounted to 3.6 per cent in March, 2.6 per cent in June and 1.3 per cent in October; in contrast, the DJIA fell by 13.3 per cent in March, 13.3 per cent in August and 15.5 per cent in October.Footnote 27 The three largest declines in the Berlin (resp., London) monthly index were 3.9 per cent (3.3 per cent) in March, 2.7 per cent (1.9 per cent) in June and 2.7 per cent in October (3.8 per cent in August). Neymarck noted that French investors lost money as a result of the US crisis because they have bought ‘securities traded only abroad or those of various types of mines’ (1991, p. 392).
Evolution of the Paris stock index and the major foreign markets (1905–12)
Source: NBER Stock market indexes database; Arbulu (Reference Arbulu and Gallais Hamonno2007).

The US financial crisis had little impact on the French economy. In 1907, the French gross domestic product (GDP) grew by 5 per cent according to Toutain (Reference Toutain1997) and by 7.9 per cent according to Levy-Leboyer and Bourguignon (Reference Levy-Leboyer and Bourguignon1985). Given that these numbers were constructed ex post, one may wonder about the evolution of a more accurate measure of business cycles. The evolution of the index of industrial prices shows a 4.2 per cent increase in 1907 and a decrease of 2 per cent in 1908, although the latter drop is the seventh lowest (out of eight) during the 1895–1914 period. This evidence of a weak transmission of the US crisis to the French economy is in line with Bordo and Murshid (Reference Bordo and Murshid2006), who pointed out that, ‘before 1914, financial shocks were communicated from the core countries of Europe (especially the UK) to the periphery, but in general this channel did not operate in reverse’.
4.3. Coding methodology and descriptive statistics on coverage
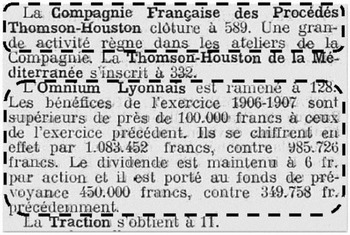
The media exposure of companies is assessed by counting the number of times an article was published on each company in each newspaper. Because each newspaper published a list of prices in a separate section, each article that mentioned only the stock price of the company was coded as 0; more detailed information was coded as 1. Figure 2 shows an excerpt from SEM that will serve to illustrate our coding methodology. For Thomson-Houston de la Méditerranée and Traction, the newspaper gives only the stock price, and so a value of 0 was assigned. Readers obtained more valuable information (shown within the dashed boxes) for the other two companies mentioned in Figure 2 – in particular, that ‘the factories of the Compagnie Française des Procédés Thomson-Houston experienced a significant business activity’ and that Omnium Lyonnais made higher profits in 1906–7 than before. These two observations were each coded as 1.
Excerpt from La Semaine Financière, 16 November 1907

The sum of news releases concerning a given company defines a statistic that accounts for the media coverage of the firm in a given newspaper. The descriptive statistics of the sample indicate that, altogether, 929 firms were mentioned or discussed in 4,817 articles. Because of missing data for explanatory variables, our analysis will henceforth focus on a reduced sample of 694 firms mentioned in 4,409 articles. News coverage was classified as either negative or positive. Negative exposure was defined as any information or event that most likely had a negative impact on a company's current or future performance, regardless of whether or not the information was factual. One example (Cape Copper), taken from the 30 September 1907 edition of L'Économiste Européen, is as follows: ‘the stock price is declining due to reduced production in August, itself due to lower grade ore and a new tax will now hit the company's profits’. Other examples include reporting on lower sales, losses, increased costs, strikes and announcements of lower dividends. Using these criteria, only 5.1 per cent of the write-ups in EURO, 4.9 per cent in INTFIN, 8.2 per cent in RENT and 3.5 per cent in SEM were negative.
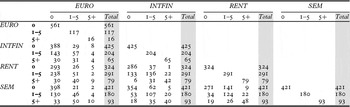
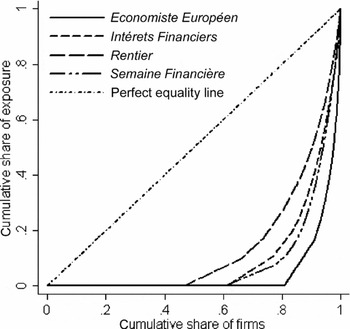
Newspapers differed with respect to the number of companies on which information was published. Of the 694 sample firms, RENT gave exposure to only 370 of them; and EURO, SEM and INTFIN mentioned (respectively) 133, 269 and 273 of the firms (see Table 2). To show that the media focused coverage on a subset of firms, we plot the Lorenz curves of each newspaper in Figure 3. It appears that about 60 per cent of the sample firms never appeared in INTFIN or SEM. The Gini index is 0.72 for RENT and 0.91 for EURO.Footnote 28 Another noteworthy feature is that newspapers did not report on the same subsamples. Table 2 illustrates that, of the 561 companies that never appeared in EURO, 143 appeared one to five times (and 30 appeared more than five times) in INTFIN. Also, more than half of the companies that never appeared in EURO did appear at least once in RENT. Even if the analysis is restricted to companies mentioned once in at least one of the four newspapers, there is a lot of variance that remains to be explained, not only within each newspaper but also among the four of them. The regression analysis will allow us to assess each newspaper's editorial policy – that is, the variables explaining the selection of the sample of news. Given that the left-hand-side variable is the number of articles published about a firm by a newspaper within the period, all regressions used a count model (Cameron and Trivedi Reference Cameron and Trivedi1986). In order to account for overdispersion of the distribution, we adopted a negative binomial model.Footnote 29
Cross-tabulation of the exposures of 694 firms in financial newspapers

Source: Authors’ calculations.
Note: Entries are the number of firms with zero, one to five, or more than five exposures.
Inequalities in the media exposure of 694 firms (Lorenz curves)
Source: Authors’ calculations.

5. Data set
The list of covariates is organized into three groups. The first group includes variables summing up financial performance; the second adds controls for the firms’ characteristics; and the third consists of payments made by firms to newspapers.
5.1. Financial performance
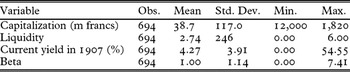
Financial data were gathered from the 1907–9 stock exchange yearbooks and from daily and monthly stock price bulletins. Data were collected on firms with equity traded in Paris, either on the official stock exchanges or on the coulisse (over the counter).Footnote 30 The (log of) market capitalization was computed by multiplying average equity prices and the number of outstanding shares. The current yield is the ratio of dividends paid in 1907 to the average stock price in 1907. Stock price volatility is proxied by the stock's beta, which is equal to (the log of) the ratio between the highest and lowest 1907 stock price divided by the market average. Thus, the market beta is equal to 1, and a beta value that exceeds 1 indicates higher-than-average volatility. As for liquidity, although newspapers mentioned that it varied among stocks (e.g. ‘stock A was actively traded yesterday’ while ‘there was not much demand for the stock of firm B’), there are no available data on the volume of transactions. Some stocks, moreover, were not (or were only irregularly) negotiated, in which case the official publications of the stock exchanges did not report a price for them.Footnote 31 Assuming that the existence of a price quote on a given day indicates that some transactions occurred, we construct an index for liquidity whereby a value of 1 denotes that the stock was quoted (and 0 that it was not). Six evenly spaced dates in June 1907 were chosen in order to minimize potential endogeneity problems (since news exposure can affect liquidity),Footnote 32 so this index ranges in value from 0 to 6. Table 3 summarizes the main descriptive statistics.
Summary statistics of financial variables

Source: Authors’ calculations.
5.2. Firm characteristics
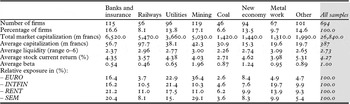
To account for legal differences in stocks trading on the two Parisian exchanges, we constructed a dummy variable bourse, which was set to 1 if a firm was listed on the official stock exchange and to 0 if it was on the coulisse. Companies were also classified according to the following seven sectors: banks and insurance; railways; utilities; mining (other than coal); coal; ‘new economy’ (i.e. chemical industry, electricity and carmakers); and metal work (typically steel). All other companies were aggregated into a category called ‘other’, which includes mainly printers, hotels and other tourism companies, and the food service industry. Table 4 reports the distribution of firms across sectors and shows that newspapers did not cover all sectors equally. Both EURO and SEM dedicated nearly a third of their stock review section to mining companies, whereas the other two periodicals devoted only a tenth.
Statistics on sectors and firms receiving media exposure

Source: Authors’ calculations.
Note: Relative exposure is the ratio of the number of mentions per sector to the total.
The sale of its stocks on the primary market is likely to have influenced the incentive of a company to pay for coverage. We identify these companies using the statistics published by Alfred Neymarck in Le Rentier (the dummy variable takes the value of 1 only if the company raised money on the market). In 1907, 60 companies sold securities on the official stock exchanges and 29 on the over-the-counter market. We used a dummy variable to account for the 209 firms that were registered outside France. Its purpose is to capture the costs that a French investor would have incurred to enforce his property rights in a foreign court of law, and the dummy specification is especially suitable if investors’ costs were mainly fixed. Finally, the dummy variable colony captures the effect of a firm operating in a colony, French or not (53 companies). The variable distance is measured between Paris and the capital of the country in which the firms operated their (main) business;Footnote 33 it was computed for non-French companies and for the 87 companies that operated outside the country in which they were registered (mostly France, the United Kingdom and Belgium). To account for the possible familiarity that investors had with a particular country, we (inversely) weighted the distance by the country share in the total capitalization of the listed companies.Footnote 34
5.3. Payments to newspapers
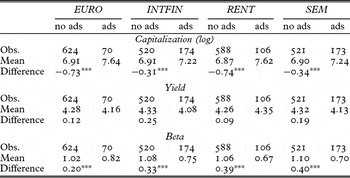
Advertisements. The advertisement section included commercial announcements of new products or services such as railway fares, insurance company policies, or the opening of a new branch by a given bank. Issuers of publicly traded securities also used this section as a medium to inform the wider public on financial news, such as the introduction of a new security or the scheduling of a shareholders’ meeting as well as to announce the serial numbers of bonds drawn at the lottery for reimbursement. Both types of advertisements were counted by company and aggregated. The regressions used two specifications for this variable, either the actual number of ads or a dummy (set to 1) if the company advertised in the newspaper. As shown in Table 5, companies that advertised exhibit, on average, a higher capitalization and a lower stock volatility than companies that did not advertise.
Advertising versus non-advertising companies

Source: Authors’ calculations.
Notes: N = 694 firms, two-sample t-test with unequal variances.
***Significant at the 99% level.
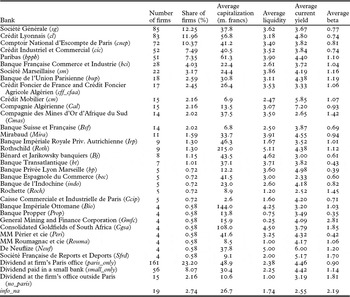
Réclames. Investment banks provided firms with several services, including financial advertisements, legal representation in France for foreign companies, and payment of coupons and dividends. Because financial yearbooks indicated which bank was appointed to pay a company's dividends and coupons, we were able to link banks and companies.Footnote 35Table 6 presents the group averages of financial variables for all companies sharing the same partner bank.Footnote 36 The largest group (18 per cent) consists of companies whose dividends were paid only at their Paris headquarters (aggregated in the dummy paris_only). Next are the three biggest deposit banks – Crédit Lyonnais, Société Générale and Comptoir National d'Escompte de Paris – each with a market share of 9–10 per cent. Another part of the market was shared among a handful of smaller investment banks with a market share of 1–6 per cent (for a total of 39 per cent of the firms). Banks that paid the dividend of fewer than three companies are aggregated in the dummy small_only. The regression also includes a dummy variable for companies that paid the dividend or coupon at their head office when it was located outside Paris (no_paris). The dummy info_na includes all companies for which the required information was not available in public sources.
Statistics per group of firms sharing the same investment bank

6. Results
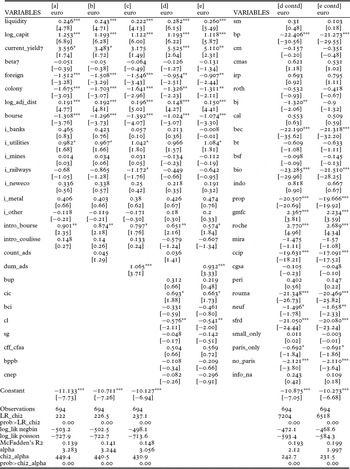
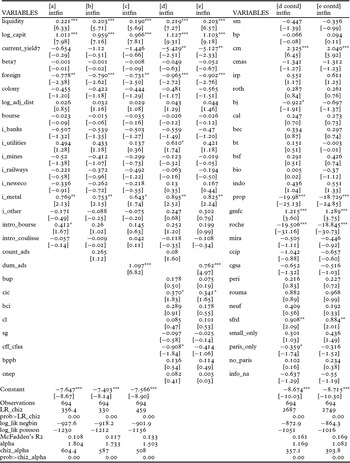
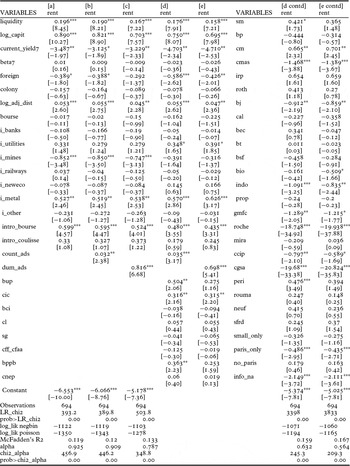
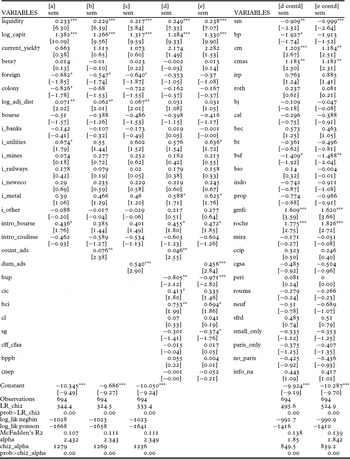
This section reviews the determinants of media exposure and quantifies the importance of the media bias. Tables A1–A4 in the Appendix give the regression results.Footnote 37
There is a positive correlation between increased coverage and increased capitalization and liquidity. The measure of stock price variance is never significant, which could indicate that newspapers did not target liquidity traders but rather investors with a buy-and-hold strategy (rentiers). The significance and/or sign of the other financial variables varies across newspapers, which suggests that different groups of readers were targeted. Whereas EURO promoted firms with relatively high current returns, both INTFIN and RENT featured those with lower returns. Two reasons can explain this. First, firms with a lower yield could also feature a lower default risk (not measured in this regression). Second, a lower return implies a higher price/dividend ratio, so INTFIN and RENT may have been focusing on ‘blue chip’ firms (i.e. those with high growth potential).Footnote 38EURO tended to prefer firms listed on the coulisse, whereas the other three newspapers did not discriminate in their coverage of the two markets. Moreover, a company selling new securities experienced a boost in its exposure (except in INTFIN). The coverage of sectors also differed across newspapers. But after controlling for firms’ characteristics and performance, we find that only a few sectors had coverage that differed significantly from those of the coal sector. INTFIN, RENT and SEM focused more on the metal industry than on other sectors, and RENT covered mining firms significantly less, which is doubtless related to its repeated claim that too many fly-by-night enterprises populated the mining industry for rentiers to hold a stake in them. Those varying degrees of exposure across and within newspapers may well have reflected editorial choices.
Firms incorporated domestically received more media exposure than those incorporated abroad. There are two coherent potential explanations for this: either foreign companies did not pay newspapers for write-ups of their activities; or investors were less willing to hold foreign stocks –because, for example, they entailed higher enforcement costs.Footnote 39 This is not to say that newspapers neglected the stocks of firms operating abroad but incorporated in France. With the exception of INTFIN, the sampled periodicals accommodated investors with more coverage on firms operating abroad than in France.
A newspaper's coverage could have been distorted either by the advertisements or by réclames. We next discuss the effect of sequentially including these variables in the regressions (columns [b] and [c]). There are only a few variables whose inclusion turns out to be insignificant. In the dummy specification, advertising expenses always increased coverage. When Ads is measured by the number of advertisements, it increased media exposure in all the newspapers except for EURO. But this count variable becomes significant even in EURO when any big advertiser (i.e. one with more than 5 per cent of a newspaper's ads) is excluded from the sample.Footnote 40
As shown in columns [d] and [e], the réclames tended to bias coverage towards particular subsets of firms. Of the 32 dummy variables constituting bank X, only a few turn out to be significantly positive. Independence mattered, as indicated by the positive significance of Crédit Mobilier (CM) in INTFIN. The companies linked to CM also received significantly more coverage in RENT and SEM than did other companies. It is notable that the dummies for Crédit Lyonnais, Société Générale and CNEP are never significantly positive; when combined with Billoret's (Reference Billoret1969, pp. 402–3) finding that the largest deposit banks were hugely involved in securities trading with small investors and depositors through their network of branches, this may indicate that those networks acted as a substitute for newspapers when they had to popularize a company's business.Footnote 41 As expected, companies linked to the traditional investment bankers (e.g. Neuflize, Mirabaud, Rothschild) did not seek to increase their exposure, since the business model of those banks did not require popularizing the companies in which they held stakes (Bonin Reference Bonin2000, pp. 26–30). Nonetheless, companies linked to the reputable investment bank Paribas received more exposure than the average company in the independent RENT but not in the other newspapers. Companies linked to the young BCI bank (created in 1901 by the former finance minister Rouvier) enjoyed more mentions than predicted by their performance in SEM, and the same holds also for companies linked to Crédit Industriel et Commercial (CIC) in EURO, SEM and RENT. Finally, coverage in EURO and SEM is positively associated with two banks that specialized in the mining industry, the GMFC and the Rochette group. The negative sign of the mining sector in RENT disappeared when we controlled for links with the Rochette group and GMFC.Footnote 42
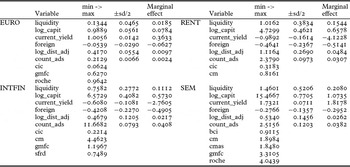
Two methods were used to gauge the impact on investors of biased editorial content: computing the marginal effect of the coefficient of the bank X dummies; and assessing whether this had a negative impact on investments by comparing observed and counterfactual portfolios. Table A5 in the Appendix shows the effect on predicted media exposure of the variation in each determinant of coverage. The predicted change in the number of write-ups in EURO would increase by a factor of 0.008 if the number of ads were to increase by half a standard deviation (i.e. 1.39 ads), holding all the other variables at their mean. The number of write-ups would actually increase by a factor of 0.228 if a company increased its number of ads from none to 40 (the maximum). Similarly, if the average firm increased the number of its ads in INTFIN by half a standard deviation (or 0.98 ads), then its exposure would increase by a factor of 0.09, a marginal effect that is 12 times greater than that in the other newspapers.
We also look at the financial performance derived from the observed coverage and compare it to counterfactual coverage, the case where firms purchase no advertising and no réclames.Footnote 43 Alternative asset allocations are assessed by assuming that investors were guided by a newspaper's content when selecting their portfolios. Five portfolios were constructed using the following weights:
1. the firm's actual number of write-ups (portfolios are denoted e for EURO, i for INTFIN, r for RENT, and s for SEM);
2. its positive write-ups (portfolios denoted e+, i+, r+, s+);
3. counterfactual write-ups, purging for the impact of advertising on coverage (e1, i1, r1, s1);
4. counterfactual write-ups, purging for the impact of réclames on coverage (e2, i2, r2, s2);
5. counterfactual write-ups, purging for the impact of both advertisings and réclames on coverage (e3, i3, r3, s3).
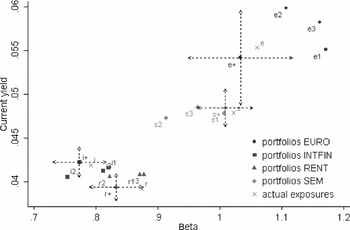
The positive news portfolio is the benchmark against which counterfactual portfolios are compared. Figure 4 plots the different combinations of stock price variance and current yield (which serve as proxies for risk and return) of these portfolios. The graph allows us to assess the performance of these portfolios along two dimensions: across newspapers and within each newspaper.
Performance of actual and counterfactual portfolios (arrows indicate 95 per cent C.I.)
Source: Authors’ calculations.

A comparison of the portfolios across newspapers shows that the performance of newspapers varied significantly. The ranking of positive portfolios was consistent with that predicted by the mean-variance theory. RENT favoured stocks with a lower return, but also with a lower risk, than those favoured by EURO and SEM. However, the RENT portfolio had lower returns than that of INTFIN, and the EURO portfolio had about the same level of risk but a much higher average return than that of SEM. It therefore seems that INTFIN and RENT targeted more risk-averse investors while EURO, in contrast, targeted risk-seeking readers. Because readers’ preferences regarding risk are not observable, the results reported here might well reflect the market's segmentation in terms of the degree of risk aversion. However, we can safely draw the following conclusions: the portfolios of independent newspapers did not perform better than those of bank-owned newspapers, as shown by the comparison between RENT and INTFIN.
The effect of payments on the performance of the portfolios varied from one newspaper to another. In EURO, removing the bias induced by payments significantly increased the portfolio's return but also increased its risk (points e1, e2 and e3 in Figure 4). The effect is similar in RENT for portfolios r1 and r3 and in INTFIN for i1 and i3. In SEM, however, removing the impact of hidden payments on coverage (portfolio s2) significantly lowered the measure of risk and the average yield. This means that payments could be associated with two opposite effects, depending on the newspaper. In EURO, RENT, and INTFIN, payments lowered the risk and increased the return; the reverse was true in SEM.
As a robustness check, we computed the same type of portfolios after excluding the biggest advertisers (those accounting for more than 5 per cent of any newspaper's ad budget) from the sample. In these regressions, only the counterfactual portfolios of EURO and s2 of SEM remain significantly different from the benchmark, while the others fall within the confidence interval. This suggests that, on average and except for the biggest payers, newspapers accepted payments from companies whose performance did not negatively affect investors.Footnote 44 In a nutshell, it seems that payments affected the coverage of individual companies but not the overall performance of newspapers’ coverage. Hence, although firms had incentives to make payments, readers could have decided to discount their impact. Newspapers then reconciled the importance of deriving revenue from companies with the need to keep readers on board.
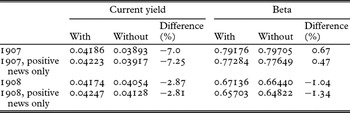
Finally, we check whether readers of INTFIN were hurt by the influence of its owner, Crédit Mobilier (see Table 7). To this end, we remark that if payments were used to swindle readers, then one should expect that INTFIN (1) pooled well-performing firms (not linked to CM) with poor-performing firms linked to CM and (2) biased its coverage towards the firms linked to CM. If this is true, then the difference between the return of the portfolio with CM firms and the one without them must be positive. Consistently with the coefficient of the interaction variable, our computations show that firms linked to CM increased the return of the portfolio by 7 per cent in 1907. This suggests that INTFIN cared about its reputation and chose to highlight, among firms linked to Crédit Mobilier, only those with good performance.
Yield and risk of the INTFIN portfolio with and without companies linked to Crédit Mobilier

Source: Authors’ calculations.
7. Conclusion
This article has provided quantitative evidence on how four financial newspapers chose the information they published on listed firms in early twentieth-century France. It shows that editors used various financial criteria when choosing companies, thereby competing for readers along various dimensions. The results also show that the media were biased towards particular subsets of companies but that there was no negative effect on their readers. Moreover, we have shown that independent newspapers were not the holy grail of unbiased information, because bank-owned newspapers did not underperform when compared to their independent counterparts. This stands in sharp contrast to the judgment of many observers writing at the time. The results also suggest that the newspaper market was segmented between risk-averse and risk-seeking investors and that the selection of firms that were covered in the media varied according to a publication's targeted readership. The increasing effort to digitize newspapers’ content will allow future research to broaden the sample of newspapers tested and hence to assess the extent to which our results can be generalized.
Although each result is not surprising in itself, the broader conclusions that they suggest are that the importance of media bias was clearly overemphasized in the historical literature and that the dissemination of information on listed companies must have contributed to the development of financial markets. However, the payments to newspapers might have had a negative impact on the French economy because of the transaction costs they imposed on listed firms. In particular, and as in the literature on corruption, small players (i.e. those unable to afford the numerous intermediaries involved) certainly suffered from the peculiarities of the process by which information made its way into the newspapers. We leave to future research the estimation of this possible impact of media bias on the stock market's overall performance.
Acknowledgments
We are grateful for the suggestions and remarks of the participants of seminars at Rutgers University, UC Berkeley, UCLA, the University of Paris Ouest Nanterre – EconomiX, and the University of Orléans – LEO as well as those of the 1st Euroclio Conference in Paris, the 10th European School of New Institutional Economics in Cargese, the 28th APHES in Guimarães, and the 2009 meeting of the French Finance Association in Brest. We are especially grateful to Régis Breton and Marc Flandreau for many discussions and comments. We also thank the editors, two referees, and Olivier Accominotti, Sara Bertin, Rui Esteves, Norbert Gaillard, George Gallais-Hamonno, John Landon-Lane, John Nye, Yannick Perez, Christian Rietsch, Jean-Laurent Rosenthal, Camila VamMalle, Anne-Gael Vaubourg and Eugen White for their comments and insights. We thank Jin-Zhao Chen, David Le Bris, Ludovic Moreau and Angelo Riva for sharing and helping us find useful data. Vincent Bignon acknowledges the support of the Mercatus Center at George Mason University while working on a version of this paper. A substantial part of the paper was completed while Antonio Miscio was at LEO – University of Orléans. This paper was supported by a funding from Agence Nationale de la Recherche, project 05-JCJC-0225. The usual disclaimer applies.
Appendix
Negative binomial regressions when the dependent variable is exposures in EURO

Robust z-statistics in brackets. *** p < 0.01, ** p < 0.05, * p < 0.1.
Negative binomial regressions when the dependent variable is exposures in INTFIN

Robust z-statistics in brackets. *** p < 0.01, ** p < 0.05, * p < 0.1.
Negative binomial regressions when the dependent variable is exposures in RENT

Robust z-statistics in brackets. *** p < 0.01, ** p < 0.05, * p < 0.1.
Negative binomial regressions when the dependent variable is exposures in SEM

Robust z-statistics in brackets. *** p < 0.01, ** p < 0.05, * p < 0.1.
Predicted change for selected variables based on regression [d] of the respective newspaper