

Noroviruses (NVs) are small (38 nm), round, non-enveloped viruses containing a single-stranded, positive-sense RNA genome of ∼7.7 kb that belong to one of the four genera in the family Caliciviridae (Ref. Reference Green1). NVs were previously called ‘Norwalk-like viruses’ from the prototype Norwalk virus that was discovered in an outbreak of acute gastroenteritis in an elementary school in Norwalk, Ohio in 1968 (Refs Reference Adler and Zickl2, Reference Dolin3, Reference Dolin4, Reference Kapikian5) and ‘small round structured viruses’ (SRSVs) owing to their common appearance under the electron microscope (Ref. Reference Kapikian, Estes, Chanock and Fields6). According to genomic sequence similarity and phylogenetic relationships, the NV genus contains over 30 genetic types that are grouped into five genogroups, in which genogroups I, II and IV infect humans, and genogroups III and V infect animals (Ref. Reference Zheng7).
Human NVs cause acute gastroenteritis within two to three days of infection, with symptoms of watery diarrhoea, vomiting, nausea, abdomen cramp, malaise and fever (Refs Reference Kapikian, Estes, Chanock and Fields6, Reference Parrino8, Reference Thornhill9, Reference Wyatt10). Although NV disease is normally mild and self-limited, particularly severe illness has been observed in the elderly, infants and immunocompromised patients (Refs Reference Gallimore11, Reference Kaufman12, Reference Simon13, Reference Mattner14, Reference Jiang15, Reference Green16, Reference Tsugawa17). The viruses are transmitted by the oral–faecal route by person-to-person contact. NVs are highly contagious and can also be spread by environmental surface contact or by contaminated water or food. They often cause major outbreaks in a variety of settings, including schools, childcare centres, nursing homes for the elderly, hospitals, restaurants, cruise ships, military troops and large battleships (Refs Reference Simon13, Reference Isakbaeva18, Reference Isakbaeva19, Reference Koopmans20, Reference Morioka21, Reference Papadopoulos22, Reference Podewils23, Reference Sistrom and Hale24, Reference Takkinen25, Reference Thornton, Jennings-Conklin and McCormick26, Reference Tseng27, Reference Vainio and Myrmel28, Reference Waters29, Reference Greenberg30). NVs do not promote persistent immunity following a natural infection and the disease affects people of all ages (Refs Reference Kapikian, Estes, Chanock and Fields6, Reference Parrino8, Reference Wyatt10, Reference Greenberg30, Reference Kapikian, Yolken, Greenberg, Lennette and Schmidt31, Reference Black32, Reference Ryder33). Because of these features, NVs have been recognised as the most important pathogen of non-bacterial gastroenteritis epidemics in both developed and developing countries. So far, there is no effective treatment or intervention for NV infection.
Molecular approaches for studying NV–host interaction
Human NVs have been difficult to study owing to the lack of an efficient cell culture or an animal model. The recently reported organoid model of human small intestinal epithelium (Ref. Reference Straub34) and the gnotobiotic pig model (Ref. Reference Cheetham35) for human norovirus replication may serve as useful tools to study human NVs, but the viral replication remains low and the clinical manifestations remain to be defined. Thus, additional research may be necessary before these models become useful for studies of human NVs. The molecular cloning of the Norwalk virus in 1990 (Ref. Reference Jiang36) and subsequently of many other strains (Refs Reference Matson37, Reference Matson38, Reference Lew39, Reference Lew40, Reference Lew41, Reference Lambden42, Reference Jiang43) has greatly facilitated NV research. One of the most important advances was the development of recombinant NV capsid proteins using the baculovirus system (Refs Reference Jiang44, Reference Jiang45, Reference Jiang46). The baculovirus-expressed NV capsid proteins spontaneously form virus-like particles (VLPs) that are structurally and antigenically similar to the authentic viruses (Refs Reference Jiang45, Reference Green47, Reference White48), providing valuable materials for development of diagnostic assays in studies of the virology, immunology and host–pathogen interaction of NVs.
One important application of recombinant NV VLPs is to study the host–pathogen interaction using the VLPs as probes that can be detected using antibodies or specific labelling of NV VLPs. A number of studies have been described, including: (Reference Green1) the discovery of NVs recognising human histo-blood group antigens (HBGAs) as receptors (Refs Reference Marionneau49, Reference Hutson50, Reference Huang51, Reference Huang52, Reference Harrington53, Reference Harrington54); (Reference Adler and Zickl2) the demonstration of specific penetration of Norwalk virus VLPs into human Caco-2 cells following an attachment of the VLPs to the cell surface (Ref. Reference White48); (Reference Dolin3) the identification of a 105 kDa membrane protein from Caco-2 and other cell lines, which may be a ligand for NV binding to host cells (Ref. Reference Tamura55); (Reference Dolin4) the observation that heparan sulphate interacts with NV VLPs (Ref. Reference Tamura56). This review will concentrate on the interaction between human HBGA receptors and NVs – a relationship that has led to a major breakthrough in NV research and impacted significantly on the epidemiology, virology, immunology, pathogenesis and evolution of NVs, and has provided a new strategy for disease control and prevention.
The study of HBGA receptors was initiated following a study on the rabbit haemorrhagic disease virus (RHDV) – an animal calicivirus that recognises the H type 2 HBGAs (Ref. Reference Ruvoen-Clouet57). Similar studies were then performed on the prototype Norwalk virus. The Norwalk VLPs were found to bind to the HBGAs in saliva and intestinal tissues of secretors but not of non-secretors (Ref. Reference Marionneau49). The association of secretor status with the clinical infection of Norwalk virus was shown by human volunteer studies (Refs Reference Lindesmith58, Reference Hutson59, Reference Hutson60), in which individuals who are non-secretors were naturally resistant to the challenging viruses.
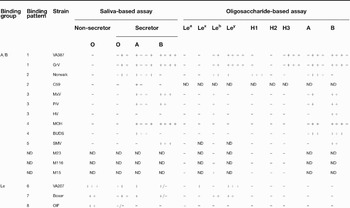
The studies then were extended to other NVs representing different genetic types and it was found that NVs are highly diverse in their recognition of the polymorphic human HBGAs (Refs Reference Huang51, Reference Huang52, Reference Harrington53, Reference Harrington54). Eight receptor-binding patterns have been described (Table 1) (Refs Reference Huang51, Reference Huang52, Reference Harrington53, Reference Harrington54, Reference Tan and Jiang61). The association of NV infection with HBGA types has also been demonstrated by outbreak investigations and antibody prevalence against certain types of NVs (Refs Reference Rockx62, Reference Fretz63, Reference Meyer64, Reference Hennessy65, Reference Dai66). In addition, the HBGAs in human milk were also found to block NVs from binding to their receptors (Refs Reference Morrow67, Reference Marionneau68, Reference Jiang69, Reference Ruvoen-Clouet70), suggesting that the milk HBGAs could serve as a potential decoy receptor in the protection of infants from NV infection. Finally, the structure and function of NV capsids was studied by atomic structure determination, computer-based homologous modelling and site-directed mutagenesis (Refs Reference Chakravarty71, Reference Prasad72, Reference Prasad73, Reference Tan, Meller and Jiang74, Reference Tan and Jiang75, Reference Tan76, Reference Tan, Hegde and Jiang77). Significant information on the capsid structure and the receptor-binding interface of NVs has now accumulated.
Binding of norovirus recombinant virus-like particles with human histo-blood group antigens of saliva and of synthetic oligosaccharide conjugatesFootnote a

aAll results are described by Huang et al. (Refs Reference Huang51, Reference Huang52) except for those of SMV, M23, M116 and M15, which were described by Harrington et al. (Ref. Reference Harrington54). Owing to unknown binding activities with the A and B antigens, the binding patterns of strains M23, M116 and M15 were not assigned. Reactivity was scored from strongest (++ + + ) to completely negative (–). ND, not determined. Adapted, with permission, from Ref. 61 (© 2005 Elsevier).
Polymorphism of the human HBGA system
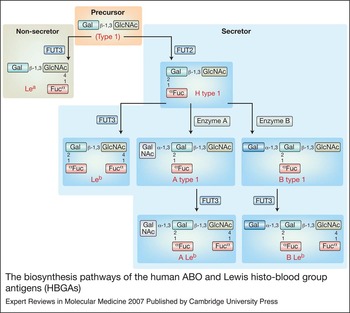
HBGAs are complex carbohydrates present at the outermost part of N- or O-linked glycans of many glycoproteins or glycolipids on the surfaces of red blood cells and mucosal epithelia of the respiratory, genitourinary and digestive tracts (Refs Reference Le Pendu78, Reference Ravn and Dabelsteen79). They are also present as free oligosaccharides in biological fluids, such as saliva, intestinal contents, milk and blood. The synthesis of HBGA starts with a disaccharide precursor by sequential addition of a monosaccharide. Each step of the synthesis is catalysed by a glycosyltransferase with specific substrates and linkages (Fig. 1).
The biosynthesis pathways of the human ABO and Lewis histo-blood group antigens (HBGAs). The synthesis of HBGA based on the type 1 precursor starts with a disaccharide precursor by the sequential addition of a monosaccharide. Each step of the synthesis is catalysed by a glycosyltransferase with specific substrates and linkages. FUT3, an α-1,3- or α-1,4-fucosyltransferase, is responsible for addition of a fucose residue to the disaccharide precursor at an α-1,3 or α-1,4 linkage, resulting in a trisaccharide called Lewis a (Lea). FUT2, another fucosyltransferase, adds a fucose residue to the disaccharide precursor at an α-1,2 linkage, producing a trisaccharide named H type 1. The FUT2 phenotypes are called secretor or secretor positive, whereas the FUT2-inactivating phenotypes are non-secretor or secretor negative. Further addition of another fucose residue to the H type 1 antigens by the FUT3 enzyme results in a tetrasaccharide antigen Lewis b (Leb). Enzymes A and B are glycosyltransferases that add an N-acetylgalactosamine or a galactose at α-1,3 linkage of the H type 1 to produce the tetrasaccharide A type 1 and B type 1, respectively. These two antigens may be further developed into the pentasaccharide A and B antigens (ALeb and BLeb), respectively, by the addition of a fucose catalysed by the α-1,3/4-fucosyltransferase (FUT3). The entire pathways can occur on a type 2 precursor. The corresponding products Lea and Leb in type 1 are Lex and Ley for type 2, respectively. Abbreviations: Enzyme A, N-acetylgalactosamine transferase; enzyme B, galactosyltransferase; Fuc, l-fucose; FUT2, α-1,2-fucosyltransferase; FUT3, α-1,3/4-fucosyltransferase; Gal, d-galactose; GalNAc, N-acetylgalactosamine; GlcNAc, N-acetylglucosamine. Adapted, with permission, from Ref. 61 (© 2005 Elsevier).

The Lewis gene (FUT3) encodes α-1,3- or α-1,4-fucosyltransferases that are responsible for the addition of a fucose residue to the disaccharide precursor at an α-1,3 or α-1,4 linkage. This step results in a trisaccharide called Lewis a (Lea) or Lewis x (Lex) antigens depending on the type of precursor (type 1 or type 2, respectively). The secretor gene (FUT2) encodes another fucosyltransferase that adds a fucose to the disaccharide precursor at an α-1,2 linkage. The resulting trisaccharides are called H type 1 or H type 2 depending on the type of precursor. Further addition of another fucose residue to the H type 1 or H type 2 antigens by the FUT3 enzyme results in a tetrasaccharide antigen called Lewis b (Leb) and Lewis y (Ley), respectively.
Yet another fucosyltransferase-encoding gene (FUT1) encodes an enzyme with the same function as FUT2 fucosyltransferase, but the enzyme is mainly distributed in the bloodstream. To differentiate these two genes, the FUT1 gene is called the H gene, whereas the FUT2 is called a secretor gene. The FUT2 phenotypes are called secretors or secretor positive, and the FUT2-inactivating phenotypes are called non-secretors or secretor negative. The gene products of the A and B alleles at the ABO locus are glycosyltransferases that add an N-acetylgalactosamine or a galactose at α-1,3 linkage of the H type 1 or H type 2 trisaccharides to produce the tetrasaccharide A type 1/2 and B type 1/2, respectively. These two antigens may further develop into the pentasaccharide A and B antigens (ALeb/y and BLeb/y), respectively, which are catalysed by the α-1,3/4-fucosyltransferase (Fig. 1).
Each of the ABO, Lewis and secretor gene families contains silent alleles, leading to null phenotypes of the loci. For example, the FUT2-inactivating mutations are responsible for the non-secretor phenotype found in about 20% of European and North American populations. The non-secretor phenotype is characterised by the absence of ABH antigens in saliva and on most epithelial cells of the respiratory, genitourinary and digestive tracts. Similarly, a silent FUT3 gene is found in about 10% of the same populations (Ref. Reference Marionneau80). A recessive FUT1 gene that is responsible for the H types of the ABH families is rare; one example is the ‘Bombay’ type that occurs at an extremely low frequency in the range of 10−5 to 10−6 (Ref. Reference Marionneau80). By contrast, inactivating mutations of the ABO family are common and have a wide variation among different populations and races (Ref. Reference Le Pendu78). Because of the epistatic nature of human HBGA synthesis, the HBGA phenotypes of the human population are polymorphic and complicated.
Diversity of NVs recognising human HBGA receptors
NVs are also highly diverse in their recognition of human HBGA receptors. Using a panel of well-characterised saliva samples representing different blood types, Huang et al. (Refs Reference Huang51, Reference Huang52) described seven receptor-binding patterns of NVs according to the ABO, Lewis and secretor types of the saliva donors (Table 1). A similar study by Harrington et al. described one additional binding pattern (Refs Reference Harrington53, Reference Harrington54). In addition, two strains (VA115 and Desert shield virus, DSV) did not bind to any tested human HBGAs (Ref. Reference Huang51). Thus, at least eight receptor-binding patterns of NV recognising human HBGA exist and molecules on the cell surface other than HBGAs might also serve as receptors for some NV strains. Similar binding results also were obtained using recombinant NV VLPs generated from a VEE vector (Ref. Reference Harrington54) and by expression of the P domain of the capsid in Escherichia coli (Refs Reference Tan and Jiang75, Reference Tan, Hegde and Jiang77, Reference Tan81).
The saliva-based results have been confirmed by binding and blocking assays using synthetic HBGA oligosaccharide analogues (Ref. Reference Huang51) (Table 1). For example, the prototype Norwalk virus binds to saliva of types A and O but not type B secretors and non-secretors; it binds synthetic type A, Leb, Ley, H-1 and H-3, which are the expected HBGA products of type A and O secretors, but it does not bind type B oligosaccharides (Ref. Reference Huang51). Strain VA387 binds to A, B and O secretor but not non-secretors and it recognises synthetic A, B, Leb, Ley, H-1 and H-3 but not Lea and Lex. Strains recognising only the A and B, or either A or B saliva, have also been confirmed. In addition, three Lewis binders [VA207, Boxer and OIF (operation of Iraqi freedom)] bind to the saliva of both non-secretors and secretors with variable affinity (Ref. Reference Huang51). They show variable binding activities with synthetic Lewis oligosaccharide: OIF reacted with Lea, VA207 with Lex and Ley, and Boxer with Leb and Ley, but none of the three strains recognises the A or B oligosaccharides (Refs Reference Huang51, Reference Tan and Jiang61).
The NV receptor-binding specificities listed above were confirmed by other methods, such as blocking of the binding by human milk, monoclonal antibodies specific to human HBGAs, haemagglutination assays, or removal of the binding by treatment with specific glycosidases (Refs Reference Marionneau49, Reference Hutson50, Reference Huang51, Reference Huang52, Reference Harrington53, Reference Harrington54). The involvement of specific epitopes of human HBGAs in NV binding was also shown by the binding of NV VLPs to Chinese hamster ovary (CHO) cells transfected with a specific glycosyltransferase cDNA (Ref. Reference Marionneau49).
Minor variations in results from different assays have also been noted (Ref. Reference Huang51). For example, strain Hawaii virus (HV), which did not bind to any HBGAs in saliva-binding assays, reacted with synthetic A, B and Leb antigens (Table 1). Similarly, BUDS reacted with both synthetic A and B antigens, but bound only to type A saliva (Ref. Reference Huang51). In addition, Paris island virus (PiV), Mexico virus (MxV) and HV did not bind to type O saliva, but all three strains bound to synthetic Leb antigen (Refs Reference Huang51, Reference Tan and Jiang61). These extra binding activities are dose-dependent and reproducible. Furthermore, the receptor binding activity seems to be sensitive to certain host factors. For example, addition of stool extracts resulted in a significant increase of binding of some NV strains to human saliva (Ref. Reference Harrington53). In a separate study, Snow mountain virus (SMV) was found to bind the type B antigen but a human volunteer challenge study failed to provide a full correlation of the binding pattern with the clinical infection (Ref. Reference Lindesmith82). Therefore, future studies for better understanding of NV–HBGA interaction by addressing these variations are necessary.
A model of NV–HBGA interaction
The observed binding patterns can therefore be sorted into two groups: the A/B and the Lewis (non-secretor) binding groups (Ref. Reference Huang51). All strains in the A/B binding groups, including VA387, Grimsby virus (GrV), Norwalk virus, C59, MOH, PiV, MxV, BUDS, HV and SMV, bind to types A and/or B and O saliva of secretors but not to saliva of non-secretors (Table 1). By contrast, all strains in the Lewis binding group (VA207, Boxer and OIF) bind to HBGAs of non-secretors and type O secretors with weak or no binding to the types A and B secretors. These weak binding activities of the Lewis binding strains to the A and B type saliva are not due to the A and B epitopes, as they do not react with the A or B oligosaccharides (Table 1). Instead, they most probably bind to the Lewis or H epitopes on the precursor molecules of the A or B antigens in these individuals.
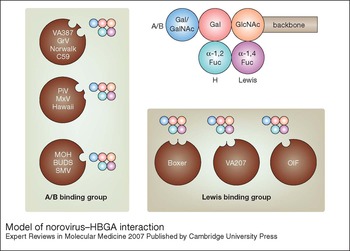
To elucidate the relationship of the two binding groups, a model of NV–HBGA interaction has been proposed (Refs Reference Huang51, Reference Tan and Jiang61) (Fig. 2). This model assumes that the capsid protein of each strain has one type of binding interface that accommodates one or two epitopes of the three major HBGAs (A/B, H, or Lewis). Each epitope can bind to the interface independently, whereas an involvement of both epitopes in binding may result in broadening the host specificity of the strains. For example, all strains in the A/B binding group have a common site for the A/B epitopes, whereas strains VA387, GrV and Norwalk virus have an additional site for the H epitope, and these strains apparently have a broader host range than those strains with only one binding site to the A/B epitopes, such as MOH, BUDS and SMV.
Model of norovirus–HBGA interaction. This model is proposed based on the classification of two binding groups of norovirus (NV) to human histo-blood group antigens (HBGAs): the A/B binding group and the Lewis binding group. The five-circle structure represents a pentasaccharide as the final product (ALeb or BLeb) of human HBGAs. The three major epitopes (A/B, H and Lewis) and the backbone are indicated. Thirteen NV strains are indicated according to their relative interaction levels with the A/B, H and Lewis epitopes (see Table 1). The potential binding sites for each of the three major HBGA epitopes on the capsid are indicated. This model assumes that the capsid protein of each strain has one binding interface that accommodates one or two epitopes of the three major HBGAs (A/B, H or Lewis). Each epitope can bind to the interface independently, whereas involvement of both epitopes in binding may broaden the host specificity of a strain. Thus, all strains in the A/B binding group have a common site for the A/B epitopes, and some strains have an additional site for the H epitopes. In the Lewis binding group, all strains have a binding site for the Lewis epitopes and some strains have an additional site for the H epitopes. Adapted, with permission, from Ref. 51 (© 2005 American Society for Microbiology).

In the Lewis binding group, Boxer and VA207 may have two binding sites, one each for the Lewis and H epitopes, whereas OIF may have one site for the Lewis epitope only. These strains do not recognise the A and B epitopes; instead, the presence of the A/B epitopes may have a negative effect (epitope masking) on the binding of these strains to the Lewis and H epitopes. This could be explained by the relatively lower binding activities of the Lewis binding strains with type A and B saliva compared with that of saliva from non-secretors and type O secretors (Table 1), in which the binding could result from precursor molecules such as Lea/x or Leb/y before they become mature A and B antigens, respectively (Fig. 1). This epitope-masking effect was most apparent in strain VA207, in which the VLPs revealed a typical ‘three-step-interaction’ profile that showed the strongest binding with saliva of the non-secretors, intermediate binding with saliva of the type O secretors and the lowest binding with saliva of type A and B secretors (Table 1). In the case of Boxer, the H epitope may play a more important role, but the A/B masking effect still exists. Compared with the binding profiles of all three Lewis binding strains, the masking effect of the B epitope seems stronger, as none of them binds saliva of type B secretors.
Viral structure related to host interaction
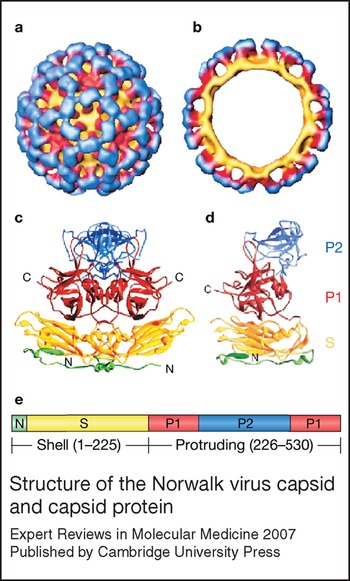
The crystal structure of the recombinant Norwalk virus VLP exhibits a T = 3 icosahedral symmetry, which is composed of 180 capsid protein monomers organised into 90 dimers (Ref. Reference Prasad72) (Fig. 3). Structural studies of other NVs, as well as other caliciviruses by crystallography or cryo-electron microscopy (cryo-EM) confirmed this basic structure of caliciviruses (Refs Reference Chen83, Reference Chen84). Each capsid protein can be divided into two major domains – the N-terminal shell (S) and the C-terminal protruding (P) domains – linked by a flexible hinge. The S domain folds into an eight-stranded antiparallel β-sandwich structure and constitutes the interior continuous shell, whereas the P domain, which is rich in β-strand arrangement, builds up the arch-shaped protrusions emanating from the shell. The extensive dimeric interaction of the P domains increases the stability of the NV capsid (Ref. Reference Prasad72).
Structure of the Norwalk virus capsid and capsid protein. (a, b) The recombinant Norwalk virus-like particle (VLP) structure has been solved by cryo-EM reconstruction and by X-ray crystallography (a, surface representation; b, cross-section). (c) The VLP contains 90 dimers of capsid protein assembled in T = 3 icosahedral symmetry. (d) Each monomeric capsid protein is divided into an N-terminal arm region (green) facing the interior of the VLP, a shell (S) domain (yellow) that forms the continuous surface of the VLP, and a protruding (P) domain that build up the arch-like structure emanating from the S domain surface. The P domain is further divided into two subdomains – P1 and P2 (red and blue, respectively) – with the P2 at the outmost surface of the VLPs. (e) The linear structure of the capsid protein is shown with the same colour theme. Adapted, with permission, from Ref. 134 (© 2004 Elsevier).

The S and P domains of the NV capsid protein can be structurally and functionally independent. In the absence of the P domain, the S domain self-assembles into small icosahedral particles with a smooth surface (Refs Reference Tan, Hegde and Jiang77, Reference Bertolotti-Ciarlet85). Expression of the P domain with or without the hinge forms a P dimer and/or P particle that binds to HBGA receptors (Refs Reference Tan, Meller and Jiang74, Reference Tan and Jiang75, Reference Tan, Hegde and Jiang77). A recent study using differential scanning calorimetry (DSC) also revealed that the two domains unfold independently in a pH-dependent manner (Ref. Reference Ausar86). In addition, digestion of capsid protein by trypsin destroys the S domain, leaving the majority of the P domain intact (Ref. Reference Tan, Meller and Jiang74). A similar proteolytic process may also occur in vivo because large quantities of soluble P proteins have been found in stools of NV-infected patients (Refs Reference Tan, Meller and Jiang74, Reference Greenberg87, Reference Hardy88). These data suggest that the two domains of NV capsids are not only functionally different but are also processed independently in vivo.
The receptor-binding interface in the P domain
The NV P domain can be further divided into two subdomains – P1 and P2 – which correspond to the leg and the head, respectively, of the arch structure of the P dimer (Fig. 3). The P2 subdomain forms the outermost surface of the capsid and contains the most variable sequences, further indicating its importance in viral–receptor interaction and host immune response. Direct evidence of a role of the P domain in receptor binding was derived from expression of the S and P domains separately followed by the demonstration of receptor-binding activities in the P protein only (Refs Reference Tan and Jiang75, Reference Tan, Hegde and Jiang77). Chimaeric mutant capsids in which the S and P domains are from different parent strains with different receptor-binding patterns confirmed this conclusion (Ref. Reference Tan, Hegde and Jiang77). In addition, both site-directed mutagenesis and monoclonal-antibody-based blocking assays also supported the participation of the P2 subdomain in binding to HBGA receptors (Refs Reference Tan76, Reference Lochridge89).
Mapping of the receptor-binding region to the P domain greatly facilitated the structural and functional analysis of NVs. The recombinant P domain forms dimers or P particles which are very easily produced in E. coli (Refs Reference Tan, Meller and Jiang74, Reference Tan and Jiang75, Reference Tan, Hegde and Jiang77), whereas NV VLPs can be made only in eukaryotic expression systems, which are time consuming and inefficient. Cryo-EM also demonstrated that the P2 subdomain of the P particle was fully exposed, similarly to that in VLPs (W. Jiang and X. Jiang, unpublished). Most importantly, receptor-binding assays indicated that the P dimers and the P particles retained authentic receptor-binding function (Refs Reference Tan, Meller and Jiang74, Reference Tan and Jiang75, Reference Tan, Hegde and Jiang77); thus they serve as excellent material for studying the host–pathogen interaction and viral receptors of NV. In addition, the NV P proteins expressed in E. coli revealed authentic antigenicity (M. Tan and X. Jiang, unpublished) and have also been considered valuable for the development of diagnostic methods and an NV vaccine.
Multiple interaction networks between NVs and HBGAs
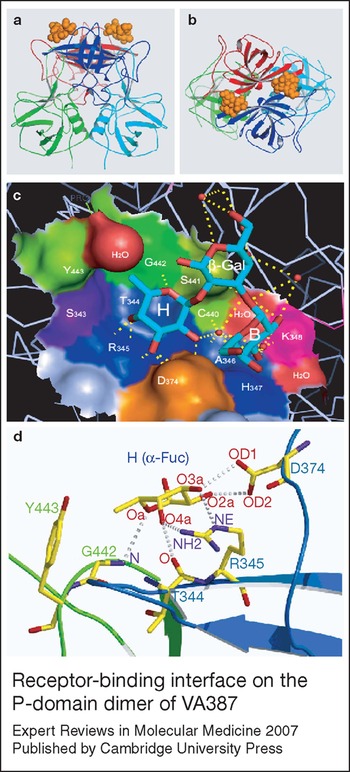
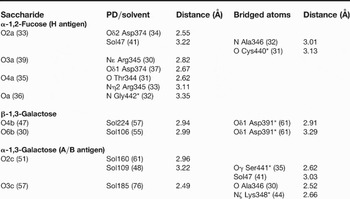
A high-resolution (2.0 Å) crystal structure of VA387 P-domain dimer complexed with HBGA oligosaccharide has been elucidated recently that revealed the receptor-binding interface lying at the outmost end of the P dimer (Fig. 4) (Ref. Reference Cao90). Extensive hydrogen-bond networks between the capsid and the saccharide ligands have been predicted based on the electron density map. One of the major side-chains of the receptor ligands, the α-1,2-fucose (the H epitope, see Fig. 2), interacted strongly with an open cavity in the receptor-binding interface that is composed of three components: (Reference Green1) Ser343, Thr344 and Arg345 on a protruded β-strand from the β-barrel forming the bottom of the cavity; (Reference Adler and Zickl2) Asp374 in a long loop from the same monomer, forming a wall of the cavity; and (Reference Dolin3) Ser441, Gly442 and Tyr443 of another loop extending from the P1 subdomain of the other monomer forming another wall of the cavity (Fig. 4). The A and B epitopes (N-acetylgalactosamine and galactose, respectively) most likely interact with Ala346, Lys348 and Ser441 (Table 2) (Ref. Reference Cao90). A further interacting site for the β-1,3-galactose ring next to the A and B epitopes is located at Asp391 (Table 2), which might further enhance the binding affinity to the receptor ligands. The receptor-binding interface is found at the dimerisation interface of the P dimers, indicating that dimerisation of the P domain is not only important for capsid formation but also is essential for receptor-binding function.
Receptor-binding interface on the P-domain dimer of VA387. The side (a) and top (b) views of the crystal structure of the P dimer (ribbon diagram) with indication of the B trisaccharide (sphere model, orange) binding on the outmost surface of the P dimer. Green (P1) and red (P2) represent one P domain monomer; cyan (P1) and blue (P2) represent the other P monomer. (c) A close-up of the receptor-binding interface. The open cavity of the binding interface is shown in surface representation with indication of the amino acid components. Blue, S343-H347; pink, K348; orange, D374; green, C440-Y443; red, water molecules. The B-trisaccharide is shown by ball-and-sticks with the oxygen and carbon atoms colored red and cyan, respectively. H, B, and β-Gal indicate the H epitope (α-1,2-fucose), B epitope (α-1,3 galactose), and β-1,3 galactose of the B-trisaccharide, respectively. The predicted hydrogen bonds are indicated by yellow dashed lines. (d) A close-up of hydrogen-bonding network between the α-1,2 fucose ring (H epitope) and the P dimer. The fucose ring and residues involved in interaction are shown by a ball-and-stick representation, with nitrogen, oxygen, and carbon atoms colored purple, red and yellow, respectively. The dotted lines indicate hydrogen bonds. Backbones of the two monomers of the P dimer are shown in blue and green ribbons, respectively. a–c were made by PyMOL (DeLano Scientific LLC) using the PDB file 2OBT (www.pdb.org). The structure in d is adapted, with permission, from Ref. 90 (© 2007 The American Society for Microbiology).

Hydrogen bond network between B-trisaccharide and P-domain dimerFootnote a

aA 3.3-Å cut-off was used when calculating this list. Numbers in parentheses are the corresponding B-factor (in ÅReference Adler and Zickl2). Residues marked with an asterisk are from the second P-domain (PD) monomer. Solvent molecules (Sol) were numbered according to the PDB file 2OBT (www.pdb.org). Adapted, with permission, from Ref. 90 (© 2007 American Society for Microbiology).
In addition to the specific interactions described above, other interactions may occur to further stabilise the NV–receptor binding according to studies performed before the VA387 crystal structure was determined (Refs Reference Chakravarty71, Reference Tan and Jiang75, Reference Tan76, Reference Tan, Hegde and Jiang77). Such interactions may involve amino acids around the binding interface with sugar residues other than the terminal side-chains of the HBGA or with the backbones of the HBGA that carry the carbohydrate moiety. It is also possible that molecules other than HBGAs might participate in these interactions, such as the cellular 105 kDa membrane protein and the heparan sulphate, which have been demonstrated to bind specifically to NV VLPs (Refs Reference Tamura55, Reference Tamura56). In conclusion, both the native HBGAs on the cell surface and the receptor-binding sites of viral capsid are multivalent and may form a super network with different levels of interaction resulting in a high affinity in the virus–host interactions.
Structural and functional variation of the P domain
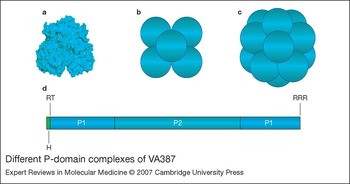
The P domain of the NV capsid revealed different forms with distinct receptor-binding activity when expressed in vitro. Expression of the full-length P domain and the short hinge resulted in production of exclusively P dimers (Ref. Reference Tan, Hegde and Jiang77). When the hinge is removed, the P protein forms P dimers as well as subviral P particles that contain 12 P dimers (Ref. Reference Tan and Jiang75). Addition of a cysteine-containing peptide to either end of the P domain results in almost exclusive production of P particles (Fig. 5) (Ref. Reference Tan and Jiang75). Furthermore, addition of a flag tag (DYKDDDDK) at the N-terminus and a cysteine-containing peptide at the C-terminus resulted in a smaller subviral P particle that is composed of six P dimers (M. Tan and X. Jiang, unpublished). Finally, deletion of the C-terminal arginine cluster of the P domain leads to the formation of P dimers exclusively (Ref. Reference Tan, Meller and Jiang74). Structural analysis revealed an extensive intermolecular interaction between the P domains, indicating that the P proteins have a high tendency of polymerisation (Refs Reference Prasad72, Reference Cao90). Most forms of P proteins retain receptor-binding activity although their binding affinities varied, with the P particles the highest and comparable to or even higher than that of the intact VLPs (Refs Reference Tan and Jiang75, Reference Tan, Hegde and Jiang77).
Different P-domain complexes of VA387. (a) P dimer (surface model) resolved by X-ray crystallography to a resolution of 2.0 Å. (b,c) Models of small P particle and P particle that contain 6 and 12 P dimers, respectively. Each ball represents one P dimer. (d) The linear structure of the P domain including the P1, P2 and hinge (H) regions. The two conserved trypsin cleavage sites (RT and RRR) are also shown. RRR also represents the arginine cluster.

The form of the P polypeptide, a P protein resulting from trypsinisation of the NV capsid protein, has been paid special attention because the P polypeptide may be made in NV-infected patients (Refs Reference Tan, Meller and Jiang74, Reference Greenberg87, Reference Hardy88). Sequence alignment showed that the two trypsin cleavage sites that are responsible for the P polypeptide are highly conserved among all known human NVs (Refs Reference Tan, Meller and Jiang74, Reference Hardy88). Thus, this P polypeptide must have a biological function, such as a decoy for the progeny viruses to escape the host immune surveillance. Trypsinisation could be an important regulatory step for this function. The loss of receptor binding of the P polypeptide by trypsinisation would prevent it competing with the progeny viruses for receptors during viral infection. After removal of the hinge and C-terminal arginine cluster, the P polypeptide is no longer sensitive to trypsin and can survive in the intestinal tract. Finally, the P polypeptide does not form P particles, and therefore would have a high molar ratio against host immunity (Ref. Reference Tan, Meller and Jiang74).
Human milk HBGAs as decoy receptors for NVs
In addition to providing nutrients, human milk provides valuable elements that protect infants from major infectious diseases (Refs Reference Morrow67, Reference Newburg, Ruiz-Palacios and Morrow91, Reference Newburg92, Reference Newburg93, Reference Newburg94, Reference Newburg95). Using a panel of milk samples from healthy mothers to block NV VLP binding to HBGAs, Jiang et al. described significant blocking activities with a clear association between the blood types of the milk donors and NV strains used in the assays (Ref. Reference Jiang96). Direct evidence of human milk protection of infants from NV infection has also been obtained in an infant–mother cohort study (Ref. Reference Morrow97). Human milk contains hundreds of oligosaccharides with complex structures and variable sizes (average of five to eight monosaccharide residues) (Ref. Reference Kunz98), which could be a rich source of optimal decoy receptors for many pathogens, although only oligosaccharides conjugating to the high-molecular-weight backbones of proteins or lipids are recognised by NVs (X. Jiang, unpublished). Thus, further studies to characterise the role of human milk oligosaccharide conjugates in NV infection would be worthwhile.
Host immunity to NVs
The finding of the association of specific HBGAs with clinical NV infection is a significant breakthrough in NV research and explains a number of controversial issues in NV infection and immunity that have puzzled NV researchers for decades. In volunteer challenge studies performed in the 1970s and 1980s, some individuals who had a high titre of pre-existing antibodies against Norwalk virus were found to be more susceptible to the virus than individuals who did not have or had a lower titre of antibodies (Refs Reference Parrino8, Reference Black32, Reference Greenberg99, Reference Kapikian100, Reference Blacklow and Cukor101, Reference Baron102, Reference Blacklow, Herrmann and Cubitt103). It was also found that some volunteers never became infected following the challenge with Norwalk virus even though they did not have antibodies against the virus (Ref. Reference Parrino8). In addition, in outbreaks of NV-associated gastroenteritis, infected individuals tended to be clustered in families (Ref. Reference Kappus104). Based on these results, the hypothesis of a genetic factor being involved in NV host specificity was proposed.
It is now understood that those volunteers who never became infected with NV following the challenge may not have receptors in their intestinal mucosa necessary for the virus infection. In the case of Norwalk virus infection, the non-secretors or the type B secretors possibly belong to this category. On the other hand, the acquired immunity may also play a role in resistance to Norwalk virus, as a third of secretors who express the A and/or H antigens were not infected following the Norwalk virus challenge (Ref. Reference Lindesmith58). Homologous immune protection of NVs has been shown in studies of volunteer challenge and outbreak investigations (Refs Reference Parrino8, Reference Wyatt10, Reference Farkas105). However, the antibody protection against NV gastroenteritis has been found to be short lived (weeks to months) and strain-specific (Refs Reference Parrino8, Reference Wyatt10), which explains the widespread nature of NV diseases even in the adult population.
The fact that pre-existing antibodies are often not protective against NV infection in some individuals may be explained by a heterologous host immune response against diverse NVs; NVs exist as many genetic and antigenic types (Refs Reference Jiang, Desselberger and Gray106, Reference Jiang107, Reference Green108). Cross-reactive antigenic epitopes have been observed among different NV strains (Refs Reference Lochridge89, Reference Kitamoto109, Reference Hansman110), but these epitopes may not necessarily induce cross-neutralising antibodies. The fact that some individuals with higher levels of antibodies against NVs are more susceptible to NV infection indicates that these individuals express the required HBGA receptors and they were previously exposed to NVs. However, these antibodies may not be protective if the previously exposed strains are only antigenically related and do not induce formation of neutralising antibodies against the challenge strains. Thus, the higher levels of antibody serve only as a marker of past exposure to certain NV strains and are not necessarily a sign of protective immunity.
Evolution of NVs
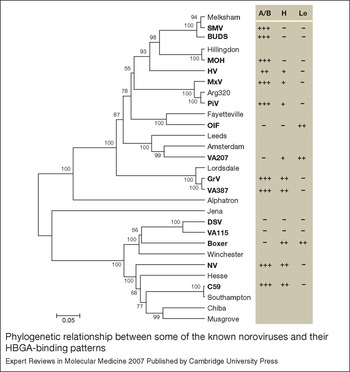
The fact that the two binding groups of NVs mutually exclude the A/B or Lewis epitopes indicates that the two groups represent two genetic lineages in co-evolution with the human host. Unfortunately, no clear segregation of the two binding groups with the genogroups of NVs can be seen when the entire capsid sequences were analysed, although strains with the same or closely related binding patterns are clustered (Ref. Reference Huang51) (Fig. 6). A similar phylogenetic tree was obtained when a sequence alignment of the P2 subdomain, in which the binding interface is located (see above), was analysed. These results may be due to the fact that the binding specificity is determined by components of the receptor-binding interface, which are a few scattered amino acids that are directly involved in the interaction with the side chain of HBGA receptors (Fig. 4 and Table 2). In fact, a single amino acid mutation in the receptor-binding interface of the NV capsid could change the binding pattern or completely knock out binding activity (Ref. Reference Tan76), suggesting that a structure-based sequence comparison may be an appropriate approach to analyse the evolution of the NV binding patterns.
Phylogenetic relationship between some of the known noroviruses and their HBGA-binding patterns. The phylogenetic tree was constructed based on the amino acid sequences of the entire capsid proteins using the UPGMA clustering method (MEGA v2.1) with poisson correction distance calculations. The scale bar represents the phylogenetic distance expressed as expected amino acid substitutions per site. Bootstrap values are indicated as the percentage of 125 replicates. Strains with known histo-blood group antigen (HBGA)-binding patterns are in bold. The potential HBGA targets for individual strains are shown on the right. The binding results of each strain were assigned based on reactions in assays with saliva and/or oligosaccharide conjugates. ‘+’ indicates a positive binding observed in any of the assays, ‘ + + + ’ indicates higher binding signals, and ‘–’ indicates no binding. Adapted, with permission, from Ref. 51 (© 2005 American Society for Microbiology).

NVs are single-stranded RNA viruses that are highly adaptable. The clusters of the strains with the same binding groups (Fig. 6) (Refs Reference Huang51, Reference Huang52) indicate that these strains may be derived by divergent evolution from the same ancestor. However, strains with similar binding patterns or sharing common epitopes but scattered in different genogroups may be derived by convergent evolution selected by human HBGAs. Furthermore, the host immune response also may affect the evolution of NVs, which may further drive the divergence of the genus. Indeed, when the antigenicities of different NVs were analysed using recombinant VLPs in EIA, correlation between antigenicities and genetic typing of NVs was observed, although unusually cross-reactivities were observed among certain types of NVs (Ref. Reference Hansman110). The increasing evidence of NVs causing gastroenteritis in different domestic animals (Refs Reference Bridger111, Reference Dastjerdi112, Reference Dastjerdi, Snodgrass and Bridger113, Reference Oliver114, Reference Deng115, Reference Han116, Reference Liu117, Reference Wise118, Reference Oliver119) and the genetic relatedness of HBGAs between humans and some mammals (Refs Reference Yamamoto and Yamamoto120, Reference Backer121) further highlights the need for a greater understanding of the origin and evolution of human NVs.
Epidemiology and disease control
The predicted host ranges of NVs from their receptor-binding patterns explain some of their epidemiological features. For example, the VA387-like strains, which belong to the Lordsdale cluster (GII 4), are globally dominant and cause 50–90% of all NV-associated outbreaks of acute gastroenteritis in the USA and many other countries (Refs Reference Harrington53, Reference Harrington54, Reference Tamura55). Receptor-binding assays show that VA387 and GrV VLPs have the ability to bind saliva of any secretors (Table 1), which make up 80% of the population of Europe and North American countries. Investigation of outbreaks caused by Lordsdale-like NV has supported the prediction of the host range (Ref. Reference Thorven122). Thus, development of strategy focusing on these dominant strains should be a priority. In addition, since the distribution of human HBGAs is variable between different geographical locations and ethnic groups, development of a strategy to prevent the dominant strains according to HBGA distribution within individual populations is necessary.
Recently NVs have been found to bind the carbohydrates in the intestinal tract of major species of shellfish (Refs Reference Tian123, Reference Le Guyader124), suggesting an important mechanism of bio-accumulation of the viruses in these human food species. Although it remains unknown whether the same carbohydrates of human HBGAs are involved, this finding is significant for public health and food hygiene. Further study to understand the mechanisms and to develop procedures to prevent such bio-accumulation and for depuration of shellfish species by the food industry is necessary.
Development of NV antivirals
The finding of NVs recognising HBGAs as receptors provides a new approach for development of antivirals against NV infection. The elucidation of the structure and function of NV capsids in receptor binding may result in the design of antivirals to block NV binding to receptors. The classification of different receptor-binding patterns of NVs into two binding groups and the development of the model of NV–HBGA interaction (Refs Reference Huang51, Reference Tan and Jiang61) will also help in the design of target-specific antivirals for maximal protection against NV strains representing the major receptor-binding patterns. In addition, screening of naturally occurring products or synthetic compounds for inhibitors of NV binding to HBGA receptors is another approach for antiviral development. Saliva-based assays are simple, rapid, specific and inexpensive (Refs Reference Huang51, Reference Huang52), and could serve as a high-throughput method. A recent study screening a compound library (Ref. Reference Feng and Jiang125) has already found candidate compounds worthy of future investigation.
Antivirals work by blocking or competing with the binding of NVs to their receptors. They may be synthetic compounds or natural products with a similar structure or similar binding features as the HBGA receptors. The human intestine has a large surface area and the HBGAs are highly abundant on the mucosal surface, which might make it difficult for an antiviral to block all available receptors for all viruses. In addition, the human gastrointestinal tract is a complex environment containing a variety of active factors that may interfere with the function of antivirals. Thus, inhibitors need to have a high stability and high affinity.
Protection of infants from NV infection by their mothers' milk and the characterisation of human milk glycan inhibitors for NV infection are important areas to identify such molecules. Human milk is rich in glycans that may contain high-affinity molecules because of the long period of co-evolution between humans and NVs. In addition, NV-specific antibodies have been found to be highly effective in blocking NV binding to their receptors (Refs Reference Harrington54, Reference Lochridge89, Reference LoBue126). Development of such antibodies could be another approach for high-affinity antivirals against NV infection. The rapid development of recombinant antibody technology for production of humanised monoclonal antibodies could facilitate this approach. Finally, a strategy for antiviral delivery may increase the efficacy of antivirals against NVs. The recent reported viral ‘cage’ made from hydrogels pre-linked with HBGA analogues to trap and remove NVs from human intestine represent one possible delivery system (Ref. Reference Zhang127).
NV vaccine development
Resolution of the controversies of NV infection and immunity has allowed a solid basis for development of a vaccine against NVs. It is now believed that the serological immune response following a natural NV infection is protective rather than a risk for further infection. Thus, recombinant subviral vaccines based on recombinant VLPs, which have been demonstrated to induce immune responses in animals and humans (Refs Reference Jiang45, Reference Tacket128, Reference Tacket129, Reference Mason130, Reference Ball131), should be one approach for further research. The finding of specific blocking of receptor binding by type-specific monoclonal and hyperimmune antibodies further supports the antibody-based vaccine approach (Refs Reference Harrington53, Reference LoBue126). The in vitro antibody-based blocking assays could be used as a substitute for the neutralisation tests to evaluate antibody responses following vaccination. Furthermore, a new classification of NVs based on host range and HBGA types would be biologically more relevant than the current phylogenetic classification of NVs in term of NV infection and illness in humans, and therefore may help in the design of a vaccine ‘cocktail’ for protection against most receptor-binding patterns. Finally, the mapping of the receptor-binding interface in the P domain and the finding of the different forms of NV P proteins provide new technologies for cost-effective production of vaccine against NVs. The subviral P particles, which are highly immunogenic, have high affinity for NV receptors and are easily produced in E. coli, could be an excellent candidate subunit vaccine as an alternative to the VLP-based vaccines, which are hard to produce and expensive.
Current research and outstanding questions
The discovery of the NV receptor and the description of a wide variation of host range of NVs will significantly impact research in many areas related with the virology, epidemiology, immunology, pathogenesis and evolution of NVs. For example, it will stimulate research to develop an in vitro cultivation system for NVs. The polymorphism of human HBGA systems and the broad host ranges of NVs will affect the epidemiology and surveillance of the diseases in different geographical locations and ethnic groups. The natural resistance of NVs as a result of HBGA genetics necessitates research to redefine the natural history of NV infection and host immunity.
There is also an urgent need for further studies of the host–pathogen interaction between NVs and humans. For example, the linkage between HBGA recognition and host range has been obtained for the prototype Norwalk virus (Refs Reference Lindesmith58, Reference Hutson59, Reference Hutson60) and the Lordsdale-like viruses (Ref. Reference Thorven122). Studies to define the host range for strains representing other binding patterns are needed. In addition, many questions on the NV–receptor interaction in vivo remain unanswered, which may be related to a basic understanding of the human HBGA systems. Although a significant amount of information has been obtained on the structure of the NV capsid and its interaction with the HBGAs, additional structure–function studies are necessary. For example, the major components of the receptor-binding interface of VA387 are not conserved among NVs with different receptor-binding specificities, suggesting that different receptor-binding modes are involved. It is thus important to determine the structures of NVs with different binding patterns.
Although human HBGAs have been shown to be the receptors of NVs, it seems unlikely that they are the sole determinants for a virus to enter into the host cells. Other factors and/or co-receptors could also be necessary, such as those for cell fusion and/or penetration following the attachment. Identification of such factors and co-receptors will be critical for further elucidation of NV–host interaction. Study of the structure–function variation of the P domain is a new area that needs to be further explored. For example, the proteolytic cleavage of NV capsids or capsid proteins has been found in several strains (Refs Reference Tan, Meller and Jiang74, Reference Hardy88, Reference Kumar132), further elucidation of the role of trypsinisation may provide insights into the viral replication, pathogenesis and host immunity to NVs. Finally, the high tendency of polymerisation of the NV capsid proteins, which has been demonstrated by the formation of different subviral particles of NVs (Refs Reference Prasad72, Reference Tan and Jiang75, Reference Tan, Hegde and Jiang77, Reference Bertolotti-Ciarlet85, Reference White, Hardy and Estes133), could be a unique feature for the study and development of subviral particles into a target-specific drug delivery system via nanotechnology.
Acknowledgements and funding
The authors' work is supported by grants from the National Institutes of Health [National Institute of Allergy and Infectious Diseases (AI 37093 and AI 055649) and National Institute of Child Health and Human Development (HD13021)], the Department of Defense of the USA (the Army Medical Research and Materiel Command, PR033018) and Cincinnati Children's Hospital Medical Center (Translational Research Initiative) of the USA.