NOMENCLATURE
- bdg
bending mode
- CG
centre of gravity
- edg
edge mode
- f n
natural frequency
- HARW
high-aspect ratio wings
- I
moment of inertia
- L
beam length
- LCO
limit cycle oscillation
- Num
numerical analysis
- E
Young’s module
- Th
theoretical analysis
- trs
torsion mode
- Γ
YIy/YIx
- θ
Jt/Ix
- λ i
(β · L)i
- μ
Weight distribution
- ϕ i
i th modal vector
- ρ
Density
- σ
Yeld Stress
- τ n
f n · L2
- τ tn
f tn · L2
- ξ
Modal co-ordinate
1.0 INTRODUCTION
High Altitude Long Endurance (HALE) wing structures under dynamic aerodynamic loading are prone to aeroelastic instabilities. At the design stage the regulatory guidelines for airworthiness consider all critical flight conditions to be tested to guarantee satisfactory results. Both static and dynamic considerations to assess the aeroelastic behaviour of flying vehicles are of paramount importance and are considered in the certification process. From a dynamic analysis perspective, geometrical nonlinearities due to large amplitude deflection can reduce the flutter speed and induce more complex dynamic behaviour. More specifically, the steady state large structural deformation, due to the aerodynamic loading at cruise condition, is responsible for the geometrical nonlinearities, while the pressure on the wing surface, being function of the wing geometry, in the field of large displacement it becomes a nonlinear function of the displacements. Unfortunately, approaches based on linear theory can provide non-conservative results and it is of paramount importance to consider the nonlinear condition effects at the dynamic/aeroelastic design stage. Consequently, using nonlinear methodologies it is possible to observe a variety of nonlinearity behaviour including subcritical aeroelastic and chaotic responses due to the interactions of aero-structure. Clearly, the appearance of limit cycle oscillations (LCO) can lead to undesirable airframe vibration and limit the performance of the flight vehicle, effectively reducing the cycle fatigue life of the structure, however catastrophic failures can occur unexpectedly and a better understanding of the complex interaction between the highly flexible structure and the unsteady aerodynamic loading is highly desirable.
The critical and post-critical behaviour of HALE wings is investigated in(Reference Arena, Lacarbonara and Marzocca2) where the effect of the angle of attack on the critical condition as well as the effect of a tip mass with respect to the post-flutter LCO response are illustrated. In(Reference Banerjee, Xiang and Hassan3) authors studied several high-aspect ratio wings (HARW), namely two sailplanes and two transport airliners wings, and compare free vibration and flutter characteristics. Wind-tunnel test campaigns of flexible wings are presented in(Reference Brit, Ortega, Tigue and Scott4) while in(Reference Cestino, Frulla and Marzocca5–Reference Cestino, Frulla, Perrotto and Marzocca7) Cestino et al. developed a composite wing for wind-tunnel tests. Through a scaling procedure, a set of dimensionless parameters are found and the sensitivity of these parameters is assessed. Test are conducted on a wing model to assess the natural frequencies and linear and non-linear flutter frequency and speed. Dowell collected several non-linear aeroelasticity studies in a comprehensive review(Reference Dowell, Edwards and Strganac8). In(Reference Dowell and Tang9,Reference Dowell and Tang10) theoretical and experimental investigations for three different wing models, one of which had a very high aspect ratio, are presented. The effect of the angle of attack on the structural natural frequencies and flutter speed, due to the variation of the static aerodynamic loading, is investigated. The study also shows aerodynamic stall-induced LCO due to flow separation and the hysteresis behaviour associated with the LCO, similar to what is reported in(Reference Jaworski15). In(Reference Frulla, Cestino and Marzocca13) Frulla et al. carried out a detailed analysis with respect to flexible wings. In(Reference Jian and Jinwu16) an investigation with respect to the LCO behaviour of HARW at lower and higher speed is carried out by including the effect of geometrical nonlinearities. The amplitude and shape of the LCO are strongly influenced by the flight speed. Patil and Hodges(Reference Patil and Hodges17) also noted a considerable influence of geometrical nonlinearities on the dynamic behaviour. A large span-wise deflection and variation of structural frequencies is shown by inducing a static deflection by means of a static force applied at the tip. A strong coupling between the edge and torsional frequencies due to static deflection of the beam is shown, indeed a decrease in the coupled torsional/edge frequency (at the beginning purely torsional) and an increase of the edge-wise bending/torsion with a consequent reduction of critical conditions, function of the static tip displacement, is also observed. Moreover it is shown that the flap-wise bending frequencies does not exhibit strong variation with the wing deflection. Patil and Hodges(Reference Patil and Hodges18) analysed different types of geometrical nonlinearities with respect to aeroelastic behaviour of high-aspect-ratio wings showing that the airloads computed by means of a nonplanar wing geometry theory are quite similar to the one assessed using planar wing theory, while the dynamics behaviour of the wing undergoing large deflection is quite different; indeed there is more than 50% discrepancy on the computed flutter speed.
The present work contributes to the state-of-the-art by providing both numerical and experimental findings associated with highly flexible wings. This work serves as an experimental validation/investigation of flexible wings undergoing self-sustained oscillations occurring at the critical flight condition. Such nonlinear effect has been studied in numerous works albeit the large majority is analytical or computational. Very few experiments exist in archival literature. At first, high flexible beam models with selected cross-sections are numerically investigated to assess the effect of the geometrically nonlinear deflections and the transverse cross-section on their dynamic behaviour. Secondly, the cross-section configuration providing the most significant evidence of large deflection is chosen for the experimental validation. A flexible wing is manufactured and tested in the RMIT wind-tunnel facility to establish its dynamics and to evaluate both flutter behaviour and aeroelastic response. Herein, the intent is to clarify this dependence and the experimental findings are illustrating interesting critical aeroelastic phenomena due to the wing flexibility.
2.0 CANTILEVER BEAM ANALYSIS
Several cantilever beam configuration analyses were conducted to understand the changes in natural frequencies when the structure exhibits large deflection. The effects of geometrical nonlinearities are displayed by conducting both numerical and experimental investigations. Using simple beam cross-section geometries, the influence of the transverse section on their structural dynamic behaviour, including modal frequencies and mode shapes can be assessed. During the numerical and experimental analysis the yield strength limit was not exceeded, avoiding nonlinearities other than geometrical. The nonlinear behaviour was induced by increasing the magnitude of an applied tip force which in turn increased the out-of-plane bending displacement. Gravity force was also considered into the loads. As expected, these investigations showed that no changes in the natural frequencies occurred for small deflections of the wing and the linear analysis was sufficiently accurate in this case, while the frequencies would change for larger beam deflection and this would be captured only by performing a nonlinear analysis. Numerical model, made with FEM software ABAQUS® by SIMULIA complemented the analysis using the Euler-Bernoulli linear theory. Results of the dynamic numerical investigations are presented in the following sections.
2.1 Dynamic Characterisation of Flexible Beams by Numerical Investigation
The numerical analysis uses a Cartesian co-ordinate system: x is the longitudinal axis (beam length direction), while y (out-of-plane vertical direction) and z (in-plane horizontal direction) are axis in the cross-section plane. The selected cross-sections have the following shapes: a) Rectangular [x-R], b) I [x-I] and c) U [x-U] shape. The dimensions and shape are reported in Table 1, Table 2 and Fig. 1, respectively. Each section is represented by using two parameters [1]: Γ = EIy/EIx and θ = Jt/Ix.
Rectangular cross-section with 20 mm base, geometrical parameters

I and U cross-section geometrical parameters: b, h, s and sc in mm

Beam cross-section shapes.

2.2 Cross-Sections Analysis
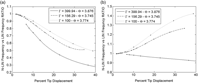
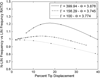
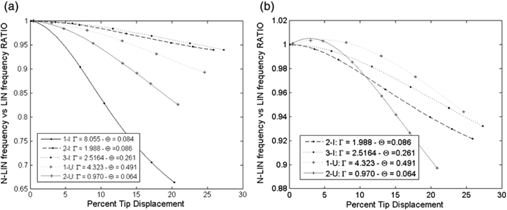
The geometrical and material beam properties are as follows: Length: L=500 mm; Material: Aluminium; Density: ρ = 2710 kg m−3; Young’s Module: Y=73 GPa; Yield Stress: σ = 345 MPa. A simple rectangular cross-section beam (R-type) with 20 mm width and selected height are reported in Table 1. Figs. 2–4 display the natural frequencies obtained through numerical investigations performed using both linear (Euler-Bernoulli linear theory) and nonlinear (nonlinear FEM software ABAQUS® by SIMULIA) analysis. Values have been normalized with respect to the linear frequencies. The edge and torsion frequencies show the important modal coupling due to deflection: with a tip displacement of 38% of the beam length a 70% reduction in the first edge frequency is manifested for the R-type section with thickness of 1 mm. Bending frequencies are less influenced by tip deflection. This is also the case for beams with I and U cross-sections and Figs. 5–7 show the numerical results. Also in these cases the modes mostly influenced by large deflection are edge and torsion. By assessing the nonlinear effects on the natural frequencies, it can be concluded that such behaviour depends on the cross-section geometry as well as two parameters Γ and θ. An example can be seen in Fig. 5, where both 1-U and 3-I show the same trend with different geometrical parameters. However, this holds true only for a single mode, i.e., 1-U and 3-I have same behaviour in the 1st Torsion mode but are different in the other ones. Additionally, the investigation shows that for the I-type cross section and for increasing, larger variations in natural frequencies occur. Due to the significant difference in θ parameters between the two considered sections this does not appear for U-type cross section. Notwithstanding, these initial investigations clearly show the importance of taking large deflection nonlinearities into account.
(a) 1st and (b) 2nd nonlinear Edge frequencies, variation in % with respect to the linear case.R-type cross section.

(a) 1st and (b) 2nd nonlinear Bending frequencies, variation in % with respect to the linear case. R-type cross section.

1st Torsion frequencies, variation in % with respect to the linear case. R-type cross section.

1st Torsion frequencies, percent variation respect linear case. I- and U-type cross sections.

(a) 1st and (b) 2nd non-linear Edge frequencies, variation in % with respect to the linear case. I-and U-type cross sections.

(a) 1st and (b) 2nd nonlinear bending frequencies, variation in % with respect to the linear case.I- and U-type cross sections.

2.3 Experimental Investigation
Experiments are proposed in order to investigate and validate the numerical results presented in Section 2.2. The rectangular cross section is considered in the experimental campaign. The beam tip deflection is induced by changing the length of the test articles and by making use of the beam own weight. Other methods of generating beam deflections were explored but discarded for a number of reasons; a tip mass inducing a tip displacement would have changed the boundary condition at the tip and consequently the mode shapes and frequencies; on the other hand, the use of a distributed mass, would have been quite difficult to accurately assess. From the Euler-Bernoulli linear beam theory, the natural frequencies follow the relationship  ${f_n} = {{\rm{C}}_{\rm{m}}}\cdot\beta _{\rm{n}}^2$ where Cm is function of the material and
 $\beta _{\rm{n}}^4 = \frac{{\mu \cdot \omega _{\rm{n}}^2 }}{{\rm{D}}}$. Remembering that the free vibration equation can be cast as ψ ,xxxx − β
Reference Brit, Ortega, Tigue and Scott4 ψ = 0, it is possible to obtain the eigenvalues of the system, namely λ i= (β · L)i, and a frequency index which is independent from the beam length. For the transverse and edge vibrations these frequencies are scaled with length-square, that is
 ${\tilde \tau _n} = {f_n}\cdot{{\rm{L}}^2}$, while for the torsion frequencies are scaled with length, that is
 ${\tilde \tau _{{t_n}}} = {f_{{t_n}}}\cdot{\rm{L}}$. While the frequency index will change its value for each length when considering the nonlinear case, this will not be the case for a linear analysis.
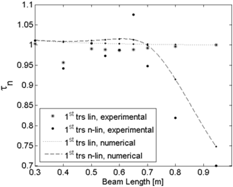
The linear behaviour in the experimental campaign is simulated by placing the beam vertically, such that the self-weight deformation would not affect the measurements. The comparison between numerical and experimental analysis is reported in the subsequent figures. Numerical predictions reported in Figs. 8–10 confirm that  ${\tilde \tau _n}$ values at different length are always constant when the assumption of linearity holds valid (all results were normalized with the linear values at length 950 mm, both numerical and experimental). The nonlinear torsion analysis highlights an increase in the frequency ratio for shorter beams, while an opposite trend is noticeable for longer beams as the assumption of linearity breakdown. Good correlation is shown between numerical and experimental data. The minor discrepancy can be attributed to manufacturing imperfections, material property estimations, the position of the beam and the root clamp set-up. Because of such small discrepancy, in the bending mode there is only a very small visible difference between the linear and nonlinear analysis. Comparing linear experimental and numerical results for the 1st bending frequency the error is less than 8%. Fig. 9 shows that the numerically estimated 1st nonlinear bending frequency increases with the length of the beam while it decreases in the experiment. Considering the beam max length of 950 mm, the linearly estimated 1st bending frequency is 1.56 Hz, while its nonlinear counterpart is 1.47 Hz, i.e. the difference in % is only 5.77% (0.09 Hz). These findings do demonstrate that there are no significant changes between two experimental linear and nonlinear analyses which confirm the small sensitivity of the bending mode with respect to the tip displacement. Very good correlations between experiments and numerical results are also shown for all the other considered frequencies and modes. It is also worth reporting that there is a notable difference at a beam length station between 600 ÷ 700 mm from the root. Several analyses have been repeated to confirm the results and the variance is attributed to material or manufacturing imperfection in the aluminium beam.
Normalized  ${\tilde \tau _n}$ parameter for bending linear and non-linear data.

Normalized  $tilde \tau _n $ parameter for (a) bending linear and (b) non-linear data.

Normalized ${\tilde \tau _n}$ parameter for (a) edge linear and (b) non-linear data.

3.0 WIND DESIGN AND WING DYNAMIC CHARACTERISATION BY NUMERICAL AND EXPERIMENTAL INVESTIGATION
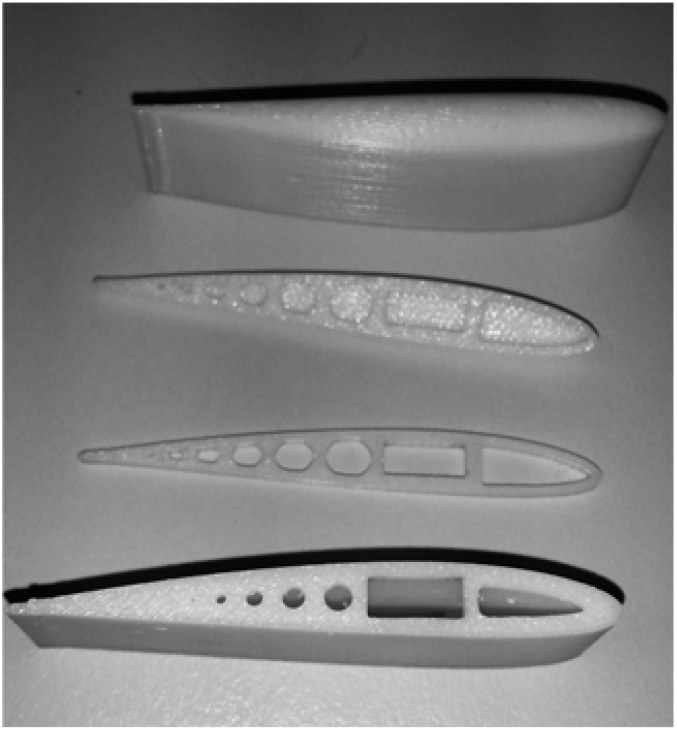
A modular configuration was selected to achieve a flexible and light wing design to be manufactured and used in the experimental investigation. The prototype wing includes a single continuous load-carrying oak spar and modular additively manufactured streamlined sections with primary aerodynamic function. The oak wood spar has a rectangular cross section, 10 mm in width and 4mm in height. Oak wood spar due to the high flexibility in flapwise and edgewise bending, and torsion, even with small amount of aerodynamic loads, large deflection can be attained reproducing deflections equivalent to aluminium spar analysed above. The additive manufactured sections are hollow to minimize weight and to allow the installation of the load-carrying spar. An aspect ratio of 30,  $\lambda = {{{{\rm{b}}^2}} \over {\rm{S}}} = {{\rm{b}} \over {\rm{c}}}$, comprable with the one of high performance gliders was selected, leading to a wing chord of 66.7 mm. The airfoil selected for this study is a NACA 2412. Such airfoil has the maximum thickness (12% chord) at 30% chord and a maximum camber of 2% at 40% chord. All modular sections are made by lightweight ABS (Acrylonitrile Butadiene Styrene) through an additive manufacturing process. The section are shown in Fig. 11. The wing was made by 25 sections, each 2 cm in width. The inertia proprieties of a single modular part are: Ix= 1.767 · 10−7 kg · m2, Iy = 1.428 · 10−6 kg · m2 and Iz = 1.297 · 10−6 kg · m2. The external parts have been designed to decrease the weight of the assembly, such that the added stiffness of these elements is significantly reduced. The weight of the wing is 0.13 kg whereas flapwise stiffness EIz= 0.799 N · m2, chordwise stiffness EIy = 4.999 N · m2 and torsional stiffness GJt= 0.191 N · m2. The mass moment of inertia of the complete wing are Iwx = 3.4 · 10−5 kg · m2, Iwy = 3.0 · 10−3 kg · m2 and Iwz = 2.0 · 10−3 kg · m2. The elastic axis position is at 33.73% chord.
Manufactured wing. Airfoil parts.
3.1 Numerical Model
Numerical models have been generated to assess the wing dynamic behaviour. To consider the large deformation, both 3D and 2D numerical models by Abaqus® are proposed. The 3D model was generated from a combination of hexahedral and tetrahedral elements, while for the 2D model just the shell elements were used. For this model a 3D deformable shell, obtained by solid extrusion, is considered. This shell represents the spar, which is the deformable part of the wing. The materials used for the model are different and all are defined by engineering constant. The number of element in the 3D model is about 5· 107 while for the 2D shell model the significantly smaller number of element is 5·· 103. The 2D model is computationally efficient and since the difference in the results was less than 5%, it was deemed to be acceptable for the analysis. Consequently, all the remaining analyses were carried out with the simplified 2D model. Through the thickness integration was carried out by Simpson method, with 5 thickness integration points. Rigid elements, linked to several references points, were defined to simulate the inertia properties of the wing in FE model. Using CATIA® it was possible to identify the correct position of the center of gravity of each section; 25 reference points were created, one for each section that complete the wing. The position of these points corresponded to the centre of gravity of the spar in the experimental model. All properties, as the weight and the inertial properties of each section (I 11, I 22, I 33), were added to these points. Taking into account that ABAQUS solves the model step by step, two different steps were defined. Since the aim of this work is to better understand the effect of the nonlinearities, the following approach is considered. For the linear cases in a single step frequencies and modal shapes are calculated, while, for nonlinear cases, during the first step, the structure is deformed under self-weight and external load, in the second step, the frequencies and the modal shapes are calculated. The static analysis is carried out using Newton or semi-smooth method, while the modal analysis is solved with Lanczos method, normalized by mass matrix.
3.2 Wing Dynamics
A number of experimental investigations are performed, to assess the behaviour of the wing in its linear and nonlinear states. The Polytec Scanning Laser Vibrometer (LSV) for the rapid non-contact vibration measurement is used to determine the wing dynamic modal properties, including bending/torsion and edge frequencies and mode shapes. The modal characterisation can assist in the design of any structure, helping to identify areas where design changes are needed. It can also predict the vibration characteristics of components and systems. The LSV uses the Doppler Effect and can make rapid and accurate measurements, substantially cutting down traditional modal testing costs. The development of a modal model, from either frequency response measurements or from a finite element model, is useful for simulation and design studies. For example, it can be used to perform structural dynamics modification; this is a mathematical process which uses modal data (frequency, damping and mode shapes) to determine the effects of changes in the system characteristics due to physical structural changes. All experimental wing setups (both linear and nonlinear) were fixed to a rigid steel plate, to eliminate any possible coupling effect between frequencies of the mounting frame and the interested structure frequencies. In the linear setup, to avoid geometrical nonlinearities which can be caused by the self-weight, the wing was mounted vertically; however, it is worth reporting that the effect of weight could have slightly increased the longitudinal stiffness of the structure due to the vertical stretching force. The shaker is positioned near the root, where the wing was rigidly constrained to simulate a cantilever configuration, as to excite the wing in the frequency range of interest. The Polytec software run the shaker, while the laser head is used to scan all grid points virtually positioned on the wing, and to extract FRFs at each scanned point. Mode shapes at the natural frequency are also computed at each FRF major peak. For bending, torsion, and edge frequencies different configurations are tested, by rotating either the wing or the LSV to carry displacement or velocities laser measurements in the designated direction.
Taking into account the wing assembly, numerical predictions still agree relatively well with the experimental tests. The proximity between bending and edge frequencies is noticeable, and for this wing can induce edge-bending flutter. Generally speaking this type of flutter is more common in highly flexible wing, contrarily to the classical flutter, which involves bending-torsion coupling. Table 3 reports the data collected from the numerical and experimental investigations. For the simple wooden spar, it was not possible to generate large deflections under self-weight, hence linear and non-linear natural frequencies were quite close. Fig. 12 shows the bending-torsion modes FRFs. Linear and nonlinear trends are quite similar, although the nonlinear results were slightly noisier above 150 Hz. Since the range of interest was below 100 Hz the nonlinear effects at high frequencies are not significant for this study. The SLV software is used to reconstruct mode shapes and facilitated the identification process of the modes of interest.
Wing frequencies [Hz] – Linear and Non-Linear

Bending/torsion FRF, (a) Linear - Beam clamped on the shaker; (b) Linear – Shaker near wing root; [Peak at: 4.96, 27.34, 31.09, 78.91] Hz (c) Non-Linear – Beam clamped on the shaker [Peak at: 4.96,25.78, 29.30, 79.69] Hz. More details in Table 3.

The comparison between linear and nonlinear numerical analysis displays the coupling among edge modes with torsion. Indeed, Fig. 13b shows the existence of a coupling between the 1st nonlinear edge mode and the torsion mode compared with the linear prediction displayed in Fig. 13a. Same consideration can be made comparing results in Figs. 14a and Fig. 14b which display respectively 2nd linear and nonlinear edge mode. The bending and torsion modes are not displayed since are not coupled. Unfortunately it was not possible to reconstruct the edge mode shapes from the SLV experiment given the small thickness, hence no comparison can be made with the numerical edge modes.
1st Edge reconstructed mode, (a) linear and (b) nonlinear.

2nd Edge reconstructed mode, (a) linear and (b) nonlinear.

By using the “Half Power Point Method” structural damping has also been evaluated. These are:
1st Bending: ζ= 0.0913; 2nd Bending: ζ = 0.12
1st Edge: ζ= 0.028; 2nd Edge: ζ = 0.12
1st Torsion: ζ= 0.0912
4.0 WIND-TUNNEL INVESTIGATION
The wind-tunnel facility at RMIT University has a hexagonal test section with a 1.37 m wide and 1.10 m high cross section and 2 m in length. The tunnel is powered by a 380 KW DC motor that produces a maximum speed of 150 km/h. A high-speed camera was used to acquire consecutive picture frames. The images were then processed to attain the time-histories of the wing displacement data. Although the camera could capture frames at 1000 fps, considering that the maximum frequency of interest was around 30 Hz, a reduced sampling rate of 300 fps was used. This approach simplified the test by reducing issues associated with mounting accelerometers and wiring which would have further added mass and damping to the system. The adopted solution also decreases the risk to damage on-board instrumentation in case of wing failure. The wing was mounted in the tunnel with a fixture system capable of changing the angle-of-attack (AoA) without disassembling the wing structure and without requiring entering in the wind-tunnel test section to minimize potential errors associated with assembly and in between test operation. A clear window allowed the recording of the motion of the wing under aeroelastic oscillations. The high-speed camera images were exported into Matlab® environment where the Image Processing Toolbox® was used to extract the position of markers added at the tip of the wing (markers can be seen in a later figure). From the sequence of images time histories were recorded, and frequencies and amplitude of motion could be analysed. Three different type of mark have been applied, one towards the leading-edge, one towards the trailing-edge and one on the elastic axis. In this way it is possible to calculate the changing of the AoA during the aeroelastic phenomena.
4.1 Aeroelastic Behaviour
Aeroelastic investigations were carried out on a wing at 0° AoA. The high-speed camera captured frames displaying dynamic response and flutter.
In a linear system, flutter is the point at which zero-damping (combined structural and aerodynamic) is displayed. Above flutter, an unbounded sinusoidal self-oscillation is exhibited. Real system are nonlinear and given the presence of a non-linear stiffness the vibrations remain constrained into a bounded oscillation, and the flutter condition leads to Limit Cycle Oscillation mode (LCO). The first manifestation of a critical condition (flutter) is a sinusoidal self-oscillation structural response with amplitude growing with increasing speed. It will be called Vcr1 the speed at which a first self-sustained oscillation (LCO) occurs while Vcr2 the speed at which the wing behaviour changes becoming more aggressive with an increase in frequency and amplitude.
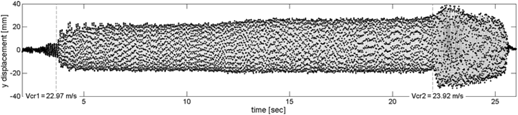
Fig. 15 shows the complete response of the wing when the speed is increased and Fig. 16 illustrates the amplitude and frequency variation in time.
Wing dynamic response at the trailing-edge point.

(a) Frequency and (b) amplitude magnitude variations for increasing speed and time.

The experiment starts with an initial speed of 22 ms−1, lower than Vcr1, and the speed is increased quasi-statically with a very slow rate as to minimize the influence of the ramp up.
When the first critical speed Vcr1 = 22.97 ms−1 is reached, the aeroelastic behaviour changes, the oscillation amplitude suddenly increases and the wing entered in a self-sustained oscillation. With the increases in speed both the amplitude and the frequency increases. The frequency at 4 sec is 13 Hz, whereas at 22 sec is 14.3 Hz. The amplitude changes from around 20 mm (at t=0 sec) to 23.5 mm (at 22 sec).
The wind velocity is further increased until the wind speed reaches a second critical velocity, Vcr2 = 23.92 ms−1 characterised by a sudden increase in LCO amplitude. Only few seconds of data are recorded at this speed to avoid wing destruction. Once this instability mechanism is triggered the air flow is reduced and, as shown in Figs. 15 and 16, after 23 sec, the dynamic response amplitude decreases. At Vcr2 there has been a critical variation both in frequency and in amplitude, with an amplitude increases of 52%, from 46 mm to 70 mm, whereas the frequency changes from 14.2Hz to 25Hz, i.e., 78%.
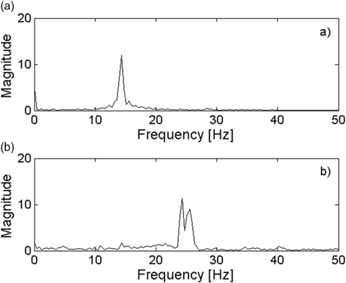
Fig. 17 shows the FFT before and after the Vcr2. Points before second critical condition consider a time interval between 6.9 and 7.4 sec. Two peaks after Vcr2 are caused by a point identification error.
FFT backward point (a) before Vcr2 t around 7s (b) after Vcr2.

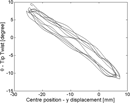
The described analysis was conducted by considering the detected trailing-edge marker. Unfortunately the automatic detection routine was unable to accurately identify the other two-points. In spite of this, a trajectory was manually estimated for the leading-edge and elastic axis markers. By processing the single images by manual selection of markers it was possible to do a more detailed investigation. An investigation about the first LCO, that is above Vcr1, is also carried out. The time interval taken into account is very small (6.9 sec to 7.4 sec) but since the motion is periodic it is sufficient to display the main characteristics. Fig. 18 compares the three markers y amplitudes. The y-amplitude ratio about the rear and centre markers is η=1.247, a 25% increase. The y-amplitude difference between the two points (rear-point and centre-point) is caused by torsion. Fig. 19 displays the evolution of θ with the y displacement with a twist amplitude of 9° and centre point y amplitude (only caused by pure bending oscillation) of 15.8 mm.
Tip twist vs centre marker displacement, before Vcr2 - t ∊ [6.95, 7.35] s.

Three marker y displacement, before Vcr2 – t ∊ [6.95, 7.35] s.

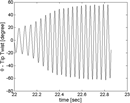
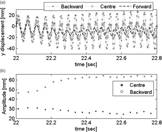
Then further analysis was carried for the time interval capturing the transient form one to another critical condition. Time interval taken into account begins at 22 s and finishes at 22.9 s, for total of 250 frames. Fig. 20 shows the time-history of the twist measured at the tip and the amplitude increase when the Vcr2 is achieved is quite evident. The twist amplitude changed from ±20° to ±60° demonstrating that the trend in Figs. 15 and 16 may be influenced by the tip twist evolution and not by bending. From Fig. 21 it is possible to observe the variation of the centre point flapwise displacement vs θ. Being such marker very close to elastic axis, it seems clear that the maximum y-amplitude of the oscillatory motion decreases, as Fig. 22b, so for backward point the θ contribution influences the graphic as it can see in Fig. 22a showing the trajectories of three markers on wing tip. Forward point displays a decrease of amplitude being in the other side of backward point, so y-direction motion is out-of-phase with the theta motion. Interesting the centre point amplitude that is almost constant in the transition phase being the torsion effect negligible. At 22 s η=1.548 instead at 22.8 s, after the second critical speed, η=2.622 suggesting the twist influence in the y-amplitude oscillation of backward marker. Observing the pictures from High-Speed-Camera, the phenomenon appears to be clear. Last phenomenon that can be seen is the variation of the average position of the wing tip. Fig. 23 shows the change of position both in flapwise and chordwise direction of motion. Probably the motivation can be attributed to the very high angle-of-attack at which the wing is now subjected. At high angle rates, flow separation and dynamic stall dominate the wing dynamics and the wing does not respond promptly to the variation and AoA decreasing the pure bending oscillation (such phenomenon is also observed in(Reference Dowell and Tang9)). Also in Fig. 23, the displacement toward the flow direction is illustrated. The centre point marker draws a figure eight shape and becomes more distinct with the beginning of the new condition at Vcr2. Moreover, the trajectory shift towards the edgewise direction (e.g. flow direction) since the aerodynamic force component in such direction increases for increasing AoA. Fig. 25 shows two frames before and after the Vcr2 in which it is clear the deflection towards the chordwise direction. With respect to modes participation in such condition, by analysing the high-speedcamera pictures, one can observe that above Vcr2 the motion is torsion dominated with a small edge contribution. In phase-plane portraits, in which a variable and its derivative are plotted, an indication of the oscillation motion typology is provided. It is observed in Fig. 24 that the oscillations are periodic and not chaotic, showing clearly the evolution of the two main physical parameters y and θ. For increasing speeds, the twist θ shows the greatest increase in both rotation and speed rotation whereas vertical amplitude decreases with increasing vertical speed. The figure also shows clearly that for increasing speeds the torsional displacement θ increases. As also shown in the earlier Fig. 21, while at t=7 s the torsional displacement θ ∈ [−12°, +8°] at t=22 s, just below Vcr2, θ ∈ [−20°, +20°]. Indeed, the torsion mode, influencing the AoA, becomes larger, while centre point amplitude (elastic axis) is almost constant with a decreasing trend. Therefore the total y amplitude of the backward point grows whereas remains equal for the centre point, less influenced by the torsion mode. Then with the increase of the speed the motion develops an increasing angle-of-attack with a constant bending oscillation until, reached the second critical condition, the AoA value is too high to keep the oscillation trend and a dynamic stall is exhibited due to flow separations.
Twist time-history at the wing tip, V ~ Vcr2 - t ∊ [22, 22.9] s.

Tip twist vs centre marker displacement - t ∊ [22, 22.9] s.

(a) Three marker y displacement (b) centre and backward marker amplitude - t ∈ [22, 22.9] s.

Centre marker trajectory - t ∈ [22, 22.9] s.

Wing position before and after flutter displays.

Phase-plane time histories for (a) twist and (b) flapwise bending, before V cr2 - t ∈ [6.95, 7.35] s for c) twist and d) flapwise bending - t ∈ [22, 22.9] s.

4.2 LCO – Hysteresis
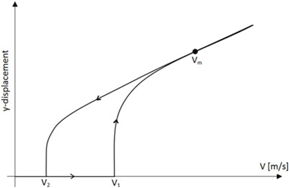
In post-flutter/LCO regime an hysteresis phenomenon is shown. Two experiments were conducted to verify the behaviour. The conditions taken into account are AoA 0° and −1°. The wind-tunnel velocity is increased up to a value just smaller than Vcr2 and then is decreased until the self-sustaining oscillation cease to exist. Unfortunately, in these wind-tunnel experiments it was not possible to record the wind speed, hence it is not possible to display the classical hysteresis graph as function of speed and amplitude. Pictorially, Fig. 26 illustrate the speed and amplitude trend of a general hysteresis manifestation. It is clear that the LCO disappears at a velocity (V2) which is smaller than the one at which the LCO was triggered (V1 = Vcr1). Vm is the maximum speed achieved in the experimental analysis. Unfortunately, the trend of the return curve is not known because of it was not possible to gather amplitude data linked with velocity data. Only two cases are showed in this investigation but several experimental results at different AoA were collected.
General hysteresis behaviour.

AoA 0°
Fig. 27 shows the LCO behaviour. At 5.8 s (V1 = 22.97 ms−1) a LCO is triggered. Speed is increased until 17 s, reaching the max value of Vm = 23.85 ms−1, after which, for safety reasons, it is reduced. The LCO disappears at V2 = 20.77 ms−1, showing a clear difference between the initial and the final speed at which the LCO appears on a ramp up speed and disappears on a ramp down speed. By increasing the wind-tunnel speed both wing amplitude and frequencies increases. Velocity and frequency are related and at same value of velocity a single frequency value is obtained independently of being in the increasing or decreasing speed ramp. Interestingly, before the oscillation disappeared an unexpected growth of amplitude was displayed at 23 s and 25.5 s which was probably caused by inertial effects. Amplitude and frequency are displayed in Fig. 28.
LCO wing response, AoA=0°.

(a) amplitude and (b) frequency variation, AoA=0°.

AoA -1°
At AoA −1° the wing has a negative lift and the nonlinear LCO behaviour is triggered earlier. Initial speed at which the LCO is triggered on a ramp up speed is V1 = 22.74 ms−1 while it disappears on a ramp down speed at V2 = 20.60 ms−1. Maximum speed Vm is reached around 11 s. In previous analysis the motion was regular, instead with negative angle-of-attack the dynamics response changes. Fig. 29 shows the motion as time function. In this case a chaotic behaviour is quite clear and it is persistent until 18 s during the ramp down speed. Fig. 30 shows two FFTs, in the chaotic regime and in the regular LCO regime. The presence of nonlinearities is emphasize in the first of the two FFTs with evidence of super and sub harmonics centred at 5, 10, 15 and 20 Hz. In the LCO regime the dominating frequency is 10 Hz. It is worth noting here that the chaotic results might be due to the transient dynamics of the continuous change in speed, it was difficult to discern or to attribute to other changes. Future tests will assess further this behaviour by performing a number of constant speed investigations. Table 4 shows the speed values at different AoA. By increasing the AoA all speed parameters, V1, V2, and Vcr2, grow. Between −1° and 1°, V1 (equal to Vcr1, i.e. first critical speed) and V2 change of +2.5%, while Vcr2 changes of +5.5%. The results agree well with literature(Reference Brit, Ortega, Tigue and Scott4), in which an increase of such parameters is expected.
LCO wing response, AoA=−1°.

(a) Amplitude and (b) frequency variation, AoA=−1°. (a) time 6 ÷ 18 s (b) time 18 ÷ 34 s.

LCO parameters at several AoA

5.0 NUMERICAL AEROELASTIC INVESTIGATION
The prediction of the dynamic response of aeroelastic systems requires the coupled solution of fluid and structural dynamic problems. There are notably two approaches which can be used. The first approach is termed the monolithic approach, where coupled field equations for the fluid and solid components are solved concurrently. This strongly coupled approach provides superior convergence rates and enables the solution of tightly coupled flow-structure interaction problems, for example where the mass ratio is of the order of unity. However this approach is numerically complex, and often very time intensive, due to the differences in spatial and temporal discretization of each component.
As an alternative, the loosely coupled approach can be considered, where the flow and structural systems are solved cooperatively and sequentially. This approach is a more viable alternative for aerospace aeroelastic systems, allowing for independent numerical schemes for each component. Within a high-fidelity framework, the fluid problem is in this case solved via a computational fluid dynamics (CFD) code and the solid problem is solved via a computational solid dynamics (CSD) code. Nodal information is passed at the fluid-solid interface, and generally requires an interpolation algorithm for grid mapping, since typically coarser meshes are used for CSD and denser meshes used for CFD.
5.1 Governing Equation
The governing equation for a generic three-dimensional undamped aeroelastic system is expressed as:
 $$[{\bf{M}}]\{ {\bf{\ddot x}}\} + [{\bf{K}}]\{ {\bf{x}}\} = \{ {\bf{F}}\} $$
where [M] is the mass matrix, [C] is the damping matrix, [K] is the stiffness matrix, {F} = {F 1, F 2, . . ., F n}T is the force vector and {x} = {x 1, x 2, . . ., x n}T is the displacement vector. The above aeroelastic system can either be solved in the frequency domain or the time domain to determine the flutter condition. While the former is an attractive option for aeroelasticians due to the relatively low computational intensity, its assumption of pure harmonic motion often renders the approach infeasible for capturing nonlinear aeroelastic phenomenon. Alternatively, treating the system in the time domain results in additional fidelity in determining the stability of the aeroelastic system, irrespective of the response or input conditions.
To reduce the number of degrees of freedom in the model, the displacement vector can be treated as the superposition of a subset of the natural modes, i.e.
 $$\{ {\bf{x}}\} = [\Phi ]\{ \xi \} $$
where [Φ] is the modal matrix (normalized by the mass matrix) and {ξ} = {ξ 1, ξ 2, …, ξN,}T the modal coordinate vector. By substituting Equation (2) into Equation (1) and rearranging, the aeroelastic system is expressed in modal form:
 $$[{\bf{I}}]\{ \ddot \xi \} + \left[ {\matrix{ {\omega _1^2} & 0 & \ldots & 0 \cr 0 & {\omega _2^2} & \ldots & 0 \cr \vdots & \vdots & \ddots & \vdots \cr 0 & 0 & \ldots & {\omega _N^2} \cr } } \right]\{ \xi \} = {[\Phi ]^T}\{ {\bf{F}}\} $$
where [I] is the identity matrix and ω i is the i th natural frequency. The modal system uses a truncated number of modes M << n, sufficient to capture the fundamental dynamics of the structure.
5.2 CFD Model
The general purpose finite volume ANSYS Fluent(1) R16 is used for higher-fidelity prediction of the transient aerodynamic loading. ANSYS Fluent solves conservation equations for mass and momentum (the Navier-Stokes equations), written in integral form as:
 $${{d\rho } \over {dt}} + \nabla (\rho {\bf{u}}) = 0$$
 $${d \over {dt}}\int_V \rho \phi dV + \oint_A \rho \phi u\,\, \cdot {\rm{ }}dA = \oint_A \Gamma \nabla \phi {\rm{ }} \cdot \,\,dA + \int_V {{S_\phi }} dV$$
where ρ is the fluid density, u is the flow velocity vector, is the diffusion coefficient, S ϕ is the source term for the generic scalar ϕ and A is used to represent the boundary of the control volume, V.
The pressure and velocity are solved sequentially through the SIMPLE algorithm, and all advective terms of the transport equations are discretized by a second-order upwind scheme, whereas all diffusive terms are discretized by central differencing.
To accurately account for the effects of aerodynamic nonlinearities, such as boundary layer separation/dynamic stall at high twist angles, the two-equation k − ω SST model by Menter is used to predict the value of turbulent viscosity in the flow. This model is extensively used in both academia and industry most notably for its treatment of aerodynamic (undergoing an adverse pressure gradient) flows. For time integration, a dual time-stepping scheme is employed with second-order implicit temporal discretization. The time-step selected was based on temporal discretization of the highest natural frequency by 30 steps, with approximately 5-10 inner iterations to ensure residual convergence of 𝒪 (10−5).
5.2.1 Computational Grid
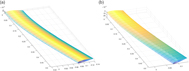
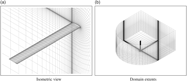
Due to the highly flexible structure, and in the interests of preserving mesh quality with the large scale deformations, a C-type structured grid, with domain extents of 15 chord lengths in all directions is generated. A grid of (80×40×25) elements is generated and deemed suitable suitable for grid sensitivity and verification with the first grid point corresponding to y +𝒪(10). Fig. 31 illustrates isotropic views of the grids considered for the current study.
Computational grids generated for aeroelastic analysis.

5.2.2 Grid Deformation
The dynamic mesh model in ANSYS Fluent is used to implement the modal deformation of the wing. The motion description provided by the modal superposition solver is used to prescribe nodal displacements using the DEFINE_GRID_MOTION user defined function (UDF) macro. The components of the modes shapes considered are allocated to ANSYS Fluent memory and stored using the node memory N_UDMI macro. Fig. 32 shows pressure distribution of the wing undergoing modal deformation.
Contours of static pressure for the wing under modal deformations.

To ensure a sufficient grid quality during deformation, and to maintain a consistent grid resolution close to the deforming boundary, the diffusion-based smoothing technique is adopted. This model aims to have the interior elements absorb the mesh deformation, whilst aiming to preserve the mesh resolution and topology near the deforming boundary.
5.3 Aerodynamic Drag Polar
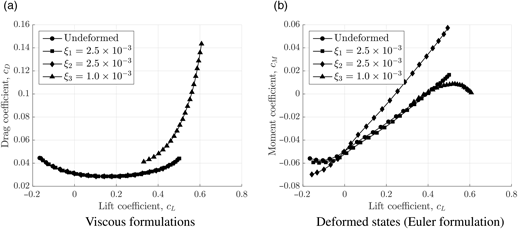
The aerodynamic performance of the wing is first considered using steady-state simulations at velocity U ∞ = 30 m/s. Fig. 33 presents the drag and pitching moment polars for the high aspect-ratio wing deformed by each mode shape at a generalized displacement of the ξ = 1 × 10⁻³. As expected, the first two modes have relatively little steady-state effect on the aerodynamic performance, due to the lack of any significant torsional component. The edge mode induces a larger pitching moment, which induces a twist of the wing, and is yet another indication of the nonlinear interaction of the torsion and edge modes. The torsional mode, produces an aggressive lateral shift in the drag polar (even at lower generalized displacements) due to the geometrical twist of the wing. The vertical shift is a result of massive separation from the leading edge.
Aerodynamic performance curves.

5.4 Static Trim Analysis
A characteristic of the flexible wing is the relatively large static trim position when exposed to loading. Performing a static trim analysis (essentially solving for Equation (3) but disregarding the acceleration and velocity terms) can assist in determining the contribution of weight relative to aerodynamic loading. For this analysis, at α = 0° and U ∞ = 30 m/s, the mesh is iteratively deformed in a quasi-steady framework until Δξ → 0, which for this system occurs after five iterations. The wing-tip deformations due to self-weight and total deformation are shown in Fig. 34(a) and the corresponding span wise isometric views are shown in Fig. 34(b). Under self-weight, the force is due to gravitational acceleration and is of the form of pure vertical loading, resulting in pure bending and a downwards shift of approximately 25% of chord. Under pure bending, the lift coefficient of the wing is similar to the undeformed configuration of c L = 0.208. When exposed to aerodynamic loading, the pitching moment results in a slight torsional (nose-down) motion and an overall deformation of close to 38% of chord and the wing produces a down force of c L = −0.044. Including the weight component results in a further reduction in the lift coefficient to c L = −0.055, and an overall deformation of close to 62% of chord. Although the static trim position is primarily dependent on the aerodynamic loading, the indicial response analysis performed in the following subsection highlights the nonlinear scaling in transient effects at larger deformations. This further reiterates the inherent flexibility of high aspect-ratio wings and confirms the requirement to consider the wing self-weight for the subsequent dynamic aeroelastic analyses.
Static trim locations when exposed to various loads.

5.5 Response to Transient Impulse
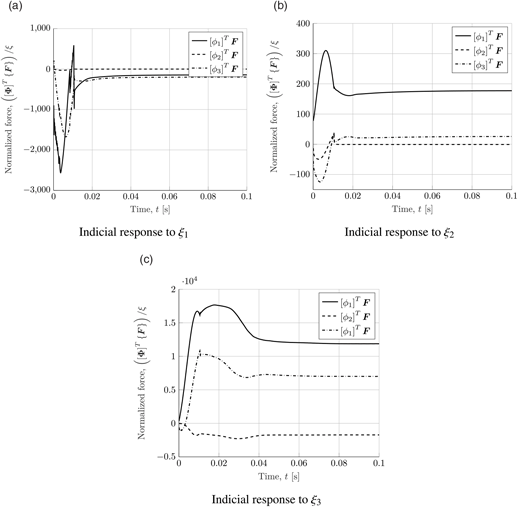
Presented is the transient response to a step impulse in each mode shape to determine the transient aerodynamic shift in loading and the amount of aerodynamic damping. The responses are represented in terms of the generalized aerodynamic force [Φ]T {F}. This is also known as the Indicial response of the aeroelastic system. The system is ramped from zero displacement to the fully deformed state (at t = 0.05 s) using a polynomial step input. As per the static analyses presented earlier, the final deformed state is equivalent to a generalized displacement of ξ = 1 × 10⁻³.
It is shown in Fig. 35 that the effect of edge motion (i.e. the second mode shape) is insignificant to the other mode shapes, especially compared with the torsion modes. This is due to the fact that only the drag force (i.e. F x) is likely to be active here, and is a relatively small force component. A large transient effect is on the other hand seen for the first mode shape (pure bending). This is owing to the relatively large influence of the lift force component (i.e. F y). A transient peak is observed before close to t = 0.05 s before the response damps and asymptotes to the quasi-steady value. As expected, due to the large geometrical twist, the largest variation in generalized loading is observed for the torsion modes. However, these modes also seemingly have less unsteady effects, as the response quickly asymptotes to the quasi-steady value with a negligible transient peak appearing.
Aerodynamic performance curves.

An insight into the non-linearity of the system can thus be observed by incrementally changing the value of Δξ and observing whether the response scales linearly. Fig. 36 shows the response of the generalized aerodynamic forces when the wing undergoes deformation by Φ3, according to an incremental step impulse in the generalized displacement ξ 3. The response seemingly begins to scale linearly with smaller values of ξ 3, but essentially illustrates large transient effects as ξ 3 > 2 × 10⁻³. The transient peak and aerodynamic damping progressively becomes more aggressive, suggesting the appearance of a strong aerodynamic non-linearity at larger displacements. To put in a clearer context to the reader, a generalized displacement of ξ 3 > 2 × 10⁻³ is approximately equivalent to the wing deforming by 25% of the chord. Two interesting conclusions potentially arise from this study. The first, is that the system behaves in a rather stable fashion for small amplitudes, and transient instabilities scale non-linearly with uniform incremental changes in the impulse. The second, is that the inherent nonlinear nature of the system puts further doubt on the predictions of a frequency domain flutter analysis, especially in the context of using CFD to calculate the generalized aerodynamic force.
Transient aerodynamic response to modal impulse.

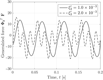
The non-linearity of the system is further evident from the response to a periodic input in the torsional mode, which is shown in Figs 37 and 38. At the lower value of ξ = 1.0 × 10⁻³, the response is close to a single harmonic. At the larger value of ξ = 2.0 × 10⁻³, the wing undergoes a dynamic stall due to massive flow separation. Multiple harmonics are now visible resulting in actuating and restoring forces. This is most likely a predominant reason for the appearance of sub-critical limit-cycle response for the flexible wings.
Transient aerodynamic response to periodic changes in torsional displacement.

Streamlines at peak displacement.

5.6 Linear flutter analysis
The iterative p-k method(Reference Hassig14) is used to study the linear flutter solution and is a commonly used approach in industry(Reference Hodges and Alvin Pierce11). The aeroelastic system described by Equation (3) can be transformed to the frequency domain to give:
 $$\left({[{\bf{I}}]{p^2} + \left[ {\matrix{ {\omega _1^2} & 0 & \ldots & 0 \cr 0 & {\omega _2^2} & \ldots & 0 \cr \vdots & \vdots & \ddots & \vdots \cr 0 & 0 & \ldots & {\omega _N^2} \cr } } \right] - {1 \over 2}\rho {U^2}[{\bf{Q}}(ik)]{\rm{ }}} \right)\bar \xi = 0$$
where, [Q(ik)] is the aerodynamic influence coefficient (AIC) matrix obtained using the impulse response in Section 5.5. The frequency domain AIC is obtained from the time-history generalized aerodynamic forces [Φ]T {F} using standard Fourier transform techniques(Reference Lee-Rausch and Baitina12).
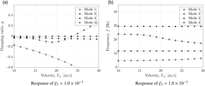
The velocity-damping (V − g) and velocity-frequency (V − f) relation for each mode are shown in Fig. 39(a) and Fig. 39(b), respectively. The p-k method is strictly only valid for low damping g values and is accurate at the flutter point where g = 0 corresponding to velocity U ∞ = 23.8m/s for the torsional mode. The frequency corresponding to this mode at this velocity is 19.28Hz and is the flutter frequency. Since the wing experiences non-linear behavior structurally and aerodynamically, as shown earlier, it is expected that LCO is observed at a velocity and frequency below the values identified using linear techniques. Frequency domain techniques, such as the one used here, are limited and time domain methods would be required to identify critical speeds and frequency for LCO and flutter and is described in the following section.
Linear flutter analysis for the HALE wing.

5.7 Time domain analysis
The uncoupled equations, as described by Equation 3, representing the aeroelastic system are solved explicitly using a fourth-order Runge-Kutta time-advancement algorithm to obtain the generalized velocity  $\mathop \xi \limits^ \bullet $ and displacement ξ. The mesh nodes can then be dynamically updated from time t to t + 1, according to the generalized displacement ξ i of the i-th mode shape. The response using the RANS CFD model is discussed here in detail.
For the dynamic analysis, beginning from a converged steady solution, the wing is initially perturbed sinusoidally about its natural modes for one cycle. At the end of this forced cycle, the system is allowed to transiently evolve by its own self-induced loads as dictated by the solution of Equation (3) at time t. The response is computed for increasing values of the free stream velocity U ∞, to determine the location of the critical boundaries at an angle α = 0°.
When the velocity U ∞ < ULCO, a damped response is obtained, as shown in Fig. 40. The displacement at the wing-tip is monitored over time, as it converges to the trim value. This is evident from the modal displacement curves, which show the convergence of the base bending and torsion modes. The self-weight is the primary contribution to the bending displacement, whereas the twisting of the wing is dependent on the aerodynamic static load.
Damped response at U ∞ < U LCO.

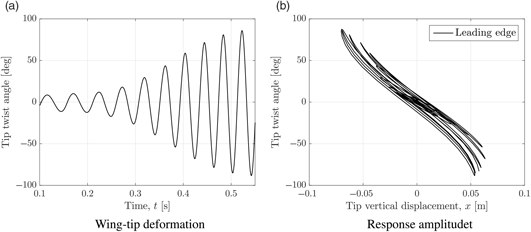
Within the range of U LCO < U∞ < UF, a bounded limit cycle is obtained with the response shown in Fig. 41 where the time history of the leading and trailing edge tip displacements are shown in Fig. 41(a), the phase-plane of the vertical displacements and twist angles are shown in Fig. 41(b), the time history for the dominant modal co-ordinate shown in Fig. 41(c) and the Frequency Response Function (FRF) of the trailing edge tip displacement shown in Fig. 41(a) indicating peaks at the LCO frequency and its superharmonic. The amplitude of the limit-cycle is marginally dependent on the flow velocity. The tip rotation within this regime is θ= 15° which is slightly below that reported in the experimental study (Section 4.1) which was recorded at 17° < θ < 20°. As shown, this corresponds to a maximum torsional modal displacement of ξ3 = 1 × 10⁻³. This would suggest that the subcritical LCO is largely induced by the aerodynamic nonlinearity resulting from flow separation at higher twist angles. The normalised frequency response function is shown in Fig. 41(d). Small peaks are visible at each of the modal frequencies, with a strong peak visible at approximately fLCO ≈ 17[Hz], which is higher than that reported from the experimental study in Section 4.1.
Limit-cycle response at U LCO < U∞ < UF.

At U ∞ >U F, the wing tip deformation rapidly diverges and the amplitude is significantly increased. In fact, this condition generally results in severe degradation in quality of the mesh, due to severe twisting of the wing. Fig. 42 shows a sample time-history for the wing in flutter. The tip rotation within this regime increases to approximately θ = 90°, before the CFD solver diverges due to inverted elements.
Response forU ∞ >U F.

The oscillation mode in flutter is typically dominated by torsion due to the significantly higher twist angle. As per the case U LCO < U∞ < UF, the excitation in edge and bending modes is negligible by comparison. In Fig. 43, several still frames corresponding to a single oscillation cycle from the dynamic analysis are captured.
Still frames captured for one complete cycle of oscillation for U LCO < U∞ < UF.

Table 5 documents the results for the dynamic response. The importance of capturing the aerodynamic field correctly is shown when comparing to the Euler result, which neglects profile drag of the wing, and fails to capture important phenomena such as the decambering effect and boundary-layer separation, which are also regarded as aerodynamic damping effects. Here, the loads experienced on the wing at a significantly lower velocity are required to initiate aeroelastic instabilities, and the critical margin U LCO < U∞ < UF is reduced significantly.
Results of the numerical aeroelastic model

6.0 CONCLUSIONS
Numerical and experimental investigations are carried out to understand the nonlinear effect due to large deformation on the dynamic behaviour of flexible high-aspect ratio wings. The study demonstrates that, among others, edge and torsion frequencies are significantly affected by large deformation. That is, for increasing tip displacement, a stronger nonlinear coupling between these frequencies is experienced. The study also demonstrates the influence of initial tip displacement on the dynamic properties of the wing spar and its change with respect to the properties of the cross section. Indeed, a simple rectangular shape showed higher influence than an I or U cross sections. For an equal tip displacement of 20% of the beam length, the rectangular cross-section beam displayed changes in natural frequencies up to 60% (1-R 1st Edge) and up to 35% (1-I 1st Edge), respectively. The experimental investigations were developed in order to avoid interference between beam dynamical behaviour and weight used to generate deflection. Then, self-weight generated the deflection and the increase of the beam length allowed the growth of the vertical tip displacement. Experimental investigation confirmed the numerical predictions showing good correlation. Experimental investigations of the aeroelastic behaviour of typical high-aspect ratio wings was also considered in order to assess the nonlinear effect due to large deformation. An additively manufactured prototypical modular wind-tunnel model has been designed, assembled and tested experimentally in a wind-tunnel. The growth of the tip displacement, to a strong geometrical nonlinear state, produced interesting coupling between the frequencies. Indeed, nonlinearities produced a change in natural frequencies as well as coupling between several modes causing complex aeroelastic behaviour. The presence of aerodynamic nonlinearities, due to flow separation and wing stall, is evident particularly at high angle-of-attack, and should be taken into account. Results showed that due to high flexibility, wing obtains two critical velocities. When the first critical state is reached an LCO occurs. By continuously increasing the wind speed, the tip twist amplitude increases, and the wing exhibits dynamic stall governing the new LCO behaviour. As a result, the vibration frequency increased and could lead to a critical dynamic instability. Furthermore, an evaluation of the change of the critical speeds was performed by increasing the AoA showing an increase of 2.5% and 5.5% for V1cr and V2cr respectively. As evidenced from the experimental findings, it is not possible to separate the nonlinear aerodynamic and geometrical contributions as often done in structural dynamic analysis. Indeed, these two phenomena are strictly connected given the low stiffness and resulting large deformation. Because of wing torsional stiffness is very low, large AoA and deflection are expected, and being the aerodynamic distribution function of wing displacements, if the displacements are nonlinear then also the aerodynamic loads are expected to be nonlinear. As a result, strong aeroelastic nonlinear instabilities, due to low stiffness in both torsion and bending direction are expected. Lastly, the investigation on the hysteresis of LCO phenomenon has led to confirm the difference between the initial and final oscillation speed at which LCO starts and stops during ramp up and ramp down speed. Indeed, the LCO starts at velocity V1cr higher than the speed V 2cr at which the LCO response decays to a stable state confirming results reported in the literature. The study conducted at several AoA demonstrated 9% speed reduction between V1cr and V2cr.