INTRODUCTION
With the advent of mechanization, agriculture has lost much of its ability since the middle of last century to manage the spatial and temporal variability that characterizes the crop within individual production units. The search for cost rationalization, together with growing environmental consciousness, is guiding scientific research towards the development of ‘intelligent’ agricultural machinery capable of rapidly performing site-specific management of crops. This turning point must take into account knowledge of in-field crop variability (Basso et al. Reference Basso, Fiorentino, Cammarano, Cafiero and Dardanelli2012; Diacono et al. Reference Diacono, Castrignanò, Troccoli, De Benedetto, Basso and Rubino2012). For the monitoring of qualitative and quantitative parameters of vegetation, previously carried out through manual and punctual surveys, remote sensing techniques can now be applied via the development of a wide variety of specific vegetation indices. In fact, the vegetation indices have proved they are closely related to a number of biophysical properties and plant processes, including primary production, proportion of vegetation cover, green leaf biomass and carbon dioxide fluxes.
The Normalized Difference Vegetation Index (NDVI) is probably the best known and most widely used index that is directly related to photosynthetic capacity, and therefore to the energy absorption of plant canopies (Inoue et al. Reference Inoue, Peñuelas, Miyata and Mano2008). Observations of NDVI have frequently been applied to understand the characteristics and variability of vegetation from local to global scales.
It shows strong positive relationships with the changes in leaf pigment concentration, above-ground total dry matter accumulation, green leaf biomass, leaf area index (LAI), vegetation water content (Ceccato et al. Reference Ceccato, Flasse, Tarantola, Jacquemoud and Grégoire2001; Aparicio et al. Reference Aparicio, Villegas, Araus, Casadesus and Royo2002; Sims & Gamon Reference Sims and Gamon2003), crop response to nitrogen (N) crop status or N fertilization supply (Tilling et al. Reference Tilling, O'Leary, Ferwerda, Jones, Fitzgerald, Rodriguez and Belford2007). However, in describing the vegetation canopy, the adoption of NDVI and other visible-near infrared indices is limited by the noise effects due to the atmosphere, soil background and saturation of the index by a dense canopy. Good results have also been obtained with indices based on narrow waveband intervals, in particular the red-edge (NDVIRE) which is less sensitive to saturation (Delegido et al. Reference Delegido, Verrelst, Meza, Rivera, Alonso and Moreno2013) and the Modified Chlorophyll Absorption in Reflectance Index. Compared to NDVI, these indices have demonstrated better correlations with the nutritional status of crops and plant leaf chlorophyll content (Perry & Roberts Reference Perry and Roberts2008). Other indices have been improved to reduce the source of variation due to soil background. Among these, the Soil Adjusted Vegetation Index (SAVI) (Huete Reference Huete1988) and the ‘Optimized’ version (OSAVI) have been used widely (Rondeaux et al. Reference Rondeaux, Steven and Baret1996).
Currently, remote sensing is used to provide observations on crop growing conditions over large areas at regular time intervals. However, the use of remote sensing as an operational tool in crop monitoring/forecasting systems has mainly been related to government agriculture and food policies and to assess their impact on rural economies and the environment at a regional/global level. Such operational systems are based on the relationships between remote-sensed indices, crop growth and crop production indicators (Maselli & Rembold Reference Maselli and Rembold2001; Mkhabela et al. Reference Mkhabela, Bullock, Raj, Wang and Yang2011).
One of the limits of remote sensing used in supporting systems for agronomic management at the farm level has been the lack of a suitable spatial and temporal resolution of the imagery capable of following crop development in small areas. In fact, up until a few years ago, moderate–high spatial resolution imagery (10–30 m) had low revisit frequency (e.g. Landsat/Enhanced Thematic Mapper), whereas higher temporal resolution was often characterized by low spatial resolution (250–1000 m) (e.g. Moderate Resolution Imaging Spectroradiometer (MODIS)). Recently, new commercial satellites have been launched which combine high resolution sensors with high revisit frequency (e.g. Quikbird, WorldView and RapidEye) (Vuolo et al. Reference Vuolo, Atzberger, Richter, D'Urso, Dash, Wagner and Székely2010).
Another important characteristic for making the remote sensing information really useful is the time that elapses from commissioning the imagery to satellite acquisition, and from satellite acquisition to the delivery of the processed imagery (Beeri & Peled Reference Beeri and Peled2009). The length of these times depends firstly on atmospheric conditions and on the revisit frequency of satellites, and secondly on the service provider. With recent commercial satellites, such as WorldView and RapidEye, the time elapsing from data acquisition to data restitution is short. This makes the use of spectral imagery possible in the operational management of many agricultural activities based on specific models. Said models take into account different needs and parameters related to crop cultivation, such as water stress (Altenbach Reference Altenbach2012), N status (Cammarano et al. Reference Cammarano, Fitzgerald, Basso, Chen, Grace and O'Leary2011; Eitel et al. Reference Eitel, Vierling, Long and Hunt2011), plant vigour and biomass growth (Filella & Peñuelas Reference Filella and Peñuelas1994; Broge & Leblanc Reference Broge and Leblanc2001), grain yield forecast (Labus et al. Reference Labus, Nielsen, Lawrence, Engel and Long2002), diseases (Nicolas Reference Nicolas2004), weed control (Yan et al. Reference Yan, Jones, Villette, Paoli, Gée, Bingham and Lam2012), soil conditions and meteorological trends (Dalla Marta et al. Reference Dalla Marta, Grifoni, Mancini, Zipoli and Orlandini2011; Guasconi et al. Reference Guasconi, Dalla Marta, Grifoni, Mancini, Orlando and Orlandini2011; Moldestad et al. Reference Moldestad, Fergestad, Hoel, Skjelvag and Uhlen2011). Other studies have integrated remote sensing data with crop simulation models for assessing crop yield on a regional scale (Mkhabela et al. Reference Mkhabela, Bullock, Raj, Wang and Yang2011).
Several studies have been developed to analyse the temporal variability of durum wheat production in the aim of forecasting final grain yield and quality (Dalla Marta et al. Reference Dalla Marta, Grifoni, Mancini, Zipoli and Orlandini2011) and a large number of works have also addressed the issue of spatial variability at the field level. However, a few of these studies have assessed the possibility of remote monitoring of crops and its potential role in obtaining information well in advance of the wheat harvest characteristics (Cammarano et al. Reference Cammarano, Fitzgerald, Basso, Chen, Grace and O'Leary2011; Basso et al. Reference Basso, Fiorentino, Cammarano, Cafiero and Dardanelli2012). Precision agriculture commercial systems based on remote sensing, implemented in different countries since the 1980s (Zhang et al. Reference Zhang, Wang and Wang2002), are improving thanks to the continuous technological development of satellite platforms and the technical equipment used.
MODIS and Landsat products have been used successfully for wheat yield estimation (Lobell et al. Reference Lobell, Asner, Ortiz-Monasterio and Benning2003). More recently, Envisat Advanced Synthetic Aperture Radar and Landsat Thematic Mapper data were applied to monitor field conditions and to predict yield and grain protein content of winter wheat (Liu et al. Reference Liu, Wang, Bao, Huang, Ma and Zhao2006).
Farmstar is an example of a commercial remote sensing service for precision agriculture, which uses a combination of satellite and airborne remote sensing images for the management of wheat N fertilization widely adopted in France (Blondlot et al. Reference Blondlot, Gate, Poilvé and Stafford2005).
Nevertheless, in environmental conditions characterized by high fragmentation and small fields, their complex morphology and consequent high variability require in-depth investigation of the biological significance to be attributed to the radiative response of the canopy. In addition, there are only limited reports concerning the possibility of forecasting wheat grain quality from remote sensing data (Hansen et al. Reference Hansen, Jørgensen and Thomsen2002; Basnet et al. Reference Basnet, Apan, Kelly, Jensen, Strong, Butler and Lees2003).
Based on these considerations, the objective of the current research was to assess the potential use of high-resolution satellite imagery for monitoring durum wheat growth and development, aimed at forecasting grain yield and protein content. To best represent the natural variability of agricultural production, the study was conducted on wheat fields managed by local farmers.
MATERIALS AND METHODS
The research was carried out during 2011/12 in Val d'Orcia (Tuscany), a hilly area of Central Italy characterized by a typical Mediterranean climate. In this area, durum wheat (Triticum durum Desf., Triticum turgidum L. subsp. durum) is the main crop with an average cultivated area of c. 1000 ha/year. The main soil type is clay-loam, according to the USDA classification (Soil Survey Staff 1998).
The experiment was designed for the purpose of amplifying the natural spatial variability of crop performance in the study area, already particularly high due to a complex hilly morphology.
To this end, three different farms were chosen in an area of c. 50 km2 (42°59′N, 11°45′E, 303 m asl; 42°59′N, 11°45′E, 384 m asl; 43°09′N, 11°39·52′E, 320 m asl). On each farm two varieties of durum wheat, Miradoux and Claudio, were sown and three N fertilization treatments were performed following a randomized block design with three replicates, for a total of 18 plots with an area of 3 ha each. A sub-area of 15×15 m was selected randomly from each plot. In each sub-area, five samples of plants were collected from an area of 0·4 m2 each following an X-scheme. Samples were taken three times during the crop cycle: at the start of stem elongation (12 April, growth stage (GS) 30), anthesis (5 May, GS65) and physiological maturity (28 June, GS90) (Zadoks et al. Reference Zadoks, Chang and Konzak1974). The first two samplings were performed at the same time as the satellite imagery acquisition.
During the first two samplings, non-destructive measurements of LAI and SPAD were performed on the samples through a portable ceptometer (AccuPAR LP-80) and a handheld SPAD meter (Minolta Chlorophyll Meter SPAD-502), respectively. Wheat plants were then collected for the destructive measurements. The dry weight of above-ground biomass (g/m2) was determined by drying the fresh samples in an oven at 105 °C for 24 h. Nitrogen concentration (mg/g) in the crop was measured with the analyser elements ‘Flash EA 1112’. Total N content (g/m2) was obtained by multiplying N concentration by the biomass dry weight.
During the last sampling, only the destructive measurements were carried out on biomass and grain. The yield (g/m2) was recorded through a precision mini-combine by determination of the grain dry weight after drying (105 °C for 24 h). The grain protein concentration (mg/g) was measured with the Infratec System 1241 Grain analyser. The total protein content (g/m2) was finally determined by multiplying protein concentration by grain yield.
The trend of crop data was analysed at each survey time by computing the average, maximum and minimum values observed in the study area and calculating the standard deviation (SD) and coefficient of variation (CV) between the plots. Each field sampling was georeferenced with a portable GPS (Juno™ ST handheld).
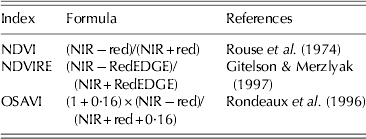
At the same time as the field samplings, multispectral remote sensing data were acquired by the RapidEye, which carries a multi-spectral sensor that records radiance in five broad bands of the electromagnetic spectrum corresponding to blue (440–510 nm), green (520–590 nm), red (630–685 nm), red-edge (690–730 nm) and near-infrared (NIR) (760–850 nm). The sensors provide a spatial resolution of 5×5 m and satellites have a daily (off-nadir) and 5·5 day (at nadir) revisit time. The spectral bands used for the study were those between 630 and 850 nm and more specifically the red, red Edge and NIR. Satellite imagery was processed by georeferencing and orthorectification. Products delivered by RapidEye are already corrected radiometrically: atmospheric correction was performed by means of the atmospheric and topographic correction ground reflectance workflow of a PCI Geomatica 2013 (PCI Geomatics Inc.). The following vegetation indices were calculated and extracted: NDVI, NDVIRE and OSAVI (Table 1).
Vegetation indices used

NDVI, Normalized Difference Vegetation Index; NIR, Near Infra-Red; NDVIRE, RedEdge Normalized Difference Vegetation Index; OSAVI, Optimized Soil Adjusted Vegetation Index.
The values of remotely sensed vegetation indices were extracted from satellite imagery at the points corresponding to the georeferenced ground observations. Specifically, each extracted value resulted from the average of the values of the five pixels around each reference point on the ground.
Statistical analysis was performed on ground measured data and remotely sensed data. Linear regression analysis was carried out between the crop parameters (dry weight, N content and N concentration of biomass, LAI) and the vegetation indices, recorded on the same dates (GS30 and GS65). The same analysis was carried out between the harvest parameters (yield, grain N content and concentration) and the indices recorded at GS30 and GS65 in order to assess their ability to supply information on crop productive performance in advance. Finally, the correlations were also investigated between the crop parameters observed at GS30 and GS65 and the harvest parameters, taking into account the average values per plot.
RESULTS
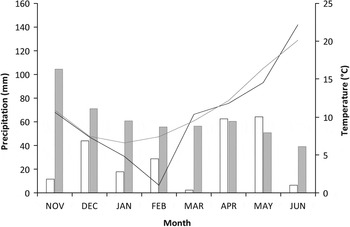
In general, the meteorological course showed some anomalies in the autumn and winter periods (Fig. 1). In particular, precipitation during the November–March period was almost 70% below the long-term average (1961–1990), with an accumulated rainfall of 104·7 mm (measured at Castiglion d'Orcia station, 4–15 km away from the various experimental fields). At the same time, during January and February, temperature was particularly low. However, these anomalies did not affect the regular development of the crop due to a normalization of climatic parameters during the following months, which have a greater impact on the phenology.
Climograph of the study area during durum wheat cultivation period (November–June). Grey bars and line represent the climatic average (1961–1990), whereas the empty bars and black line represent rainfall and temperature for the 2011/12 season.

Relations between vegetation indices and crop parameters at GS30 and GS65
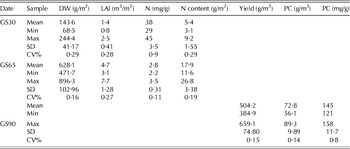
At the start of the stem elongation stage (GS30), the mean biomass dry weight was 143·6, the mean LAI was 1·44, whereas the biomass N concentration was 38 mg/g (Table 2).
Crop growth and yield parameters measured at GS30, GS65 and GS90

DW, dry weight; LAI, leaf area index; N, nitrogen; PC, protein content; SD, standard deviation; CV, coefficient of variation.
At anthesis (GS65), biomass dry weight increased up to 628 g/m2, LAI rose to a mean value of 4·75 and the N concentration of plants decreased to c. 285 mg/g (Table 2).
At harvest, the average yield was c. 504 g/m2. The grain protein concentration, which is related to the harvest quality, showed a mean value of 145 mg/g with extremes of 158 and 121 mg/g. Considering the total protein production, the average was 728 mg/g (Table 2).
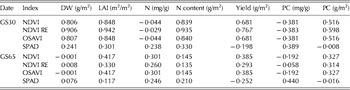
At GS30, all the indices showed a positive and highly significant relationship with biomass weight. In particular, as regards the remotely sensed indices, the best correlation was observed with NDVIRE (r=0·906, P⩽0·001) (Table 3), whereas in the case of the relationship with plant N status, none of the indices were able to describe the N concentration. However, when considering the total quantity of N, all the indices were highly correlated. Among the imagery indices, the best correlation coefficient was found for NDVIRE (r=0·935, P⩽0·001) (Table 3).
Correlation coefficients between the selected indices at GS30 and GS65 and the crop parameters and final production

DW, dry weight; LAI, leaf area index; N, nitrogen; PC, protein content; NDVI, Normalized Difference Vegetation Index; NDVI RE, RedEdge Normalized Difference Vegetation Index; OSAVI, Optimized Soil Adjusted Vegetation Index.
Statistical significance: P⩽0·05 for r⩾0·4555, P⩽0·01 for r⩾0·571, P⩽0·001 for r⩾0·6932.
At GS65, the results were completely different, with no correlations observed between the crop parameters and the indices (Table 3).
Relations between vegetation indices at GS30 and GS65 and harvest characteristics
At GS30, NDVIRE showed the highest correlation coefficient (r=0·767, P⩽0·001) and NDVI, NDVIRE and OSAVI also described the total protein production with which they were positively correlated. As regards the indices derived from ground measurements, SPAD showed no relationship with harvest parameters. At GS65, no relationships were observed.
Relationships between crop parameters at GS30 and GS65 and final harvest characteristics
In order to explain the relationships between the final production and the indices measured on the two dates, 3 and 2 months before harvest, respectively, it is necessary to investigate how crop parameters observed from destructive and non-destructive measurements and final production are related to each other.
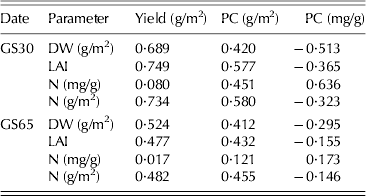
With regard to GS30, the above-ground biomass accumulated from emergence to stem elongation was strictly related to the final yield (Table 4).
Correlations between crop parameters at GS30 and GS65 and the final production

PC, protein content; DW, dry weight; LAI, leaf area index; N, nitrogen.
Statistical significance: P⩽0·05 for r⩾0·4555, P⩽0·01 for r⩾0·571, P⩽0·001 for r⩾0·6932.
As far as the qualitative characteristics of grain were concerned, the protein concentration had a weaker relationship with the crop parameters during the growing period. The best correlation was found between the grain protein concentration and the plant N concentration at GS30; however, the latter is the more difficult to determine via the use of remotely sensed indices. A negative relationship indicates that the increase in the biomass corresponds to a decrease in grain quality.
It is interesting to observe that there was no direct correlation of the protein content with either the biomass or the crop N concentration, whereas their combination, namely, the quantity of N/m2, gave the best correlation (r=0·580, P⩽0·01) with the grain protein content. The important role of LAI in determining the final production was once again confirmed.
As regards GS65, it has been confirmed how the crop parameters observed provide less information about the characteristics of the final production, despite approaching harvesting time. To explain this, it is necessary to compare the crop parameters at the two different stages.
A positive correlation exists within the same parameters on the two dates, showing how the advantages acquired from plants in the initial phase were maintained during the rest of the cycle. Nevertheless, a decrease in their variability was also observed. In fact, the variability coefficient of the biomass and plant N content dropped from 0·29 to 0·16 and from 0·29 to 0·19, respectively, between GS30 and GS65. As a result, during anthesis most of the relationships between crop parameters and final production were not significant (Table 4).
DISCUSSION
Relations between vegetation indices and crop parameters at GS30 and GS65
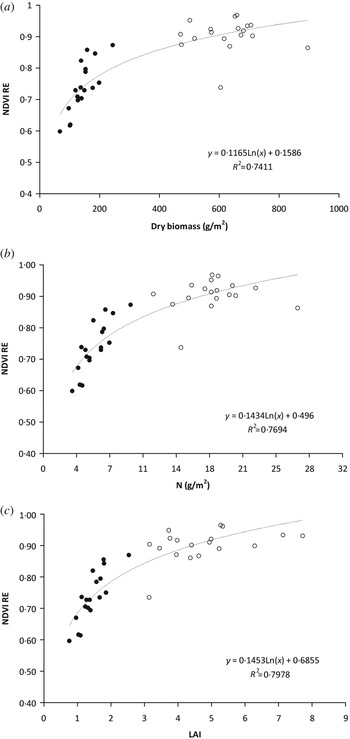
The current results revealed that the possibility of describing and monitoring the crop growth and production by means of remote sensing was evident at GS30, whereas at GS65 the indices completely lost this ability. These results can be partially explained by taking into account the saturation effect of indices that occur over time in monitoring the quantitative parameters (Fig. 2). The radiometric response of the wheat canopy during the growing period is not linear: in fact, NDVI is very sensitive to changes in the canopy when LAI is low, then is useful for early season estimation, becoming saturated as the wheat canopy closes (Aparicio et al. Reference Aparicio, Villegas, Casadesus, Araus and Royo2000; Dang et al. Reference Dang, Pringle, Schmidt, Dalal and Apan2011). Although the narrower wavebands are normally used for wheat status monitoring, Li et al. (Reference Li, Miao, Hennig, Gnyp, Chen, Jia and Bareth2010) found that the red edge band was more effective when canopy was not closed (Diacono et al. Reference Diacono, Rubino and Montemurro2013).
Relationship between the index NDVIRE and (a) dry biomass, (b) LAI and (c) nitrogen content. Solid circles represent values at GS30, open circles represent values at GS65.

The high resolution of satellite imagery could also affect the correlation between the vegetation indices, due to shadows and structural differences at the canopy level (Diacono et al. Reference Diacono, Rubino and Montemurro2013). The combination of these two effects was probably the cause of the lack of correlation between remotely sensed information and crop status at anthesis.
When considering the N concentration, the indices also showed poor correlation in the pre-anthesis period. This could be explained by the inability of the satellite sensors to receive information from the lowest layers of the canopy, limiting their analysis to the top layer, which in the case of wheat is mainly represented by leaves.
However, in wheat, N accumulates not only in the leaves but also a significant proportion accumulates in the stem (Dalling Reference Dalling, Harper, Schrader and Howell1985). The N reserves of stem were correctly taken into account by the analytical determination of total crop N, while it was only partially considered using the indices based on remotely sensed imagery or SPAD measurements.
In short, the results suggested that the use of remotely sensed vegetation indices, such as NDVI and NDVIRE, could be an interesting option for monitoring crop performance. In particular, their capacity to capture the spatial variability of crop growth and production is evident during the stem elongation stage, during which the crop canopy supplies sufficient cover for the soil but at the same time does not cause saturation of the indices, which occurred in this case at anthesis at c. 200 g/m2 of dry biomass with LAI of c. 3–4 (Fig. 2). However, the use of traditional field measurements such as SPAD did not supply the same information as remotely sensed imagery.
The results are of particular interest because GS0 is the period during which the second fertilization is applied. Consequently, accurate information about the state of vegetation at that time is important for optimizing the fertilization management on the basis of crop growth and N status.
Relations between vegetation indices at GS30 and GS65 and harvest characteristics
At GS30, all satellite indices showed a good ability to provide predictive information about the harvest quantity, highlighting significant correlations with yield. As regards the indices derived from ground measurement, SPAD was not suitable as an index for forecasting the quantity and quality of the harvest. This is probably because SPAD units are difficult to interpret, despite these meters being portable and suitable for field use. In fact, the SPAD value depends not only on the chlorophyll content (with which, however, there is a non-linear relationship) but also on other aspects of leaf optics, which may be influenced by various environmental and biological factors (Coste et al. Reference Coste, Baraloto, Leroy, Marcon, Renaud, Richardson, Roggy, Schimann, Uddling and Herault2010). Therefore SPAD, like most of the analyses based on contact sensors, is time-consuming and only a few plants can be sampled, resulting in an inaccurate representation of spatial and temporal variability of crop N status (Fitzgerald et al. Reference Fitzgerald, Rodriguez and O'Leary2010).
At GS65, no relationships were observed, confirming the previous hypothesis on the difficulty of vegetation indices to give useful information on crop status at advanced development stages. Furthermore, many authors reported that the crop water status has a key role in the establishment of empirical relations between vegetation indices and plant N content (Christensen et al. Reference Christensen, Rodriquez, Belford, Sadras, Rampant, Fisher and Stafford2005; Rodriguez et al. Reference Rodriguez, Fitzgerald, Belford and Christensen2006). In fact, even if a situation of water stress could be recognized during the early stages of wheat development, there was an abrupt change in rainfall conditions from mid-April to May (GS65) that could have produced a change in the crop water status large enough to be sensed.
Relationships between crop parameters at GS30 and GS65 and final harvest characteristics
The relationship between above-ground biomass accumulated from emergence to stem elongation and the final yield can be explained by considering how at GS30 most of biomass is represented by leaf, which is directly responsible for crop growth. The strong relationship of yield with LAI also confirms this. However, a good yield is a consequence not only of the biomass quantity but also of the nutritional state of the crop, mainly represented by its N content.
The positive correlation found between the grain protein concentration and the plant N concentration at GS30 shows that the increase in the biomass corresponds to a decrease in grain quality. At an early stage, this already seems to confirm the dilution effect that occurs during grain filling, associated with high yield dilution of protein concentration (Suprayogi et al. Reference Suprayogi, Clarke, Bueckert, Clarke and Pozniak2011). Indeed, a vigorous vegetative state of the plant ensures a high production of carbohydrates. This also explains the negative correlation between the N content (g/m2) and the grain protein concentration (mg/g) In fact, the N content increases with the increasing yield, whereas the protein concentration decreases. As regards GS65, it has been confirmed that the crop parameters observed provide less information about the characteristics of the final production, despite approaching harvesting time.
To sum up, the findings of the research showed the suitability of the RapidEye satellite for monitoring crop development over wide areas of the territory. The spectral indices deriving from its high resolution imagery, and in particular NDVI and NDVIRE, represent optimal indicators of the main quantitative parameters of crop growth and development. This ability to describe the crop status was particularly effective at GS30, for two main reasons: first, the variability of the vegetation is high enough to be captured and described by the remote-sensed indices, and secondly, GS30 represents the optimal time at which the soil is completely covered while the quantity of biomass is still not sufficient for saturating the indices.
CONCLUSION
The use of high-resolution imagery from commercial satellites represents a powerful tool for monitoring delimitated lands and providing information that can be directly used by single farms. Remote estimation allows for breaking free from ground measurements that are very costly and time consuming.
In the present study, the large spatial variability of soil and climatic conditions in the hilly areas of Tuscany affected the crop vegetative-productive response, which was therefore very heterogeneous. Under these conditions, while the punctual measurements efficiently represent the immediate surroundings of the measuring point they are likely to be a source of error when used to describe larger areas. Conversely, satellite imagery provides continuous information that better represents the real state of the crop as a whole. Moreover, the waiting time for obtaining the processed images is reduced to a few days, even though still influenced by the weather conditions, which in spring can cause delays in satellite acquisition. The use of satellite information by single farms is still not very feasible due to constraints related both to the costs and the skills required. Instead, its use becomes more efficient when shared by organized forms of farm consortia or co-operatives that can provide it as a service costing only a few €/ha.
The ongoing information at the field level can be used more rationally for operational applications, such as fertilization and plant protection during stem elongation, which could be managed in line with the principles of site-specific agriculture.
Complications arise when this information has to be used for predictive purposes, and when agronomic decisions are made on the basis of expected qualitative and quantitative aspects of the final production. In fact, the production performance is partly determined by the state of wheat during the first phase of development, and later, mainly by climate conditions during grain filling. In order to obtain operational information that also covers this forecasting aspect, further research is necessary in order to analyse the relationships between the indices used and the inter-annual climate variability. In addition, the integration of remotely sensed information during stem elongation with seasonal forecasting would be an interesting aspect that warrants further investigation.
The authors wish to thank the APPCoT project (measure 124 – Plan of Rural Development 2007–2013, Tuscany Region), Consorzio Agrario di Siena, and the Di Donato, Nardi and Rappuoli farms. Special thanks also go to Dr. Pagliuca and Dr. Ceccuzzi for their continued support and availability.