


Introduction
Both empirical and modeling studies have illustrated the influential role that snow cover plays within the global heat budget (Reference Walsh and ChapmanWalsh and Chapman, 1990). Because of the importance of snow cover as a climate variable and as a component in the Earth’s energy budget, various components of the cryosphere, including seasonal snow cover and sea ice, have been analyzed to identify changes that may be correlated with each other as well as with other climate indicators, particularly surface air temperature. The timing of snowmelt is impacted by whether a region is dominated by continental or maritime climatic influences, by whether the snowpack faces north or south and whether it sits at a higher elevation Moreover, percent of sunshine, the position of storm tracks and the thickness of the snowpack all affect the interannual variability (Reference Foster, Robinson, Hall and EstilowFoster and others, 2008).
In the late 1980s, Reference FosterFoster (1989) examined the date of snow disappearance as measured at meteorological stations in the tundra of Eurasia and North America. The snowmelt date was found to have been occurring earlier in the spring since the late 1960s over much of the North American tundra. In Barrow, Alaska, a trend toward earlier snowmelt was evident after ∼1950. However, running means of the snow disappearance date across most of northern Russia (north of 70° N) displayed no such trend. In the early 1990s, satellite observations confirmed the earlier date of snow disappearance poleward of 70° N as compared to visible satellite observations at the start of the satellite record in the 1970s (Reference Foster, Winchester and DuttonFoster and others, 1992).
Reference Robinson and DeweyRobinson and Dewey (1990) also observed declines in snow-cover extent (SCE) in the mid- to late 1980s. By the mid- and late 1990s, it had become more obvious that the spring SCE changes identified in the 1980s represented more of a stepwise change, and not a steady drop in snow extent (Reference Robinson, Frei and SerrezeRobinson and others, 1995; Reference Robinson and FreiRobinson and Frei, 2000). The step-like change in Northern Hemisphere SCE during 1986–87 was first identified by Reference RobinsonRobinson (1996). The time period studied in that paper uses observations from January 1972 to September 1996, with the earlier period running from 1972 to 1985 and the later period from 1986 to 1996. The 12 month running means of these two periods (25.9 × 10⁶km2 and 24.2 × 10⁶km2, respectively) are significantly different (t-test, p<0.01).
Annual averages of SCE since the mid-1980s have remained ∼2 × 10⁶km2 (∼8%) lower than averages in the period from the late 1960s to the late 1980s, the first 20 years of the satellite era. For more on this see Reference Foster, Robinson, Hall and EstilowFoster and others (2008), which examines snow disappearance data through 2004.
In recent years, the Arctic Oscillation (AO) has been linked to fluctuations in certain climate parameters and to changes in snow/ice features. The surface AO can be traced back in time to originate in the middle stratosphere and propagates through the lower stratosphere and then through the entire troposphere on a timescale of 1–2 weeks (Reference Cohen, Foster, Barlow, Saito and JonesCohen and others, 2010). The influence of the winter AO on spring snow cover has been discussed by Reference BamzaiBamzai (2003). Additionally, Reference Saito and CohenSaito and Cohen (2003) looked at the potential role of snow cover in forcing interannual variability, and Reference Saito, Yasunari and CohenSaito and others (2004) studied changes in the sub-decadal covariability between Northern Hemisphere snow cover and the general circulation of the atmosphere. They found that decadal changes in the snowmelt date correlate in some degree to the position of atmospheric pressure patterns, including the AO. According to their results, a shift in the storm track could result in less frequent snowfall in boreal forests, for instance, in more recent years compared to earlier in the satellite era. Therefore, the spring snowpack would be thinner and likely melt away more readily.
The Arctic atmosphere has been warming for more than two decades, and sea-ice extent regularly falls below previously observed minima (Reference Comiso and ParkinsonComiso and Parkinson, 2004; Reference ParkinsonParkinson, 2006; Reference Serreze and BarrySerreze and Barry, 2011). We believe an investigation is warranted that examines recent trends in the character of spring snowmelt over the mid- and high latitudes of the Northern Hemisphere, during the period 1967–2011. Our intent is to both further extend our earlier results by using satellite-derived snow maps to evaluate the timing of the retreat of spring snow cover in the Arctic and sub-arctic, and to see if there is a meaningful correlation between the date snow disappears from these latitudinal bands and the strength and direction of the winter AO (December-February (DJF)) and spring AO (March-May (MAM)). The thrust of the paper is then to determine if the date of snow disappearance from specified latitudinal boundaries (the week when the snowline first retreats north of the boundary) is significantly related to fluctuations of the AO (also known as the Northern Annular Mode (NAM)), which is the dominant mode of Northern Hemisphere, extratropical climate variability (Reference Thompson and WallaceThompson and Wallace, 1998).
Methodology
In earlier investigations, we examined weekly maps of continental SCE produced by the US National Oceanic and Atmospheric Administration’s (NOAA) National Environmental Satellite Data and Information Service (NESDIS) (Reference Matson, Ropelewski and VarnadoreMatson and others, 1986; Reference Robinson, Dewey and HeimRobinson and others, 1993; Reference RamsayRamsay, 1998). These maps are the crux of the longest satellite-derived environmental dataset available and have long been the premier dataset used to evaluate large-scale NOAA/NESDIS snow maps dating back to late 1966. Polar stereographic snow maps have been digitized using a hemispheric 128 × 128 cell (half-mesh) grid. The temporal resolution of this dataset is weekly (for more details of how snow is mapped and the quality of the NOAA satellite interpretations of snow, see http://climate.rutgers.edu/snowcover; Reference Wang, Sharp, Brown, Derksen and RivardWang and others, 2005; Reference Foster, Robinson, Hall and EstilowFoster and others, 2008).
For this study, the years 1967–2011 are examined. Note that for the AO, we employed available data from 1973 to 2011. As was the case in the 2008 study (Reference Foster, Robinson, Hall and EstilowFoster and others, 2008), at 60° N, 16 longitudinal segments were selected for study. The final week of snow cover is the last week during which snow cover was observable from visible/infrared satellite imagery for those locations where a snowpack was established: snow covered the ground for >1 week. Thus the week (end of 7 day period) when the snowline first retreats north of 70° N (and 60° N) is determined as being the date of snow disappearance.
At 70° N, predominantly land-covered cells were identified. All cells at 70° N are considered maritime, with tundra vegetation most prevalent (Reference Foster, Robinson, Hall and EstilowFoster and others, 2008). In contrast, a number of the longitudinal segments at 60° N have a high degree of climatic continentality, particularly in Eurasia. These segments reside mostly within the boreal forest zone. Note that the segments at 60° N are grouped by longitude. However, the individual gridcells at 70° N do not necessarily correspond with lines of longitude. The decision to use individual gridcells at 70° N was made considering the coarse resolution of the Northern Hemisphere weekly snow product.
Snow-covered areas within mountain shadows may sometimes be mapped as snow-free, and large water bodies can influence the timing of melt. We therefore decided that predominantly mountainous segments or segments including a substantial amount of water would not be evaluated.
The days per decade (d(10a)−1) change for individual longitudinal segments at 60° and individual cells at 70° determined the annual snow disappearance date, using linear regression. The mean day of snow disappearance for the period before the previously mentioned stepwise change (1967–86) and after this change (1987–2011) was calculated for comparison purposes.
For values of the AO, we used NOAA monthly derived values. Monthly values were averaged to produce seasonal means. To compute the linear relationship between the monthly/seasonal AO values and the date of snow disappearance, we computed the correlation coefficient between the AO values and the calendar week that snow cover was last observed.
Arctic Oscillation and Relation to Seasonal Snow Cover
The AO, the first leading mode of sea-level pressure, is strongly correlated with tropospheric climate fields in the boreal extratropics. It is a dipole pattern, with one anomaly covering much of the Arctic, and a second anomaly stretching across the mid-latitudes but focused in the ocean basins, peaking in strength during the coldest months. The AO’s early-season onset is not well understood; however, it is postulated that an atmospheric teleconnection pathway, with origins at the surface over northern Eurasia, may be involved (Reference Cohen, Foster, Barlow, Saito and JonesCohen and others, 2010). Anomalies of early-season surface diabatic heating across Eurasia are believed to result from seasonal variations in snow extent (Reference Saito, Cohen and EntekhabiSaito and others 2001; Reference Saito and CohenSaito and Cohen, 2003). It appears to take ∼4 weeks for such anomalies to propagate from the troposphere to the stratosphere (Reference Cohen and BarlowCohen and Barlow, 2005). The stratosphere-to-troposphere downward propagation of associated AO anomalies, as the snow season progresses, has been well documented (Reference Saito and CohenSaito and Cohen, 2003; Reference Saito, Yasunari and CohenSaito and others, 2004; Reference Cohen, Barlow, Kushner and SaitoCohen and others, 2007). Regime shifts in the AQ were computed following the methodology of Reference RodionovRodionov (2004). We found one robust regime shift associated with the AO positive/negative phase of 1988/89 (Fig. 1) that is concomitant with the step-like changes noted in date of snow disappearance. The positive phase of the AO brings lower-than-normal pressure over the polar region; higher pressure accompanies the negative phase. According to Reference Thompson and WallaceThompson and Wallace (1998), the positive phase of the AO accounts for more than half of the surface air temperature trends over Alaska, Eurasia and the eastern Arctic Ocean but less than half in the western Arctic Ocean.
Arctic Oscillation values (December–March) from 1900 to 2011.
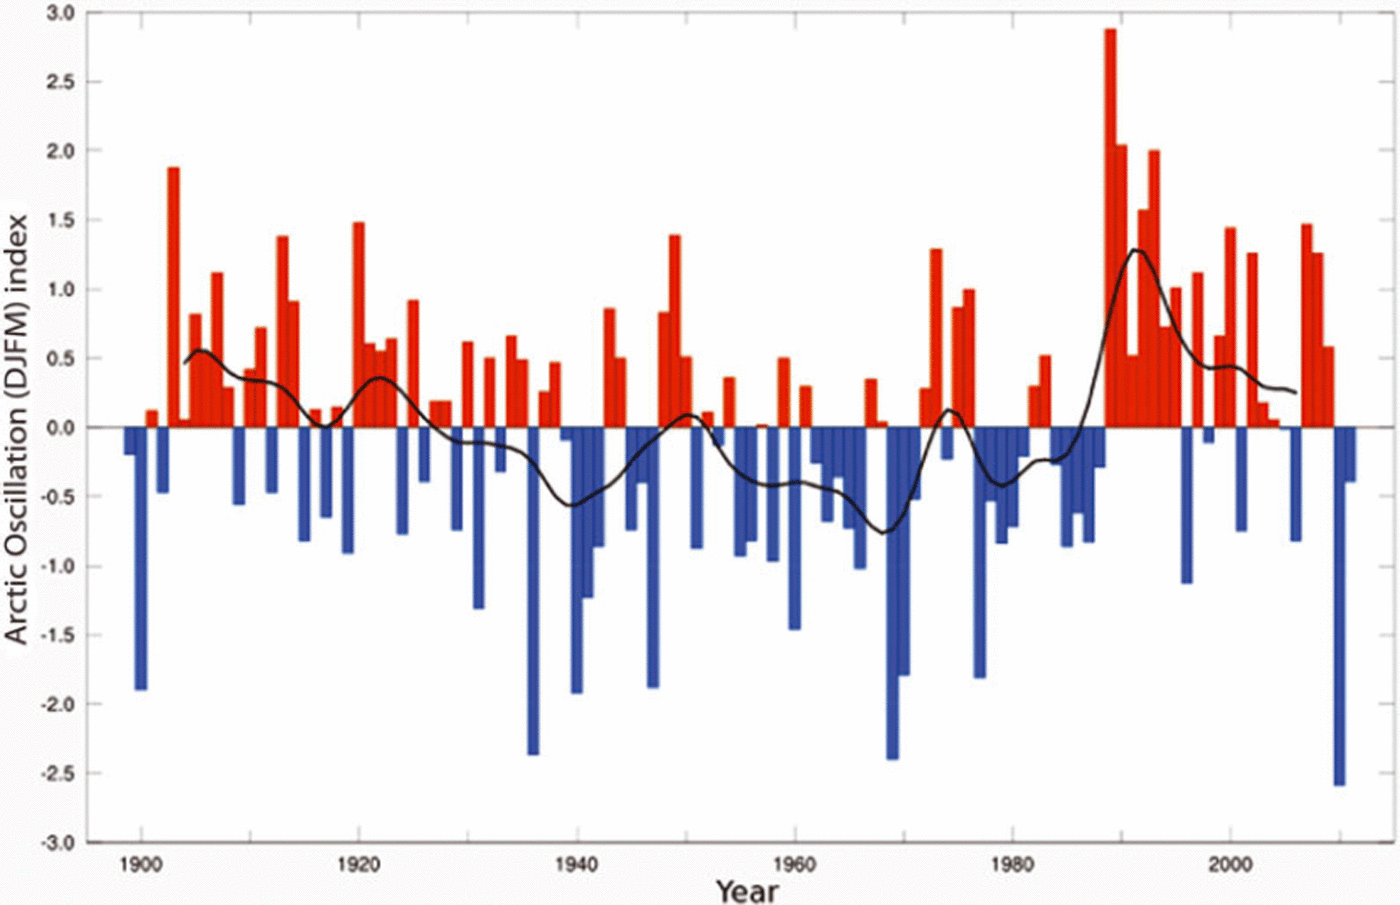
It was reported by, for example, Reference Cohen, Foster, Barlow, Saito and JonesCohen and others (2010) and Reference FosterFoster and others (2012) that one of the main contributing factors to the unusually severe winter weather in 2009/10, in both Europe and eastern North America, was a persistent exchange of mass from north to south, with unusually high pressure at high latitudes and low pressure at mid-latitudes. A back-and-forth or seesaw pattern is a classic signature of the AO index. The AO of 2009/10 was the most negative observed since at least 1950 (Fig. 1). Empirical orthogonal function analysis of sea-level pressure poleward of 20° N resulted in a standard deviation of–2.5 (Reference Cohen, Foster, Barlow, Saito and JonesCohen and others, 2010). Using a skillful winter temperature forecast, it was shown by Reference Cohen, Foster, Barlow, Saito and JonesCohen and others (2010) that the AO explained a greater variance of the observed temperature pattern across the extratropical land masses of the Northern Hemisphere than did the El Niño Southern Oscillation (ENSO) (Reference FosterFoster and others, 2012).
Results
North of 60°N, snow begins to retreat between mid-April and mid-May, while north of 70°N the snowpack may melt out in late May or last until early July. The present study has shown that the date of snow disappearance in the spring continues to occur earlier now than in the late 1960s/70s over much of the Northern Hemisphere. At 60°N, snowmelt has occurred 1.77 d(10 a)−1 earlier in the last decade (2000–10) than in the 1970s for most latitudinal segments (Fig. 2). At 708 N, snow is melting out even earlier: 3.10 d(10 a)−1 earlier in the 2000s than in the 1970s (Figs 3 and 4). Note that days per decade (a trend value), rather than snow-free date, is used in Figures 5 and 6. Days per decade simply refers to how much earlier (or later) snow melted out in each decade over the data record.
Change in the timing of spring snowmelt at 60° N from 1967 to 2011 as expressed in days of change per decade.
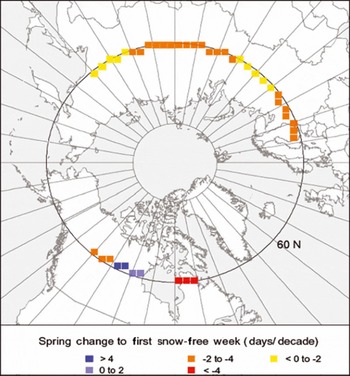
Same as Figure 2, but at 708 N.

Plot showing dates of snow disappearance at 70°N (cell 18; snow melting out 8 days earlier from 1987 to 2011 than from 1967 to 1986).
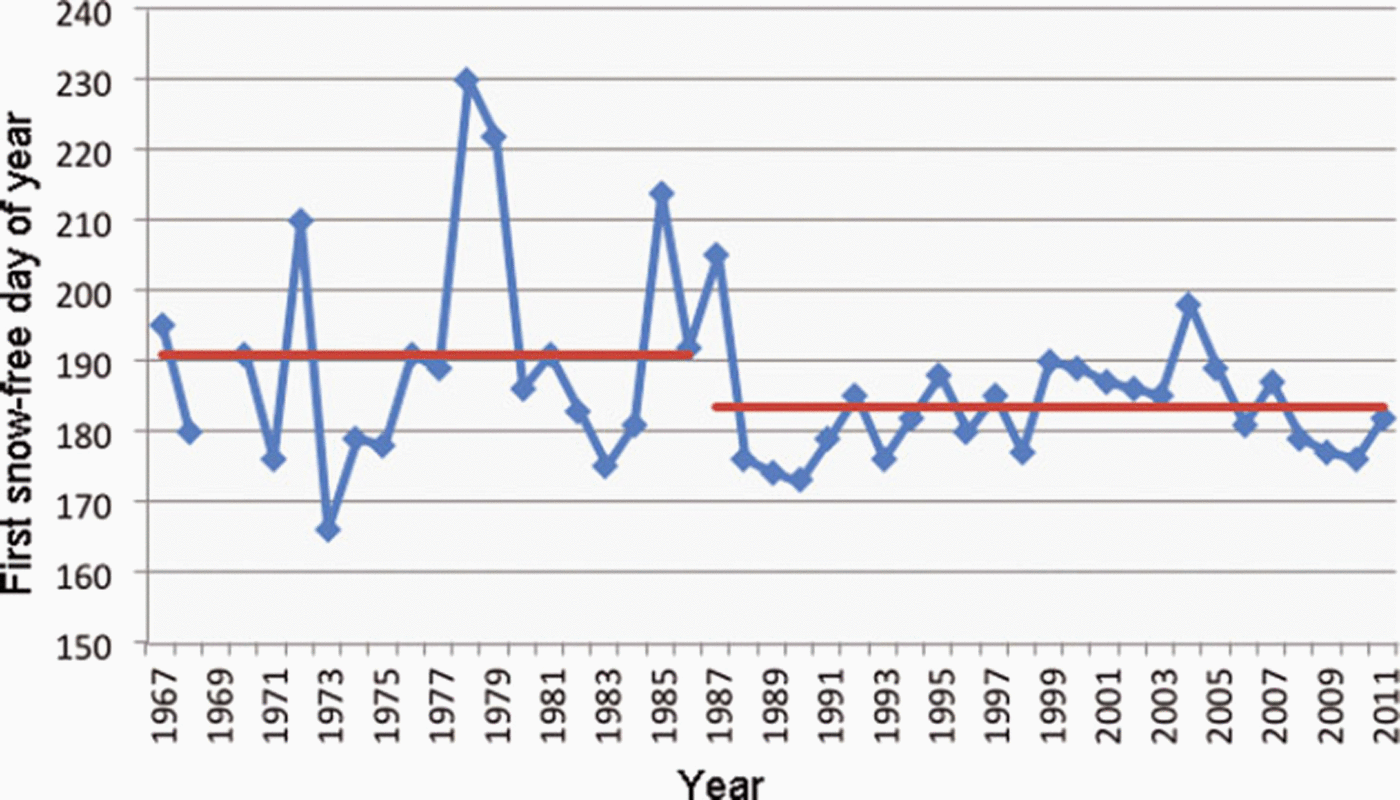
Plot showing dates of snow disappearance at 60° N (segment 14; snow melting out 8 days later from 1987 to 2011 than from 1967 to 1986). The red lines are the average values over the time periods indicated.

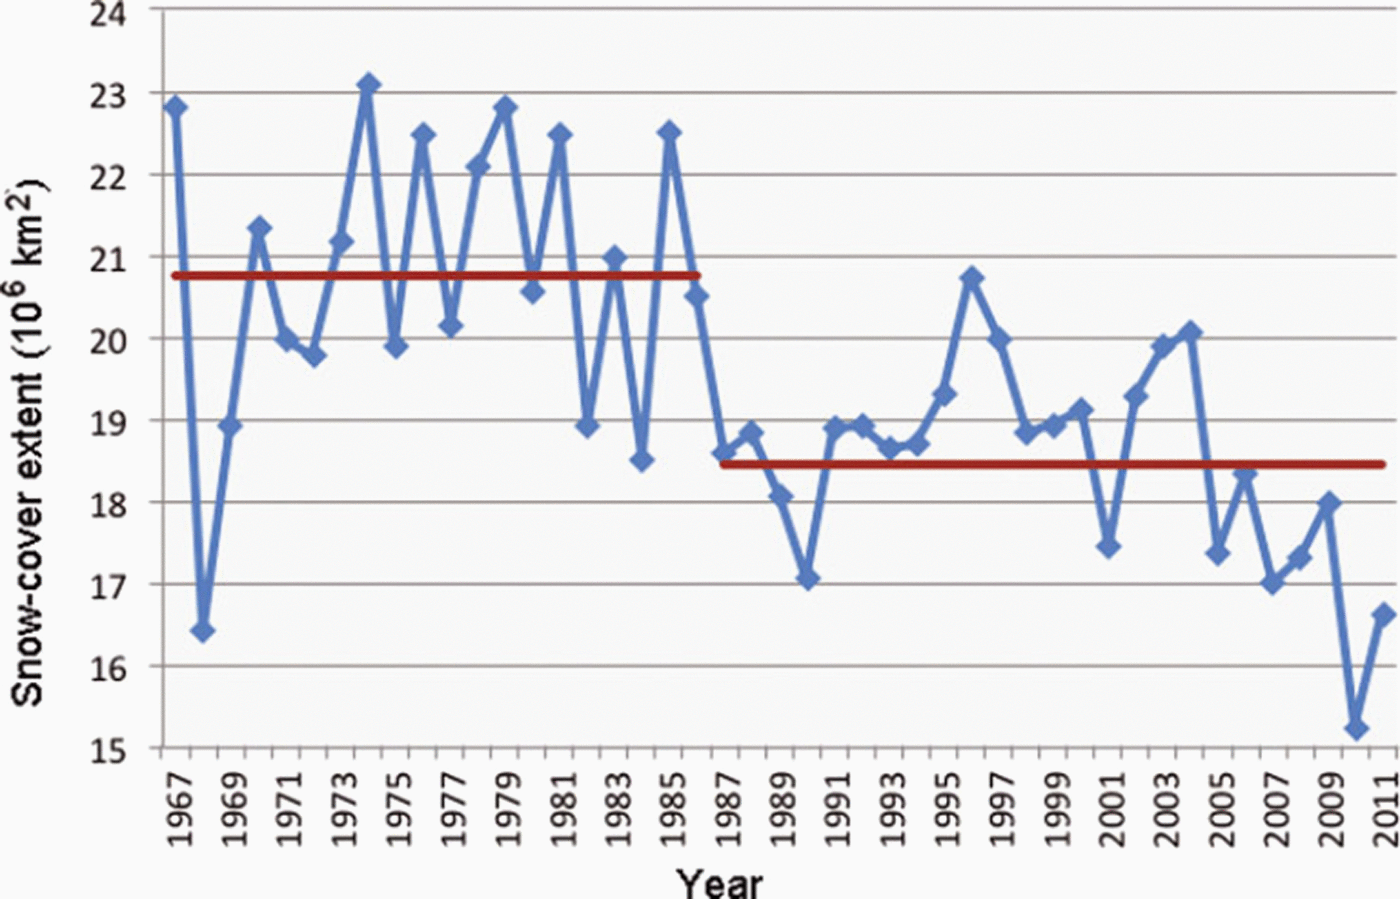
Snow-cover extent of Northern Hemisphere in May (1967–2011).
As was the case in Reference Foster, Robinson, Hall and EstilowFoster and others (2008), an examination including the additional data (more recent years) shows that a noteworthy shift or stepwise change in snowmelt occurred in the mid- to late 1980s. For instance, the average snow disappearance date at 60°N was nearly 6 days earlier averaged over the 1987–2011 period as compared to 1967–86. Not all segments showed tendencies toward earlier snowmelt over time. Segment 14 (Fig. 5), from 1008 to 110°W, shows the date of snow disappearance from 1987 to 2011 actually occurring 8 days later than from 1967 to 1986.
A similar shift toward earlier snowmelt was observed at 70° N: study cells showed an average meltout occurring nearly 7 days earlier for the period 1987–2011 compared to 1967–86 (see Fig. 4: cell 18, 100–1108 W. For this cell, on Victoria Island, the snow disappeared 8 days earlier during the period 1987–2011 than during 1967–86.) Moreover, as was the case with Reference Foster, Robinson, Hall and EstilowFoster and others (2008), at 708 N, eight cells showed significant (negative) trends. However, at 608 N only two longitudinal segments showed significant trends, one positive and one negative.
Shifts in snow-cover extent during the spring in the mid-latitudes of the Northern Hemisphere are similar to those reported at the 608 and 708 bands. For example, the decrease in SCE during May has continued in recent years (Fig. 6). In May 2010 the SCE was ∼6 × 10⁶ km2 less than in May 1970. From 1967 to 1986, the snow extent was on average >2 × 10⁶km2 greater than during the period 1987–2011. The snow melted out, on average, 3 days earlier during the second half of the period than during the first half (Fig. 6).
The AO was strongly positive from the late 1980s through about the mid-1990s (Fig. 1). This matches the step-like changes in snow disappearance dates quite well. From the mid-1990s to about 2009, the trend was neither strongly positive nor negative, which is consistent with the tendencies in spring snowmelt during this period (Reference Cohen and BarlowCohen and Barlow, 2005). In 2010 and 2011, however, the AO was strongly negative (see also Reference Rigor, Wallace and ColonyRigor and others, 2002; Reference BamzaiBamzai, 2003; Reference Gong, Entekhabi and CohenGong and others, 2003; Reference Saunders, Qian and Lloyd-HughesSaunders and others, 2003).
Figure 7 shows the correlation coefficient for the date of the final week (end of week) of snow cover versus the strength and direction (positive or negative) of the AO during the winter (DJF). It should be mentioned that the correlations include all gridboxes that had observed snow cover for every year of the record. The areas of greatest positive correlations (averaging ∼0.4) in Figure 7 occur between the December AO and the date of snowmelt in north central Siberia as well as between the February AO and the date when snow melts in the Great Plains of southern Canada and the northern USA. Note that positive correlations are associated with later snowmelt or snow disappearance when the winter AO is positive. With regard to negative correlations (later snowmelt is associated with a negative winter AO), r values are fairly strong (0.6) between both the January and February AO indices and the western steppes and the taiga regions of Russia, stretching from west of the Ural Mountains to the Pacific Ocean. Additionally, similar values (negative) exist across much of central and northern Canada, in both months, and for Alaska during January. Examining the entire winter (top left panel), negative correlations prevail, particularly across central Russia and northern Canada.
Correlation of final-week snow cover with DJF AO, for the years 1973–2011. The 95% significance level is contoured in black.
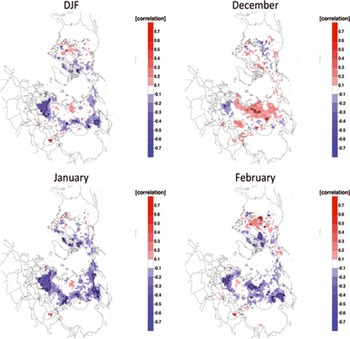
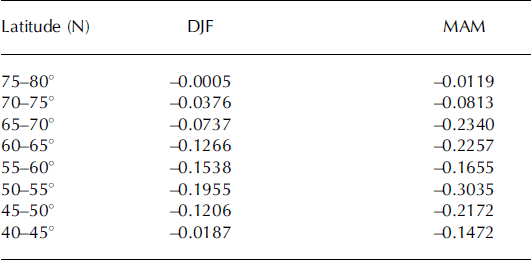
Figure 8 is similar to Figure 7 but for springtime AO conditions. The most significant area of positive correlations (again averaging ∼0.4) is evident between the March AO and the date when snow disappears across much of Canada. Negative correlations are widespread in all three spring months but especially in March and April throughout Russia: rvalues average ∼0.45, with maximum values reaching 0.6. In May, areas of negative r values (averaging ∼0.4) are obvious in the northern USA, whereas in March and April these areas are considerably smaller. For the entire spring season (MAM), negative correlations dominate across much of Russia, while in North America comparatively small areas of both negative and positive correlations are found. For both Figures 7 and 8, the 95% level of significance is contoured in black. Table 1 gives the mean correlations for the DJF AO and the MAM AO and date of snow disappearance for every 58 latitude.
Same as Figure 7, but with MAM AO.

Mean AO correlations for DJF and MAM and date of snow disappearance for every 58 latitude
Discussion
There is an implicit relationship between the phase and amplitude of the AO (springtime AO) and the date of snow disappearance (Fig. 8). For example, regarding the spring AO and Eurasian snow cover, it can be inferred that the more strongly positive the AO, the earlier snowmelt will occur; whereas, the more strongly negative the AO, the later melt will occur. However, the winter AO is more complex. At higher latitudes, a positive AO is associated with later snowmelt, and at lower latitudes a positive AO is associated with earlier snowmelt; the reverse is true for a negative AO (see Fig. 7).
In general, the AO/date-of-snowmelt relationship during both winter and spring is relatively strong in Eurasia compared to North America, primarily because of Eurasia’s greater continentality. Eurasia makes up ∼37% of the Earth’s land surface compared to ∼16% for North America. Snow is a more constant feature in Eurasia. Incursions of air from non-polar sources (marine and tropical air masses) have a greater likelihood of reaching interior regions of North America than interior Eurasia. Moreover, Eurasia is positioned much closer to the Arctic than is North America; considerably more of its land mass is located above the Arctic Circle. Thus there is nearly always snow cover present in the northern tier of Eurasia during the winter and spring seasons (December–May), which may act to increase the correlation coefficient between AO and date of snowmelt.
The negative AO is associated with lower temperatures across the Northern Hemisphere continents, and the positive AO with higher temperatures (Reference Thompson and WallaceThompson and Wallace, 1998). Therefore, in general it is reasonable to expect that the negative AO is associated with later snowmelt and the positive AO with earlier snowmelt. From Figures 7 and 8, it can be seen that this relationship usually holds, especially between the spring AO and Eurasian snow cover.
The negative winter AO is associated with later snowmelt across southern latitudes of snow-covered regions but also with earlier snowmelt across more northern latitudes (Fig. 7). The winter AO is also correlated with the latitudinal extent of storm tracks across Eurasia (Reference HurrellHurrell, 1995), where the storm track is shifted south during the negative phase of the AO and north during the positive phase. Thus, when the winter AO is negative with a more southerly storm track, a deeper snowpack is established along the southern periphery of the SCE. Then, during the spring snowmelt season, the deeper snowpack results in later snowmelt further south, but snowmelt occurs earlier further north with a thinner snow cover. In contrast, when the winter AO is positive, the storm track is shifted north, resulting in a deeper snowpack along the northern periphery of the SCE. In this case, during the spring snowmelt season, the deeper snowpack results in later snowmelt further north but earlier snowmelt further south, where a thinner snow cover was established during the winter. A similar explanation is likely true across North America in March, which, though considered here to be a spring month, often behaves like a winter month.
Step-like changes in snow disappearance date (in the 1980s) were not just observed in the snow record; they were also noted in sea surface temperatures and in phytoplankton. Reference Reid, Edwards, Hunt and WarnerReid and others (1998) observed significant positive and negative linear trends from 1948 to 1995 in phytoplankton as measured by the Continuous Plankton Recorder survey in the northeast Atlantic and the North Sea. These trends seem to reflect a response to changing climate on a timescale of decades. Spreading of anomalously cold water from the Arctic may have contributed to the decline in phytoplankton north of 598 N. According to Reference Reid, Edwards, Hunt and WarnerReid and others (1998, Reference Reid, Borges and Svendsen2001), there is evidence for a stepwise phytoplankton increase after the mid-1980s. Higher sea surface temperatures were also measured after 1987 than prior to that year, particularly during the spring and summer. It may be thought that these biological and physical events are a response to observed changes in pressure distribution over the North Atlantic. From 1988 onwards, the North Atlantic Oscillation (NAO) index increased to the highest positive level observed in decades. The NAO and AO are closely linked (Reference Ambaum, Hoskins and StephensonAmbaum and others, 2001). The positive NAO anomalies are associated with stronger and more southerly tracks of the prevailing westerlies and higher temperatures in western Europe (Reference Reid, Edwards, Hunt and WarnerReid and others, 1998, Reference Reid, Borges and Svendsen2001).
The synchronicity of the above-mentioned changes in northern seas and land surfaces is perhaps forced by a threshold increase in temperature, the source of which could be higher temperatures in ocean water linked to the NAO. It may be that over land areas (e.g. at 70° N) and for areas adjacent to the Arctic Ocean, maritime air has taken up heat from the ocean (personal communication from P. Reid, 2012). Over northern land areas adjacent to the Arctic Ocean, maritime air incursions appear to be linked to observed changes in the date of snow-cover disappearance.
Observed changes in SCE and snow disappearance at the more northerly latitudes, in the late 1980s, are likely not a coincidence. Changes in the date of disappearance of spring snow cover, especially at high latitudes, found in this study as well as previous studies (Reference FosterFoster, 1989; Reference Foster, Winchester and DuttonFoster and others, 1992, Reference Foster, Robinson, Hall and Estilow2008), coincide with the observed increasing spring warmth of recent decades. However, the earlier snowmelt dates do not correlate particularly well with the diminution of Arctic Ocean sea ice, for instance (Reference Comiso and ParkinsonComiso and Parkinson, 2004).
Conclusions
This current investigation, with seven more years of additional data available than in Reference Foster, Robinson, Hall and EstilowFoster and others (2008), has found that the poleward retreat of spring snow cover has continued to occur ∼4–7 days earlier, at most latitudinal segments at 60° N and 70° N, than in the first half of the satellite era (1966–88). Snowmelt along coastal areas of the Arctic Ocean (70° N) continues to be slightly greater than further inland (60° N).
With regard to the AO, when the springtime AO is strongly positive, snow melts earlier. When the springtime AO is strongly negative, snow disappears later in the spring. The winter AO is less straightforward, as the results are more mixed. At higher latitudes (e.g. 70° N, in December across Eurasia), a positive AO during the winter months is correlated with a later snowmelt, but at lower latitudes (e.g. 60° N, in January across Eurasia), a positive wintertime AO is correlated with an earlier snowmelt. If the AO during the winter months is negative, though, the reverse is true.
Acknowledgements
Judah Cohen is supported by US National Science Foundation grants ARC-0909459, ARC-0909457 and BCS-1060323, and NOAA grant NA10OAR4310163. Justin Jones and Jason Furtado assisted with some of the figures and computations for the manuscript.



