I. INTRODUCTION
Automobiles and garbage furnaces release waste heat, which equals to about 70% of the total energy. Thermoelectric technology can recover the waste energy and contribute to an environmental issue. The thermoelectric properties were expressed by the dimensionless figure of merit ZT expressed by ZT = S 2/ρκ, where S, ρ, κ, and T are Seebeck coefficient, electrical resistivity, thermal conductivity, and temperature, respectively. It is necessary to be ZT > 1 for practical applications. Therefore, high-efficiency thermoelectric materials have high Seebeck coefficients, low electrical resistivities, and low thermal conductivities. Typical thermoelectric materials, Bi–Te, Pb–Te, and Si–Ge, have been researched since the middle of the 20th century.Reference Wright1–Reference Heller, Nasby and Jhonson3 However, these materials exhibit some drawbacks, such as low melting point, harmful, or expensive element for practical applications. Recently, new materials called “clathrate” have drawn much attention because of their low thermal conductivity.Reference Nolas, Cohn, Slack and Schujman4, Reference Nolas, Tritt, Kanatzidis, Mahan and Lyon5 Clathrates have a variety of structures composed of several cages. Type-I clathrate, A8BxC46−x, compounds of two regular dodecahedra and six 14-faced polyhedral cages composed of group III (B) and IV (C) atoms. Only guest atoms (A) are contained in each cage.Reference Schujman, Nolas, Young, Lind, Wilkinson, Slack, Patschke, Kantzidis, Ulutagay and Hwu6 It is considered that “rattling” motion of guest atoms reduces thermal conductivity because of the phonon scattering.Reference Nolas, Tritt, Kanatzidis, Mahan and Lyon5, Reference Slack, Tritt, Kanatzidis, Lyon and Mahan7 Thermoelectric properties of Ge, Si, and Sn clathrate have been reported.Reference Nolas, Tritt, Kanatzidis, Mahan and Lyon5, Reference Kishimoto, Ikeda, Akai and Koyanagi8, Reference Okamoto, Kishida, Tanaka and Inui9 NolasReference Nolas, Tritt, Kanatzidis, Mahan and Lyon5 synthesized polycrystal Sr8Ga16Si30 and Ba8Ga16Sn30 clathrates, which had the high Seebeck coefficient, 320 and 145 μV/K at room temperature, respectively. However, electrical resistivities of these samples were also high at room temperature, 12.9 and 14.9 mΩcm, respectively. Therefore, it is necessary to reduce electrical resistivity keeping the Seebeck coefficient high in the clathrate system. Polycrystal clathrates have much grain boundary preventing electron conductivity. It is considered that single crystallization of clathrate is more efficient for thermoelectric properties because of the reduction of electrical resistivity. In addition, it is necessary to synthesize clathrate composed of more cheaper elements than Ge and Sr. Kauzlarich and coworkers synthesized single-crystal Ba8Al14Si31 using a molten Al flux technique.Reference Condron, Kauzlarich and Nolas10 However, it is difficult to synthesize large-sized single-crystal for practical applications using a molten Al flux technique. In this study, we synthesized the single-crystal Ba8AlxSi46−x using Czochralski (CZ) method and compared the thermoelectric properties of the single-crystal with those of the polycrystal sample.
II. EXPERIMENT
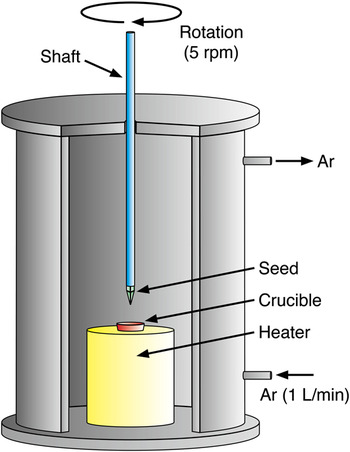
The starting materials were Ba (99%), Al (99.99%), and Si (99.999%). The polycrystal Ba8Al16Si30 ingots were prepared by arc melting method to use solution and seed for pulling single crystal. Single-crystal Ba8AlxSi46−x was prepared by CZ method from the melt of the Ba8Al16Si30 ingots and a schematic of the apparatus is shown in Fig. 1. The chamber was floated with argon during pulling and the temperature of solution was ∼1100 °C. Pulling speed and rotational speed were 2.5 mm/h and 5 rpm, respectively. To compare the thermoelectric properties, polycrystal Ba8Al12Si34 ingot was prepared by arc melting method in an argon atmosphere. The nominal composition was Ba:Al:Si = 8:12:34. Synthesized ingot was annealed at 850 °C for 100 h in an argon atmosphere to homogenize it.
Schematic of Czochralski (CZ) method.

III. RESULTS AND DISCUSSION
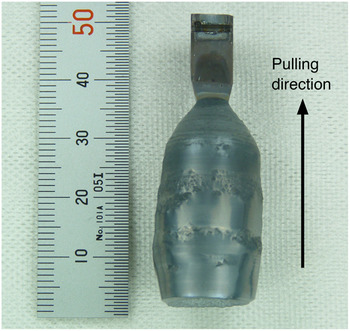
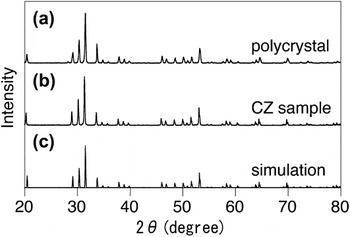
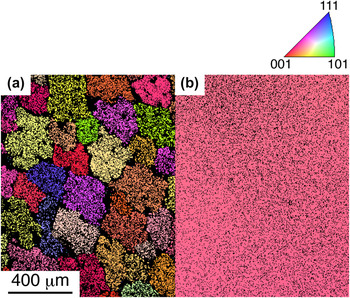
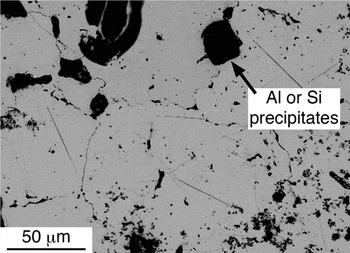
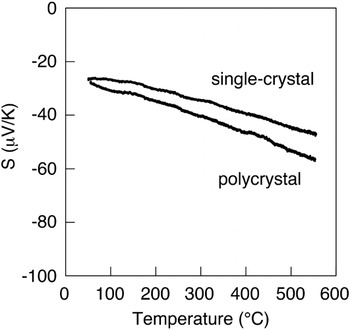
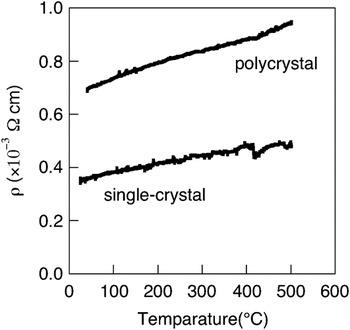
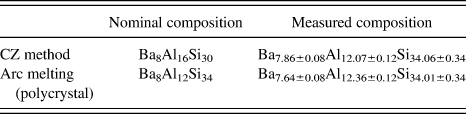
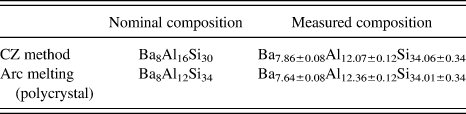
Typical photograph of an ingot pulled from the melt using the CZ method with polycrystal seed is shown in Fig. 2. The results of powder x-ray diffraction (XRD) measurement of CZ and polycrystal samples by using CuKα radiation are shown in Fig. 3. Both samples have type-I clathrate structure. The lattice constants of the CZ and the polycrystal samples estimated by another XRD measurement in high resolution around (2 3 11) peak are 10.60 and 10.59 Å, respectively. The orientation imaging microscopy (OIM) images of the polycrystal and the CZ samples cut parallel to pulling direction are shown in Fig. 4. These OIM images are presented in the pole figure colors. Each color determines crystal orientation, and black colors have low confidence value and show the grain boundaries. Figure 4(a) shows that the grain size of the polycrystal sample was about 200 μm. Figure 4(b) has almost uniform color and it is suggested that the sample pulled by CZ method is single-crystal. The nominal compositions and the chemical compositions of the single- and the polycrystal samples examined by wavelength-dispersive x-ray spectrometry (WDX) are shown in Table I. These values were averaged of several points in the region without foreign phase. The chemical composition of the single-crystal sample from solution of the stoichiometric proportion Ba8Al16Si30 was Ba7.86±0.08Al12.07±0.12Si34.06±0.34. It is suggested that Ba8Al12Si34 is a stable phase in this system. The chemical composition of the polycrystal sample was Ba7.64±0.08Al12.36±0.12Si34.01±0.34, which is close to that of single-crystal sample. It is considered that the slight difference of the lattice constants of the single- and polycrystal samples was dependent on Al contents.Reference Okamoto, Kishida, Tanaka and Inui9Figure 5 is the backscattered electron image of the polycrystal sample. Many grain boundaries and Al and Si precipitates were observed in the polycrystal sample. Seebeck coefficients of samples are shown in Fig. 6, and these values of the single- and the polycrystal sample at 500 °C were 44.5 and 53.0 μV/K, respectively. The Seebeck coefficient of the single-crystal sample was slightly lower than that of the polycrystal because Al content of the single-crystal was lower than that of the polycrystal. It is reported that samples containing much Al have high Seebeck coefficient in Ba8AlxGe46−x system (x < 16).Reference Uemura, Akai, Koga, Tanaka, Kurisu, Yamamoto, Kishimoto, Koyanagi and Matsuura11 The Seebeck coefficient of the single-crystal sample at room temperature with 26.2 μV/K was almost the same as that of the Ba8Al14Si31 with 25 μV/K reported by Kauzlarich and coworkers.Reference Condron, Kauzlarich and Nolas10 The electrical resistivity is shown in Fig. 7. The temperature dependence of the electrical resistivity shows that two samples were metals or n-type degenerate semiconductors. The electrical resistivities of the single- and the polycrystal sample at 500 °C were 0.49 and 0.95 mΩcm, respectively. The electrical resistivity of the single-crystal sample was much lower than that of the polycrystal. It is suggested that electron scattering decreased by the reduction of grain boundary. The electrical resistivity of the single-crystal sample at room temperature with 0.36 mΩcm was almost the same as that of the Ba8Al14Si31 with 0.3 mΩcm reported by Kauzlarich and coworkers.Reference Condron, Kauzlarich and Nolas10 The power factor of a thermoelectric material is expressed by S 2/ρ. The power factors of the single- and the polycrystal sample at 500 °C were 4.0 × 10⁻⁴ and 3.0 × 10⁻⁴ V2/K2Ωm, respectively. Single crystallization increased thermoelectric properties because of the reduction of electrical resistivity. According to first principle calculation by Nenghabi and Myles,Reference Nenghabi and Myles12 Ba8Al16Si30 is an intrinsic semiconductor because 16 electrons from 8 Ba atoms are compensated with 16 holes from 16 Al. Therefore, a sample included near 16 Al contents is a high-performance thermoelectric material in this system because the Seebeck coefficient increases with decrease of the carrier concentration. In our results, thermoelectric performance increased by single crystallization compared to the polycrystal samples. However, Al content of single-crystal sample was 12.07, which was much lower than 16. It is suggested that single-crystal Ba8AlxSi46−x included near 16 Al contents is a more efficient thermoelectric material.
Typical photograph of an ingot using CZ method.

Powder x-ray diffraction patterns of (a) polycrystal, (b) CZ sample, and (c) simulation.

Orientation imaging microscopy images of (a) polycrystal and (b) CZ sample.

Backscattered electron image of polycrystal sample.

Seebeck coefficients of single-crystal and polycrystal samples.

Electrical resistivity of single-crystal and polycrystal samples.

Chemical compositions of Czochralski (CZ) and polycrystal samples.
IV. CONCLUSION
We prepared single-crystal Ba8Al12Si34 clathrate by CZ method. Seebeck coefficient was almost the same as polycrystal, and electrical resistivity of the single-crystal sample was lower than that of the polycrystal because of reduction of electron scattering. Therefore, the power factor of the single-crystal sample was higher than that of the polycrystal sample. These results suggested that single crystallization is efficient for the improvement of the thermoelectric property in the Ba8AlxSi46−x clathrate.