I. INTRODUCTION
As semiconductor device dimensions continue to shrink, interconnect delays have become significant in comparison to transistor performance delays. The 2013 update to the ITRS roadmap details the difficult challenges for >22 nm node as the introduction of new dielectric materials to meet conductivity challenges and reduce dielectric permittivity. 1 For the 10 nm node, materials with k-values between 2.4 to 2.5 may still be utilized while retaining currently used integration scheme. However, a materials solution for the sub-7 nm node, that requires materials with a k value of 2.2, is not yet available. Reference Zhou and Zhang2 Amorphous fluorocarbon (a:C-F), amorphous hydrogenated carbon (a:C-H), DLC, and fluorinated DLC films have previously been individually evaluated as potential candidates for ultra-low-k dielectric applications.
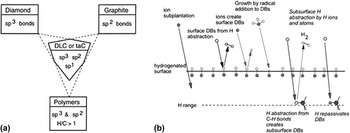
DLC is typically defined as “amorphous carbon (a:C) or hydrogenated amorphous carbon (a:C-H) with a significant fraction of sp 3 bonds”. Reference Ferrari and Robertson3 The three kinds of electronic hybridizations possible in C, namely, sp 3, sp 2, and sp 1 (Ref. Reference Wen, Li, Dong, Zhang, Yao, Cao, Wang, Ji and Jin4) impart to DLC an entire range of chemical, mechanical, electrical, and electrochemical properties. Figure 1 shows that DLC films can be comprised of a combination of these three types of bond hybridizations without being limited by the properties of any one type of allotrope. While DLC has properties similar to diamond in terms of its hardness, elastic modulus, and resistance to chemical attack, it is a completely amorphous thin film with no grain boundaries. Reference Grill5 It is possible to deposit a-C:H films with higher sp 2 and hydrogen contents using plasma-enhanced chemical vapor deposition (PECVD) techniques. The hydrogen passivates dangling bonds in the amorphous film and controls film structure and properties. While the mechanical properties of the film is primarily determined by the sp 3 content, rather than the sp 2 or hydrogen content, it is the clustering and orientation of sp 2 bonds as well as the cross-sectional structure that determines the films optical and electrical properties. Reference Ferrari and Robertson3 DLC has a higher dielectric value of <3.0 achieved after stabilization by heat treatment and has been utilized in a multilevel metal structure with the film being thermally stable at 400 °C. Reference Grill7 a:C-H films have also been used as adhesion layers between a-C:F and SiO2 for films with dielectric constant of 2.5. Reference Endo, Tatsumi, Matsubara, Horiuchi, Treichel, Jones, Lagendijk and Uram8
(a) Schematic indicating the regime of DLC in terms of bond hybridization. Reference Grill5 (b) Possible mechanisms for reaction in DLC film deposition in CH4/Ar plasma system. Reference Robertson6

Ion bombardment of the growing film is the primary mechanism for film growth since it is the impact of these ions that leads to the formation of sp 3 bonds. Therefore the substrate needs to be at a significant negative self-bias relative to the plasma. Several models for DLC growth have been discussed including the shock wave model, cylindrical spike model, subplantation model etc. Dissociation and ionization mechanisms in methane plasma leads to formation of several radicals and ionized species including CH3, CH2, CH, C, H, CH4 + etc. that are further lost to different surfaces including the electrode on which the sample is placed.
Some critical molecular reactions that occur in the plasma include
 $${\rm{C}}{{\rm{H}}_3} + {\rm{C}}{{\rm{H}}_2} \to {{\rm{C}}_2}{{\rm{H}}_4} + {\rm{H}}\quad {\rm{,}}$$
 $${\rm{C}}{{\rm{H}}_2} + {\rm{C}}{{\rm{H}}_2} \to {{\rm{C}}_2}{{\rm{H}}_2} + {{\rm{H}}_2}\quad .$$
In contrast, for a:C-F films, though k-values as low as 1.3 have been reported in the as-deposited state, thermal instability, high shrinkage rates, low mechanical strength, fluorine bond instability, and reactivity with Ti and Ta liners leading to delamination severely limits its use. Additionally F outgassing after thermal treatment poses difficulties in maintaining a sufficiently low k value. Fluorinated DLC films with k-value less than 2.5 after a stabilization treatment have also been prepared. Reference Grill7 As part of this research work, dielectric stacks consisting of layered:C-F and DLC films were tailored for utilization in ultra-low-k dielectric layers in very-large-scale integrated (VLSI) circuits. Three types of integrated stacks of a:C-F layered with a:C-H were prepared and characterized. This publication focuses on the structural and mechanical properties of the film such as film integrity, adhesion, roughness, shrinkage rate, and bonding structure. Evaluation of the electric properties of the film will be published elsewhere.
II. EXPERIMENT
A commercially available plasma deposition tool (UNAXIS 790 SERIES, Plasma-therm, St. Petersburg, Florida) has been used to deposit films containing fluorine and carbon. Detailed procedure for a:C-F film deposition and results from film optimization and characterization has been published elsewhere. Reference Sundaram, Lee, Goeckner and Overzet9 In short, a design of experiments (DOE) was performed by varying chamber pressure (300–700 mTorr), power (40–100 W), platen temperature (120–200 °C), and flow rate ratio (FRR) between CF4 and Si2H6 precursor gases (12.5–30). The modified Gaseous Electronics Conference (mGEC) reference cell was used to deposit DLC films using CH4 and argon as precursors. The reactor, process details, and partial characterization of the DLC film obtained using this process are described elsewhere. Reference Sundaram, Ramachandran, Lee, Overzet and Bustarret10 The reactor consisted of a top, bottom, and grounded electrode in the center, with the bottom electrode capacitively coupled to a 13.56 MHz rf power source through a L-type matching network.
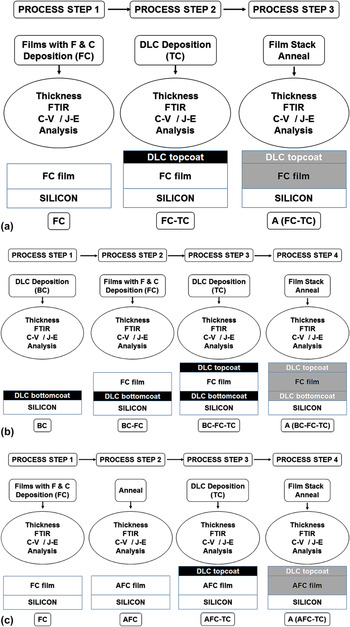
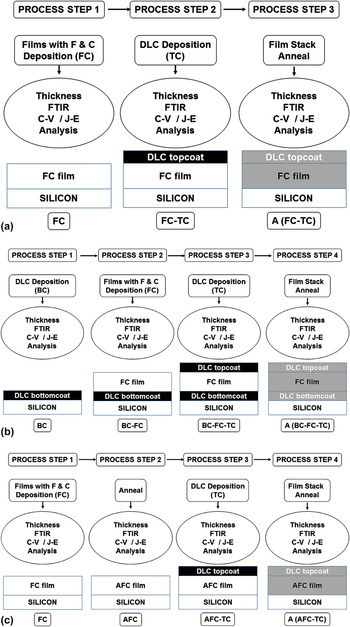
Layered a:C-F/a:C-H films were prepared with three different stack configurations using the process flow detailed in Fig. 2 and subsequently evaluated. Partition studies—where wafers are evaluated down the process flow, i.e., before and after deposition and annealing—were undertaken using Fourier transform infrared spectroscopy (FTIR) and optical microscopy. In terms of nomenclature, acronym FC refers to a fluorocarbon film, TC refers to a top coating of DLC, BC to a base coating of DLC, and the prefix “A” is utilized to denote an annealed film. For e.g., AFC-TC denotes a fluorocarbon film that has been annealed and coating of DLC film has been applied on top of it while A(FC-TC) indicates that a fluorocarbon film that has a top coating of DLC applied to it and subsequently, the entire film stack was annealed together.
Schematic of process flow and partitioning study utilized to generate film stacks (a) FC-TC, (b) BC-FC-TC, and (c) AFC-TC.
Si wafers were cleaned using standardized RCA methods before deposition. Immediately before being placed in the deposition chamber, wafers were swabbed with 50:1 HF solution to remove native oxide. To study the structural properties of DLC thin films, laser excitation of 633 nm was utilized in a Jobin Yvon Labram high-resolution micro-Raman spectrometer (Horiba Scientific, Kyoto, Japan). Films were characterized by measurement of film thickness, refractive index, average roughness (R a), average distance between the highest peak and lowest valley in the sampling length (R zDIN), root mean square (R rms) values, and contact angle with water. Annealing was performed by placing films in a MiniBrute tube furnace (Thermoco Systems, Orange County, California) in Ar ambient for 1 h at 400 °C. X-ray diffraction (XRD) and FTIR was utilized to characterize film structure. Surface morphology was analyzed using scanning electron microscopy and atomic force microscopy.
III. RESULTS AND DISCUSSION
First, results from the as-deposited and heat treated thin DLC film utilized for both Top Coat and Base Coat are reported and discussed. Next, data related to film survival rate is reported and the theoretical stress resulting from intrinsic and thermal contributions is analyzed. Microstructural evaluation of failed films is utilized to provide insight into the primary cause for film integrity issues. Subsequently, IR analysis of viable films in the as-deposited, layered, and heat treated form, are reported and discussed to understand structural variation in the film due to not only the layering process but also thermal anneal. Finally, the effect of process conditions on film thickness, roughness, and contact angle is analyzed by plotting each of these variables with the three tunable process parameters: process pressure, substrate temperature, and FRR to optimize the process window.
A. Characterization of thin DLC film utilized for top and base coat
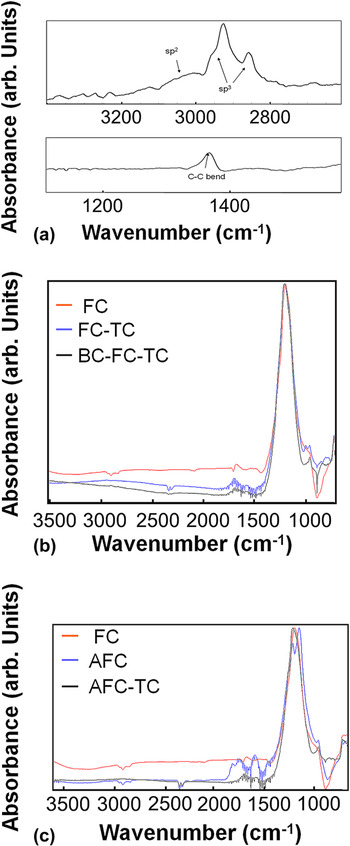
Raman spectra of the as-deposited film exhibited a broad peak centered around 1550 cm−1 indicating the presence of DLC and the film is closer to diamond like a:C-H as opposed to polymer-like a:C-H. Reference Sundaram, Ramachandran, Lee, Overzet and Bustarret10 Energy dispersive X-ray spectroscopy (EDS) confirmed the presence of carbon and absence of significant amounts of oxygen. The FTIR spectrum [Fig. 3(a)] exhibits the C–H stretch band in the 2800–3100 cm−1 region, a strong peak in the 2800–3100 cm−1 region corresponding to sp 3 coordinated carbon and a weak peak in the 3000–3100 cm−1 region attributed to aromatic or olefinic sp 2 carbon coordination. Reference Lai, Lai, Chiue, Chen, Chang and Lin11 Of interest is the presence of a small peak at around 1220 cm−1 associated with C–C bending mode in low sp 3 carbon samples. Reference Senkevich and Sherrer12 Additionally XRD spectra of the thin DLC film before and after annealing showed peaks corresponding to the (004) graphite and (122) n-diamond planes revealing the presence of sp 2 and sp 3 hybridized clusters. Reference Wen, Li, Dong, Zhang, Yao, Cao, Wang, Ji and Jin4,Reference Senkevich and Sherrer12
FTIR absorption spectra of (a) As-deposited and post anneal top-coat DLC film, (b) As-deposited BC-FC-TC/FC/FC-TC sandwich layers, and (c) FC/AFC/AFC-TC layers.

B. Layered films: Post deposition survival rate
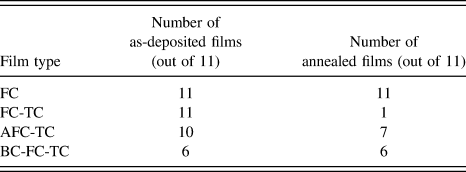
The number of as-deposited FC-TC , AFC-TC, and BC-FC-TC films that survived the high energy DLC deposition process to yield films with uniform morphology and good adhesion is summarized in Table I. While every effort was made to achieve the goal of creating and analyzing data from a crossed design, several films disintegrated upon deposition or post heat treatment. Majority of AFC-TC and BC-FC-TC survived heat treatment indicating that techniques used to preserve film integrity can include either annealing of the original FC film, providing a bottom coat of DLC in addition to the top coat or potentially a combination of the two.
Number of viable a:C-F and DLC film stacks.

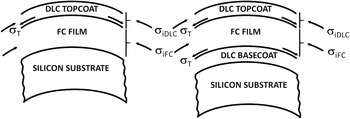
It should be noted that the coefficient of thermal expansion of a:C-H films is of the order of 1 × 10⁻⁶ K−1 to 7 × 10⁻⁶ K−1 Ref. Reference Marques, Lacerda and Champi13 while that of a:C-F films is much higher at 3.5 × 10⁻⁵ K−1. Reference Morgen, Ryan, Zhao, Hu, Cho and Ho14 Both a:C-H and a:C-F films typically exhibit compressive internal stresses. Reference Jin, Ajmera, Lee and Singh15,Reference Lacerda and Marques16 The internal stress of the a:C-F film (σiFC) is expected to be in the range of 11.6–23.2 MPa Ref. Reference Jin, Ajmera, Lee and Singh15 while that of DLC (σiDLC) has been reported to reach values of several gigapascals. Reference Lacerda and Marques16 Utilizing commonly available mathematical models for interface stress analysis Reference Evans and Hutchinson17 and values of Young's modulus and Poisson's ratio from literature, Reference Wei, Sharma, Sankar and Narayan18,Reference Jansen, Gardeniers, Elders, Tlmans and Elwenspoek19 the polarity and magnitude of surface and average stresses in each layer of this multilayered film was calculated.
Ratio of film thicknesses is an important metric that determines the relationship between the average residual stress and misfit stress (σΤ), whether the polarity of the stress that is developed at the top of each layer is opposite in sign to that of the misfit stress and if it is large in magnitude as compared to the average stress in that layer. σΤ varies with the deposition temperature utilized for each layer. For this reason, calculations were performed with values of the thinnest and thickest Fluorocarbon film and using both 120 and 200 °C as deposition temperatures.
For the film comprising of a bottom fluorocarbon layer with a top coat of DLC (Fig. 4), the fluorocarbon film exhibits a reduction in the internal compressive stress in the range of 1% to 9% of its original value. Stresses in the DLC film continue to be dominated by the large intrinsic compressive stress value with an average value that is 2 orders of magnitude lower than the nonlayered film. At the very top of the DLC layer, a tensile stress is developed with a magnitude that is one to two orders lower than that of the intrinsic stresses in the DLC film.
Schematic of the polarity of interface and internal stresses.

In contrast, for the film comprising of a fluorocarbon layer sandwiched between two DLC layers, while the effect on the top coat of DLC remains the same, the average fluorocarbon film stresses also drops by one order of magnitude. In addition, this film develops a tensile surface component that is an order of magnitude lower than the internal stress of this film. As expected, the contribution of deposition temperature or film thickness to these values is insignificant.
In summary, addition of just a top coat of DLC to a fluorocarbon film results in lowering the average stresses in the DLC layer and the generation of a significantly large tensile stress on the top of this film surface without overly affecting stresses in the fluorocarbon layer. Addition of a base coat of DLC to this stack, results in the same phenomenon but in addition, significantly lowers the average stress of the fluorocarbon film and results in the generation of a tensile stress on the surface of the fluorocarbon film. This correlates well with observed data showing increased survival of as deposited BC-FC-TC films compared to FC-TC films.
C. Morphology of buckling delamination and interface fracture in nonviable as-deposited films
Wafers were removed after each process step in the flow and evaluated. Three categories of films were identified—film retains its integrity (Type I), film degradation occurs because of crater and blister formation in a mostly smooth background (Type II) and film exhibits overt background buckling in addition to crater formation (Type III).
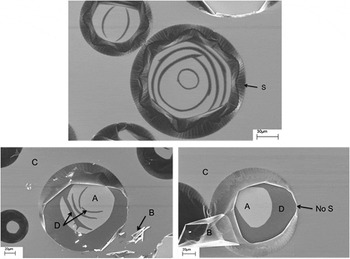
As-deposited thin DLC films that delaminated post deposition from a blank Si substrate (Fig. 5), exhibit crater-like structures sized between 50 μ and 200 μ that closely resemble Type II failed films. Striations (S), related to buckling with the top layer being intact, are absent at the edge of the peeled film (Marked “No S”) and present at the edge of these craters. This confirms that this type of wrinkled delamination of film B is confined to the top-surface layer. Although it is tempting to ascribe the term “phase” to each “region”, compositional analysis is required to confirm this hypothesis. Keeping in mind the presence of n-diamond from XRD results, an explanation for these structures could be derived from an understanding of the stacking of lattice planes in hexagonal diamonds where the planes are stacked in an -AB-AB-AB- fashion along the (111) direction unlike in cubic diamonds where they are stacked in an -ABC-ABC- fashion. The formation of staggered bonds within the layer and eclipsed bonds between layers is another property of these diamonds. Reference Roul, Nayak, Mishra and Mohanty20 Light region (A) probably contains defects on the graphitic structure that serve as nucleation sites for nano-diamond growth with some preferred growth orientation.
Scanning electron micrographs of delamination in thin a:C-F film after DLC deposition showing regions A, C, D, delaminated film B and striations (S) at the crater edge. Area marked “No S” that shows film B delamination with striations is associated with the top-surface layer.

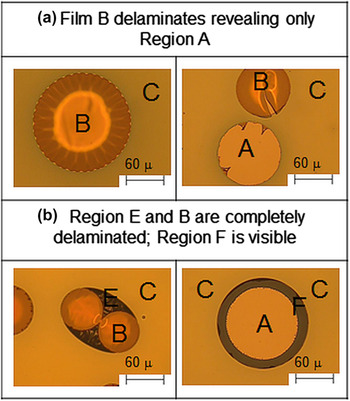
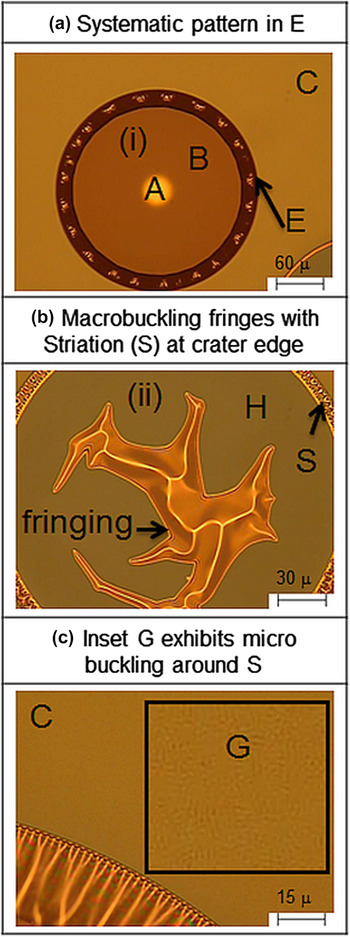
Type II failed films exhibit delamination of Region B to expose Region A. Our data shows that Type II failure classification is identified in heat treated samples where the parent fluorocarbon film is deposited with process condition FRR 30 or higher. For e.g., micrographs of A(FC-TC) (Fig. 6) exhibiting this failure type reveal the presence of similar areas with physically distinct regions A, B, and C. In other locations in the same sample, film stress created by differential thermal expansion results in a combination of very slight background microbuckling (inset G, Fig. 7), macrobuckling (Region ii), systematic patterns (Region E & S), and film thickness variation (Region H). Reference Bowden, Brittain, Evans, Hutchinson and Whitesides21 Telephone cord buckling delamination of DLC on Si and glass substrates has previously been reported in literature. Reference Moon, Jensen, Hutchinson, Oh and Evans22
Optical micrographs of annealed thick a:C-F film after DLC deposition exhibiting Type II failure showing (a) only regions A, B and C similar to thin a:C-F film after DLC deposition and (b) additional region E and region F instead of region D.

Optical micrographs of annealed thick a:C-F film after DLC deposition with areas showing (a) systematic pattern in E at (i), (b) border fringing with macrobuckling and new region, and (c) onset of microbuckling in C (inset G).

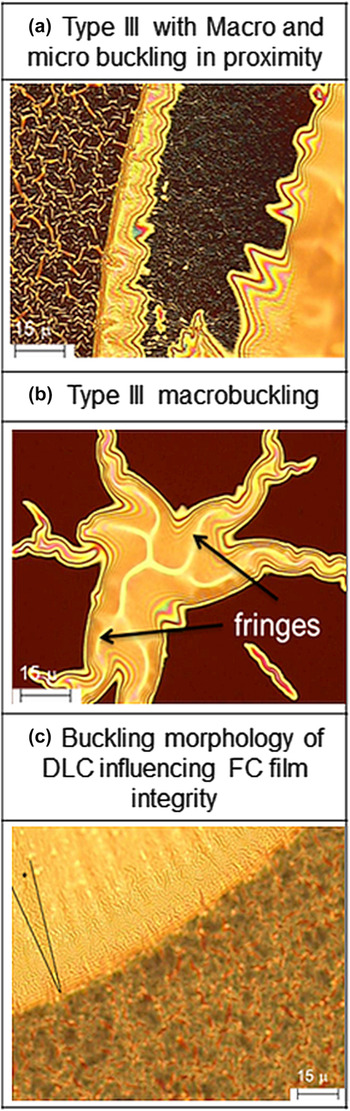
Films deposited using FRR 25 or lower or using FRR 30 at 120 °C exhibit a higher degree and extent of microbuckling in Region C (background region of Fig. 8). While this appears to lead into the hypothesis that annealing of a carbon rich phase has resulted in nucleation and grain growth related failure, these images are in fact identical to those obtained from simulation results of layered films under biaxial compression where the postbuckling morphology evolves from concomitant wrinkling to random buckle-delamination blisters. Reference Pan, Ni, He and Huang23 Of the different kinds of buckling morphology, zig-zag, stripes, or labyrinth, stripes morphology is clearly observed in the region where macrobuckling and microbuckling fringes meet.
Optical micrographs of annealed thick a:C-F film after DLC deposition showing (a) macro and microbuckling with fringe formation, (b) Type III failure related macrobuckling, and (c) influence of DLC buckling on FC film integrity.

Given that there is no difference in bonding configuration or F/C ratio for films deposited at FRR 30 as compared to those at FRR 25 and below, the oxygen content is the lowest at FRR 30, and the presence of oxygen results in enhanced polycrystalline growth in DLC films Reference Das, Singh, Barney, Jackson and Mukhopadhyay24 increasing the likelihood for thermally activated failure, it can be deduced that in annealed films, the root cause for delamination is phase transitions resulting in buckling delamination in addition to thermal stresses and structural changes detailed below.
D. Partition study: FTIR
First, comparisons of the FTIR spectra were made within the group of samples with bottom coated DLC films and found to be similar to each other and closely match the corresponding parent FC film for investigated process conditions. Next, spectra of films after adding a Top Coat DLC to Fluorocarbon films was compared to those of layered films with BC-FC-TC (see Fig. 3) to determine variation in the bonding structure by the addition of a base coat. A slight shoulder between 1031 and 960 cm−1 (CF/CF2) in the FC-TC film was absent in the spectra of the BC-FC-TC layered stack. Comparing FC-TC to virgin FC films, notably additional bands between 2831–3641 cm−1 (CH/CH2/C–H stretch), 3670 cm−1 (Si–OH), 2154–2093 cm−1 (Si=Si=H2/Si3≡SiH), 1750–1399 cm−1 (C–H absorption modes, C=O or keto groups), 1700 cm−1 (carbonyl groups) were visible. In addition, spectra of both AFC-TC and FC-TC consisted of a band and shoulder between 973–760 cm−1 corresponding to Si–O/Si–OH/Si–F/Si–F2 type bonds.
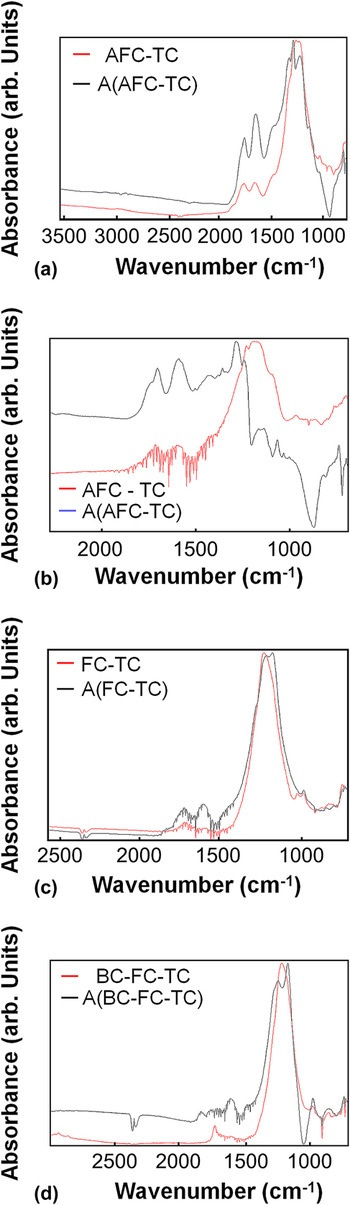
Next the transition from A(FC) to AFC-TC was analyzed. Within the subgroup, Top Coated films appeared similar to each other exhibiting the presence of a primary broad peak between 900 and 1400 cm−1 corresponding to random arrangements of the CF x group configuration (CF, CF2, and CF3 type bonds), a shoulder around 980 cm−1 corresponding to C–F bond vibrations and a peak around 1220 cm−1 corresponding to the CF2 asymmetric stretching mode. The transition however, was characterized by a large change—inclusive of both a leftward shift of the central FC peak and a merging and broadening of split peaks generated by annealing fluorocarbon films—confirming the existence of significant structural modifications in the underlying film. For e.g., Fig. 3(c) shows peaks at 1282/1237/1173 cm−1 merge and converge to a broad peak centered on 1192 cm−1. The transition structurally reconverts the annealed film to the as-deposited form with the exception of peaks at 1638 cm−1 (C=C) and 1725 cm−1 (C=O or keto groups). Third, the rather benign transition from FC-TC to A(FC-TC) (Fig. 9) was determined to be characterized by the disappearance of the peak at 1020 cm−1 (C–O stretch). The central peak shifts to the right and the peak at 1608 cm−1 (C=C) gains prominence.
FTIR absorption spectra of layered FC-TC films before and after heat treatment: (a) AFC-TC (b) AFC-TC showing expanded region between 2000 cm−1 to 1000 cm−1 (c) FC-TC (d) BC-FC-TC.

The transition from AFC-TC to A(AFC-TC) is characterized by the presence of prominent peaks at 1721 cm−1 (CF2=C) and 1591 cm−1 (C=C) after anneal. Peaks between 1030 and 1160 cm−1 associated with CF3, CF in CF2, and CF2 symmetric stretch, disappeared after heat treatment. In this case, two variations in the transition spectra were identified within the subgroup—the first where the broad peak between 900 and 1400 cm−1 (CF/CF2) split into multiple peaks as in an annealed FC film Reference Sundaram, Lee, Goeckner and Overzet9 and the second where this peak gradually disappeared except at 1197 cm−1 (CF/CF2), along with a residual peak between 1283 cm−1 to 1350 cm−1.
Finally, considering BC-FC-TC to A(BC-FC-TC) , annealed samples possess an additional peak at 1608 cm−1 (C=C stretch) without a shoulder at 1041 cm−1. Removal of CF x type and F constituents Reference Grill and Patel25 results in the loss of the shoulder corresponding to C–F bond vibrations at 980 cm−1 in post anneal BC-FC-TC films. The distinct peak at 2930 cm−1 (C–H stretch) in the as-deposited sample disappears upon heat treatment providing evidence for hydrogen loss upon annealing. The peak at 1732 cm−1 (CF2=C) in the as-deposited sample expands and splits into multiple peaks between 1828 to 1607 cm−1 (C=C groups). The only difference in the spectra of different annealed samples in this category is the variation of size and location of distinct CF2 peaks, attributed to the doublet observed in bulk polytetrafluoroethylene (PTFE), between 1244 and 1177 cm−1. Reference Senkevich and Sherrer12
In summary, from a structural perspective, the increased thermal stability of AFC-TC is attributed to the fact that DLC deposition converts components in the annealed fluorocarbon film to the original as-deposited state while that of BC-FC-TC films, taking into account the absence of specific Si–F/Si–F2 type components in the as-deposited layered film and the presence of CF2 peaks after annealing is attributed to lowered fluorine loss from Si as compared to just FC-TC films. In contrast, for the nonannealed FC film, DLC top coat results in hydrogen and Si incorporation. Loss of film integrity of this stack is attributed to the fact that annealing results in increased hydrogen and fluorine loss from the film leading to a closed network.
E. Shrinkage rate, roughness, and contact angle
Process parameters utilized for fluorocarbon deposition modify bonding configuration and chemical composition and strongly influence film properties. Some properties relevant for integration include deposition rate, shrinkage rate, contact angle, and roughness.
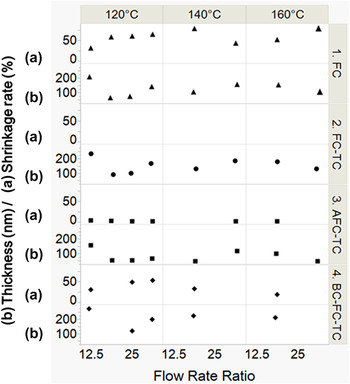
Shrinkage rates for all fluorocarbon samples was initially high but extremely low (<2%) after stabilization anneal (Fig. 10). Stabilization treatment has previously been successfully incorporated on fluorocarbon films to lower shrinkage rates from 40–60% to values of the order of 2–5%. Shrinkage rates of AFC-TC films were very low in comparison to the BC-FC-TC sandwich. FTIR analysis shows that Top Coat DLC deposition structurally restores the annealed film close to its original state. Therefore low shrinkage rates observed in this film is readily attributed to lower fluorine outgassing. BC-FC-TC stacks that survived DLC Top Coat deposition also survived heat treatment. This is in agreement with FTIR data showing additional Si–O/Si–OH/Si–F/Si–F2 type bonds in this stack as compared to the FC-TC film without a Base Coat.
Variation of film (a) shrinkage rate and (b) thickness as a function of FRR for deposition at 120, 140 and 160 °C for films (1) FC (2) FC-TC (3) AFC-TC, and (4) BC-FC-TC. Extremely low shrinkage rates are observed in the doubly annealed AFC-TC films.

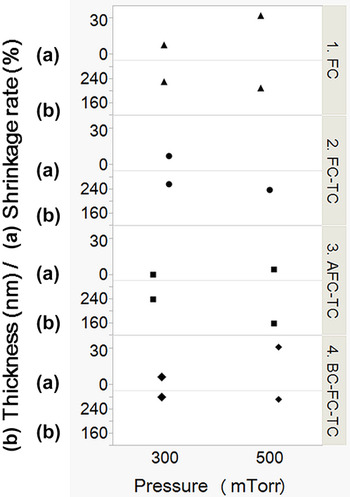
Most BC-FC-TC films at FRR 30 disintegrated as compared to those at FRR 20 even though the FC films are structurally similar with lower oxygen content. The film deposited at 300 mTorr survived with its properties falling in a different population as compared to the film deposited at 500 mTorr (Fig. 11). a:C-F films deposited at 300 mTorr possess Si–O and Si–F bonds and there is no signal from Si at 500 mTorr even though silicon incorporation is expected for deposition using Si2H6 as a precursor. Since loss of hydrogen and CH x type species occurs at around 400 °C in DLC, mass loss related to film shrinkage is attributed to hydrogen loss further reiterated by an observed reduction in dielectric constant with annealing (data to be published).
Variation of film (a) shrinkage rate and (b) thickness as a function of pressure for deposition at 100 W, FRR 12.5, 120 °C for films (1) FC, (2) FC-TC, (3) AFC-TC, and (4) BC-FC-TC.

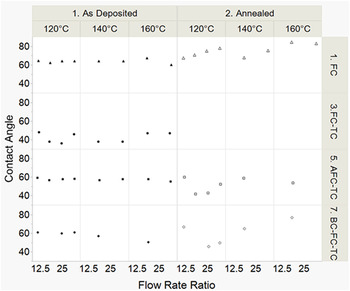
Contact angle and roughness measurements are good indicators of wetting and adhesion which is expected since a:C-F films have a higher contact angle in comparison to a:C-H films (Fig. 12). Surprisingly AFC-TC and BC-FC-TC films have higher contact angles compared to FC-TC which was originally hypothesized to be due to the effect of underlying film morphology. However, FTIR data from FC-TC indicates that fluorocarbon films deposited using a process pressure of 500 mTorr contain Si. The effect of Si in increasing surface energy has been extensively studied and verified. Reference Grischke, Hieke, Morgenweck and Dimigen26
Variation of contact angle with water as a function of FRR for films deposited using process conditions 500 mTorr and 100 W.

Surface roughness and morphology were measured before and after heat treatment using an scanning probe microscope in tapping mode. All films had R a < 10 nm and R zDIN < 100 nm indicating that the film surface is smooth and suitable for semiconductor processing.
IV. CONCLUSIONS
Three different a:F-C and a:C-H stacks were generated as potential candidates for use as ultra low-k (ULK) dielectric materials in the back end of line (BEOL). DLC film and a:F-C films were deposited using a PECVD process using CH4/Ar and CF4/Si2H6/Ar gas as precursors. Buckling delamination is the primary failure mode for adhesion loss and is associated with stress failure and phase transitions from nanodiamond to graphite in the as-deposited and heat treated form. Of the three different stacks of a:C-H films layered with a:F-C films that were evaluated, Annealed Fluorocarbon with Top Coat DLC film s exhibited the highest thermal stability. FTIR spectra of Fluorocarbon films with Top Coat DLC and Base Coated DLC film-Fluorocarbon-Top Coated DLC films and annealed films closely resemble the parent FC film. Majority of Annealed Fluorocarbon with Top Coat DLC and Base Coat DLC - Fluorocarbon - Top Coat DLC survived heat treatment indicating that techniques used to preserve film integrity can include either annealing of the base FC film, providing a bottom coat of DLC or potentially a combination of the two. FRR ratio of CF4:Si2H6 at of 30 resulted in a:F-C films with lower oxygen content, increased resistance to adhesion failure upon thermal treatment and a lower degree and extent of buckling. Thickness variation after heat treatment, roughness and contact angle of films before and after heat treatment indicated that the films are conformal, with smooth morphology, and contact angle with water between 40° and 70°.
ACKNOWLEDGMENTS
The authors are sincerely grateful to the personnel at the University of Texas at Dallas (UTD) for their assistance. This work was partially supported by Lockheed Martin and UTD.