
Introduction
The stacking of two-dimensional layers into heterostructures with emerging properties is currently at the forefront of materials science research [Reference Geim and Grigorieva1, Reference Ferrari, Bonaccorso, Fal’ko, Novoselov, Roche, Bøggild, Borini, Koppens, Palermo, Pugno, Garrido, Sordan, Bianco, Ballerini, Prato, Lidorikis, Kivioja, Marinelli, Ryhänen, Morpurgo, Coleman, Nicolosi, Colombo, Fert, Garcia-Hernandez, Bachtold, Schneider, Guinea, Dekker, Barbone, Sun, Galiotis, Grigorenko, Konstantatos, Kis, Katsnelson, Vandersypen, Loiseau, Morandi, Neumaier, Treossi, Pellegrini, Polini, Tredicucci, Williams, Hong, Ahn, Kim, Zirath, van Wees, van der Zant, Occhipinti, Matteo, Kinloch, Seyller, Quesnel, Feng, Teo, Rupesinghe, Hakonen, Neil, Tannock, Löfwander and Kinaret2, Reference Kuc, Heine and Kis3, Reference Robinson4, Reference Novoselov, Fal’ko, Colombo, Gellert, Schwab and Kim5]. Understanding the interactions between layers is of paramount importance, especially when considering the effects of different stacking arrangements. For example, single layers of graphene exhibit much improved carrier mobility when they are placed on [Reference Dean, Young, Meric, Lee, Wang, Sorgenfrei, Watanabe, Taniguchi, Kim, Shepard and Hone6] or encapsulated between [Reference Mayorov, Gorbachev, Morozov, Britnell, Jalil, Ponomarenko, Blake, Novoselov, Watanabe, Taniguchi and Geim7] hexagonal boron nitride instead of resting on a silicon oxide substrate, and the superconducting critical temperature of the NbSe2 layers in [(SnSe)1+δ]m(NbSe2)1 is found to decrease with increasing SnSe content due to charge transfer between layers [Reference Grosse, Alemayehu, Mogilatenko, Chiatti, Johnson and Fischer8]. Changing the composition and stacking sequence of layers in heterostructures consisting of MoS2 and WS2 allows for the fabrication of devices with tunable tunnel resistance or band-engineered tunnel diodes [Reference Kang, Lee, Han, Gao, Xie, Muller and Park9]. The misfit layer chalcogenides, consisting of alternating layers of a metal chalcogenide and a transition metal dichalcogenide (TMDC), are a promising class of materials for thermoelectric applications, but the control over composition and layering sequence is limited to a few thermodynamically stable compounds accessible via high-temperature synthesis approaches [Reference Wiegers10, Reference Rouxel, Meerschaut and Wiegers11, Reference Merrill, Moore, Bauers, Falmbigl and Johnson12].
Preparing samples with the desired stacking arrangements is a great challenge in the experimental study of two-dimensional materials and heterostructures. High-quality samples and devices can be prepared by manual mechanical stacking of exfoliated layers [Reference Withers, Pozo-Zamudio, Mishchenko, Rooney, Gholinia, Watanabe, Taniguchi, Haigh, Geim, Tartakovskii and Novoselov13]. To pave the way toward wafer scale production, different scalable manufacturing techniques, such as sequential chemical vapor deposition (CVD), direct growth of TMDC heterostructures by vapor–solid reactions, and van der Waals epitaxy, have been under consideration [Reference Novoselov, Mishchenko, Carvalho and Neto14], but different growth conditions for each layer limit the complexity that may be achieved [Reference Liu, Weiss, Duan, Cheng, Huang and Duan15].
A developing approach to heterostructures that enables wafer scale samples is the self-assembly of designed precursors consisting of a repeating sequence of deposited elemental layers. By precisely controlling constituents and layering sequences of the precursors, a virtually unlimited number of heterostructures can be realized experimentally [Reference Esters, Alemayehu, Jones, Nguyen, Anderson, Grosse, Fischer and Johnson16, Reference Westover, Atkins, Falmbigl, Ditto and Johnson17]. While this self-assembly approach can produce specific stacking sequences, the rotational orientation of the layers cannot be controlled, resulting in a random rotational alignment of the layers with respect to each other [Reference Beekman, Heideman and Johnson18].
Here, we explore the electronic properties of [(SnSe)1+δ]m(TiSe2)n heterostructures, consisting of m bilayers of SnSe and n layers of TiSe2 in the supercell. Prior research on the (MS)1+δ(TiS2)2 misfit layer compounds showed that the intergrowths containing M = Sn are of special interest for thermoelectric applications [Reference Wan, Wang, Wang and Koumoto19], and high Seebeck coefficients sensitive to the layering sequence have been observed in similar selenide compounds grown via self-assembly of designed precursors [Reference Merrill, Moore, Ditto, Sutherland, Falmbigl, Winkler, Pernau and Johnson20, Reference Li, Bauers, Poudel, Hamann, Wang, Choi, Esfarjani, Shi, Johnson and Cronin21]. In contrast to the rotational disorder usually present in samples prepared by this synthesis approach, samples with m = n = 1 showed relatively large regions with long-range order [Reference Hamann, Merrill, Bauers, Mitchson, Ditto, Rudin and Johnson22]. A series of samples with m = 1, …, 4 and n = 1 showed unusual transport behavior [Reference Hamann, Lygo, Esters, Merrill, Ditto, Sutherland, Bauers and Johnson23], emphasizing the importance of furthering the understanding of the electronic interactions in this kind of system. Finding proof for the presence of a potential charge transfer into TiSe2 is of special interest, since the controlled doping of TiSe2 can be used to finely tune electronic transitions such as charge density waves or superconductivity [Reference Morosan, Zandbergen, Dennis, Bos, Onose, Klimczuk, Ramirez, Ong and Cava24, Reference Morosan, Wagner, Zhao, Hor, Williams, Tao, Zhu and Cava25]. X-ray photoelectron spectroscopy (XPS) has proven to be an effective method to investigate the electronic structure of these systems, as evidence for electron transfer from the metal selenide layer (M = Pb or Sn) into the transition metal dichalcogenide layer was found for (MSe)1+δ(NbSe2)2 [Reference Göhler, Mitchson, Alemayehu, Speck, Wanke, Johnson and Seyller26]. In this work, photoelectron spectroscopy was used on a series of [(SnSe)1+δ]m[TiSe2]2 compounds with m = 1, 2, 3, and 7, as well as binary samples of the constituents TiSe2 and SnSe.
Synthesis and structure
Binary SnSe and TiSe2 and a series of [(SnSe)1+δ]m[TiSe2]2 heterostructures with m = 1, 2, 3, and 7 and were prepared from designed amorphous precursors by physical vapor deposition. A repeating sequence of elemental Ti, Sn, and Se layers was deposited in an order that mimicked the architecture of the desired product [Reference Merrill, Moore, Ditto, Sutherland, Falmbigl, Winkler, Pernau and Johnson20, Reference Hamann, Lygo, Esters, Merrill, Ditto, Sutherland, Bauers and Johnson23, Reference Johnson27]. For example, to make the m = 2 compound, the repeating sequence Ti|Se|Ti|Se|Sn|Se|Sn|Se was deposited. For the Sn|Se and Ti|Se bilayers, a 1:1 ratio of Sn to Se and a 1:2 ratio of Ti to Se, respectively, were targeted with a layer thickness similar to that of the desired product. The sequence of bilayers was repeated until a sample of about 50 nm in total film thickness was reached. The amount of material required to obtain the correct ratio in the Sn|Se layers and Ti|Se layers with the right layer thickness was determined using X-ray fluorescence (XRF) in combination with various X-ray diffraction (XRD) techniques [Reference Hamann, Bardgett, Cordova, Maynard, Hadland, Lygo, Wood, Esters and Johnson28].
The layered precursors were converted into the desired crystalline products by annealing on a hot plate in an N2 atmosphere with <1 ppm of oxygen present. The optimal annealing conditions for SnSe and TiSe2 were estimated from prior studies. An annealing study completed on TiSe2 previously reports the ideal annealing temperature to be 350 °C for 30 min when annealed in an N2 atmosphere with less than 0.5 ppm of oxygen present [Reference Moore, Sitts, Stolt, Beekman and Johnson29]. In a recent study, SnSe films were crystallized at 350 °C for 30 min in an N2 atmosphere [Reference Chen, Hamann, Choi, Poudel, Shen, Shi, Johnson and Cronin30].
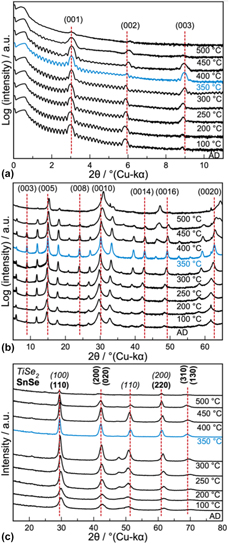
An annealing study of the m = 3 precursor was conducted to determine the best annealing temperature to crystallize the targeted [(SnSe)1+δ]m[TiSe2]2 compounds. Figure 1 contains the X-ray reflectivity (XRR), specular XRD, and in-plane XRD data collected on the m = 3 precursor as it was annealed at the indicated temperatures for 30 min. The as deposited XRR pattern contains both Kiessig fringes and the first three Bragg reflections resulting from the repeating sequence of elemental layers. The Kiessig fringes result from interference between the front and back of the film and depend on the smoothness of these interfaces. As the sample is annealed at increasing temperatures, the fringes extend out to higher angles indicating smoother interfaces. Above 450 °C, the Kiessig fringes decrease in intensity. By 500 °C, the Kiessig fringes are gone, indicating that the film has become significantly rougher. The diffraction maxima in the XRR scans result from the artificial layering of the designed precursor from the sequence of deposited elemental layers. As the sample is annealed to higher temperatures, these reflections shift to higher angles, indicating that the repeat unit thickness is getting smaller. The reflections become commensurate with the 00l reflections present at higher angles as the artificial layering evolves into the product. Above 450 °C, the Bragg reflections decrease in intensity. After the 500 °C annealing, some of the Bragg reflections are no longer visible, indicating that the metastable product is decomposing. The reflections in the as-deposited specular diffraction pattern can all be indexed as 00l reflections. As the sample is annealed at increasing temperatures, additional reflections grow in and the reflections systematically shift to higher angles, indicating that the c-axis lattice parameter is decreasing. The diffraction pattern after annealing at 350 °C contains the most reflections. After annealing at this temperature, the reflections all have similar line widths and can be indexed as 00l reflections of [(SnSe)1+δ]m[TiSe2]2. The reflections broaden and are reduced in intensity when annealed at 400 °C or higher, indicating that the desired product is decomposing. The in-plane diffraction pattern of the as deposited sample contains reflections that can be indexed as those from a rectangular and a hexagonal unit cell. The a-axis lattice parameter of the hexagonal unit cell matches that expected for TiSe2. The rectangular lattice parameters are slightly larger than expected for SnSe. On annealing, the lattice parameters of the rectangular unit cell decrease, and weak reflections consistent with the formation of SnSe2 appear after annealing at 200 °C. The SnSe2 reflections are no longer present after annealing at 350 °C, and the in-plane lattice parameters are consistent with those expected for SnSe and TiSe2. After annealing at 500 °C, the intensity of the in-plane reflections are all decreased in intensity, which is consistent either with decomposition or a decrease in preferred alignment of the crystallites. We concluded that the optimal annealing temperature is 350 °C, as shown in blue in all three of the data sets in Fig. 1.
XRR (a), Specular XRD (b), and in-plane XRD (c) of the representative [(SnSe)1+δ]m[TiSe2]2 sample with m = 3 as deposited (AD) and annealed at various temperatures. The diffraction pattern of the sample annealed at 350 °C and studied by HAADF-STEM and XPS is highlighted. Dashed lines indicate the position of the Bragg reflections expected for a well crystalized sample.

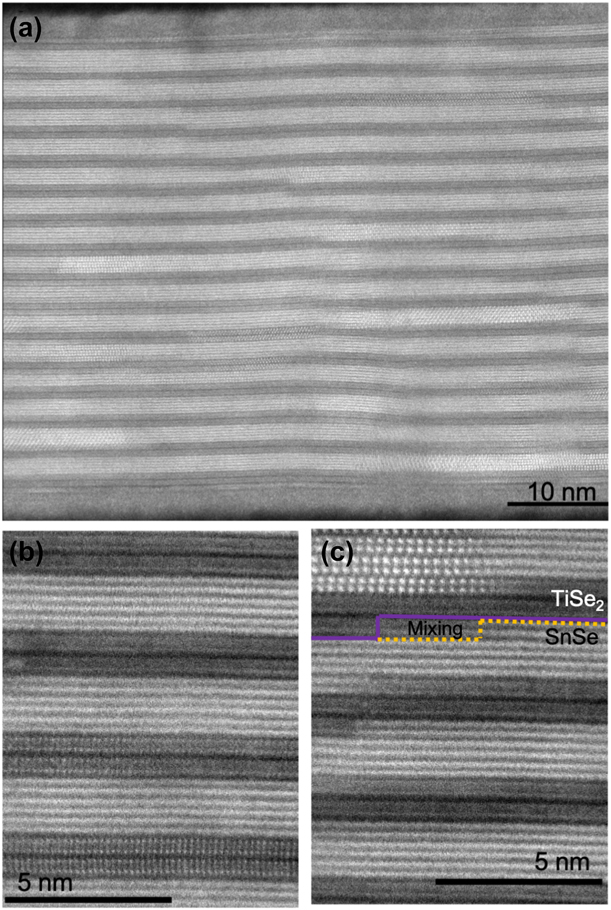
High-angle annular dark-field scanning transmission electron microscopy (HAADF-STEM) images were collected on a representative sample to provide real space images as well as a local structure picture of the material. Figure 2(a) shows the entire cross-section of the film, from surface to substrate, demonstrating the formation of the desired compound throughout the film. There are clearly 3 bright SnSe layers separated by 2 darker TiSe2 layers in the repeat structure. While a few layering defects can be observed, the film is dominated by the [(SnSe)1+δ]3[TiSe2]2 structure. Figures 2(b) and 2(c) show higher resolution images that clearly resolve the atomic structure. Figure 2(b) shows regions with defect-free continuous layering of the [(SnSe)1+δ]3[TiSe2]2 heterostructure, while Fig. 2(c) shows regions with defects in the layering structure that are likely a result of crystallites started from two nucleation sites growing together. Different zone axis can be observed in the various layers due to the sample’s rotational disorder which is a consequence of the designed precursor preparation technique. In the bottom of Fig. 2(b), the (100) zone axis of TiSe2 can be observed and in the upper left corner of Fig. 2(c), the (100) zone axis of SnSe can be observed.
Representative HAADF-STEM images of a [(SnSe)1+δ]3[TiSe2]2 sample showing the entire thickness of the film (a), a region with a pristine (3, 2) layering structure (b), and a region where layering defects occur (c). A step fault is marked with a solid purple line demonstrating the bottom border of the TiSe2 layer and a dashed yellow line demonstrating the top of the SnSe layer. There is a layer of mixing between the two layers that is outlined by the two borders of the SnSe and TiSe2 layer, respectively.

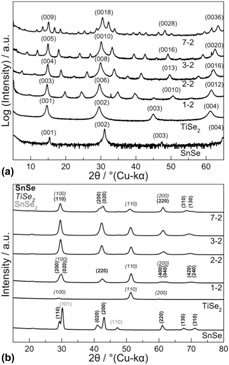
Figure 3 contains specular and in-plane diffraction scans of the four heterostructure samples studied by XPS. All of the reflections in the specular diffraction pattern can be indexed as 00l reflections consistent with an increasing c-axis lattice parameter as m is increased [Reference Hamann, Lygo, Esters, Merrill, Ditto, Sutherland, Bauers and Johnson23]. The c-axis unit cell parameter increases as the number of SnSe bilayers in the repeating unit, m, is increased. This decreases the spacing between Bragg reflections and the first Bragg reflection moves to smaller angles. The in-plane diffraction patterns have reflections that can all be indexed as hk0 reflections from SnSe or TiSe2, except for the binary SnSe sample, which has weak reflections from SnSe2. With increasing value of m in the repeating unit, the reflections from the SnSe constituent grow in intensity and as a result the reflections from TiSe2, become less pronounced. Both diffraction experiments indicate that the samples are crystallographically aligned with the substrate perpendicular to the c-axis.
Specular (a) and in-plane (b) XRD patterns of the SnSe, TiSe2, and [(SnSe)1+δ]m[TiSe2]2 heterostructures with m = 1, 2, 3, and 7.

Characterization of electronic structure via XPS
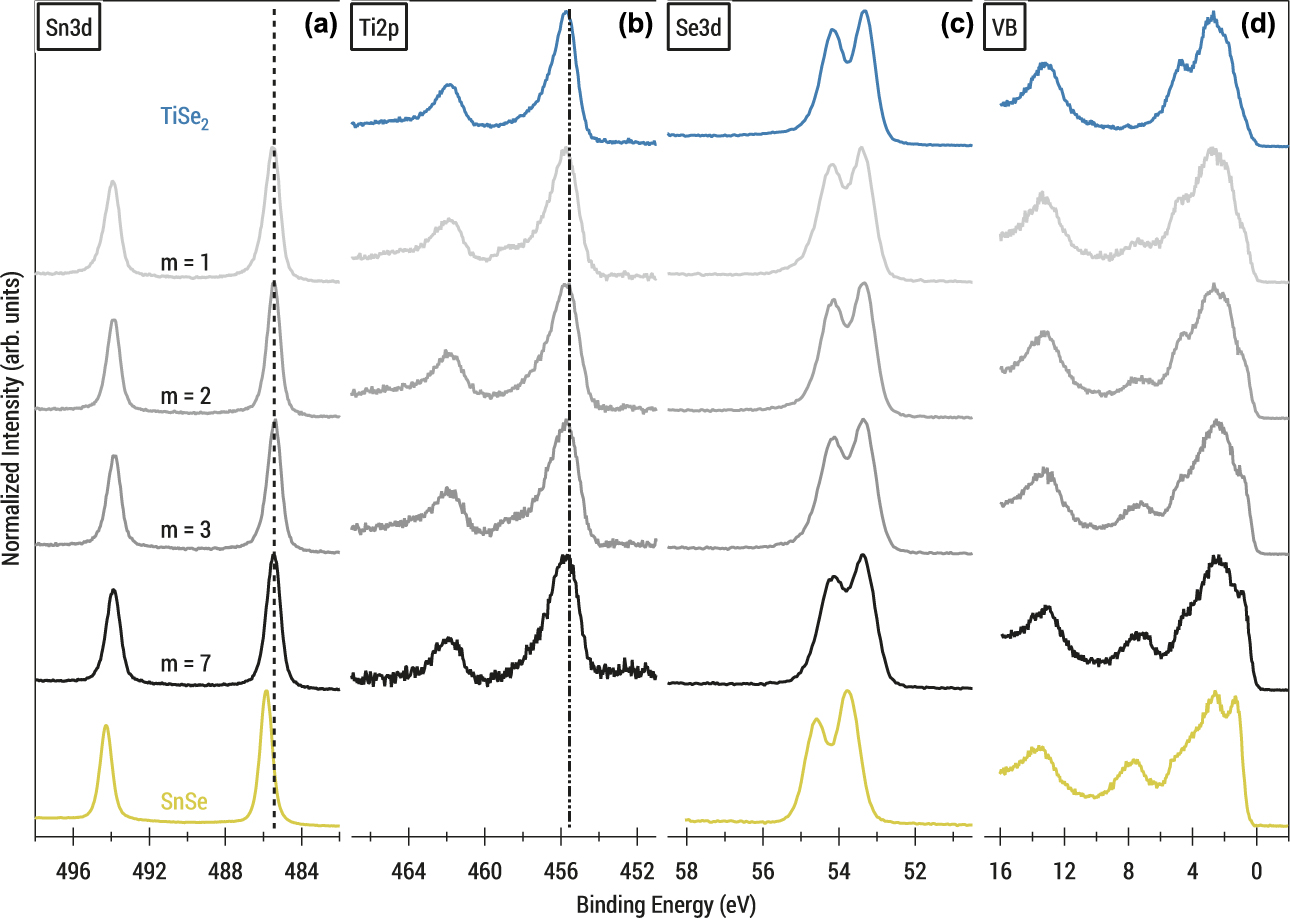
Prior to investigating the heterostructures containing both SnSe and TiSe2 layers, XPS measurements were conducted on respective binary samples. The spectra of the binary compounds SnSe and TiSe2 can be found in the bottom and top rows of Figs. 4(a)–4(d), respectively. As discussed in a previous report [Reference Göhler, Mitchson, Alemayehu, Speck, Wanke, Johnson and Seyller26], binary SnSe is a small band gap semiconductor and, thus, gives symmetric photoelectron peaks. The binding energy of the Sn3d 5/2 and Se3d 5/2 core-level peaks is 485.87 eV and 53.77 eV, respectively. In the valence band, one can identify the Se4s state at 13.6 eV and the Sn5s state at 7.6 eV. The energy range from range 0–5 eV is composed mainly of Sn-p and Se-p states [Reference Makinistian and Albanesi31].
Normalized XPS Sn3d (a), Ti2p (b), and Se3d (c) core-level spectra as well as valence band (d) spectra of binary SnSe (bottom row), binary TiSe2 (top row), and [(SnSe)1+δ]m[TiSe2]2 heterostructures with m = 1, 2, 3, and 7. Dashed lines are added as a guide to the eye, indicating the position of the Sn3d and Ti2p core levels in the heterostructure.
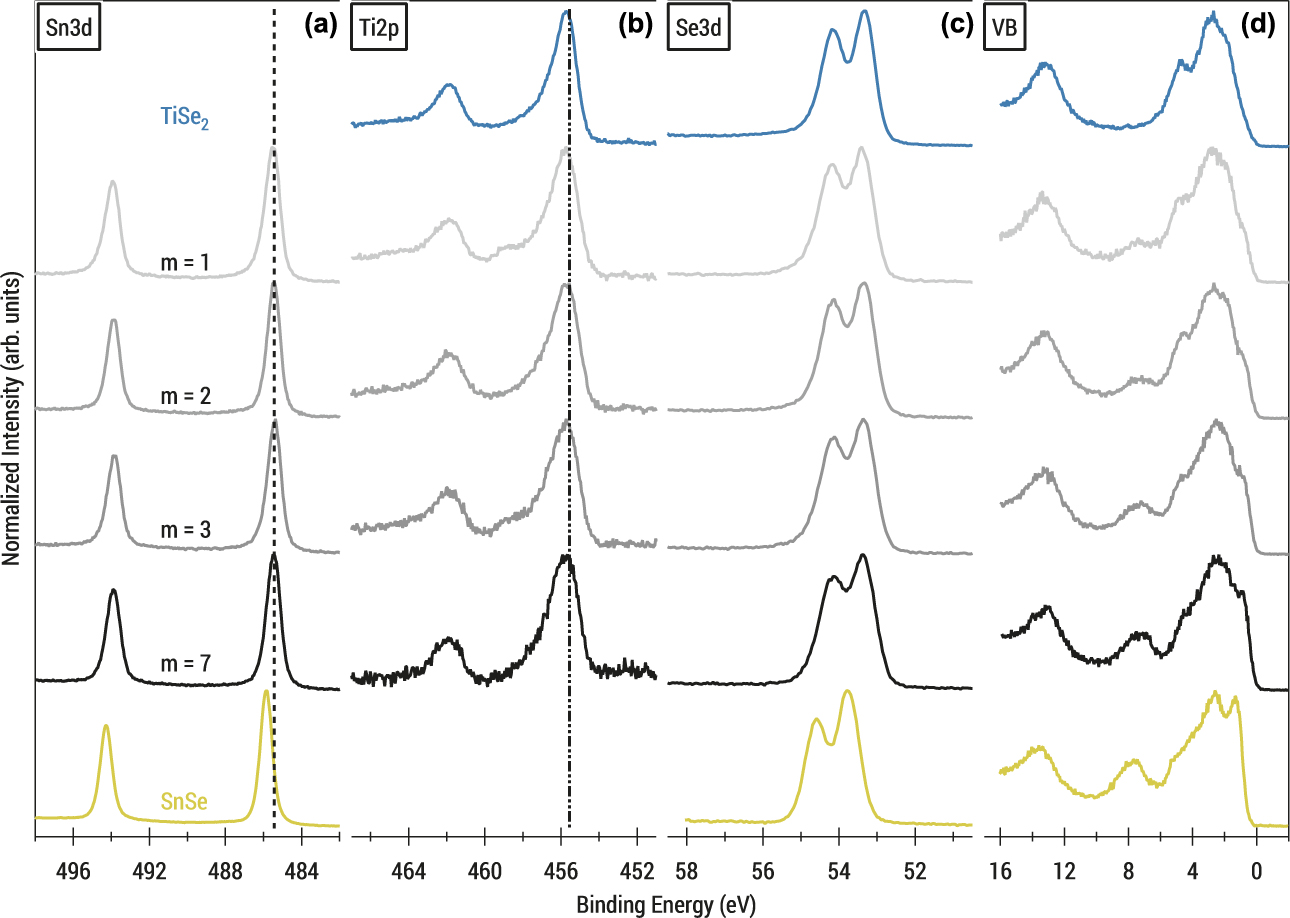
TiSe2 on the other hand is heavily debated as being either a semi-metal or very small band gap semiconductor [Reference Rasch, Stemmler, Müller, Dudy and Manzke32]. For a metallic compound, one would expect to observe asymmetric peak shapes in photoemission spectra [Reference Doniach and Sunjic33]. Indeed, an asymmetric peak shape, which can be fitted using a line shape as derived by Mahan [Reference Mahan34], is observed for the Ti2p and Se3d core levels. A binding energy of the Ti2p 3/2 core level at 455.55 eV can be derived, in excellent agreement with literature reports [Reference Shkvarin, Yarmoshenko, Skorikov, Yablonskikh, Merentsov, Shkvarina and Titov35], and the Se3d 5/2 core level is found at 53.20 eV. In the valence band spectrum, we can observe a broad band constituted of Se-p and Ti-d states, with some prominent features which we find at the same energies as reported by Shkvarin et al. [Reference Shkvarin, Yarmoshenko, Skorikov, Yablonskikh, Merentsov, Shkvarina and Titov35]. In our spectrum, the Se4s state is located at a binding energy of 13.3 eV, which is about 0.3 eV less than in their work [Reference Shkvarin, Yarmoshenko, Skorikov, Yablonskikh, Merentsov, Shkvarina and Titov35]. Right at the Fermi energy (E B = 0), we can observe a small but not vanishing density of states, consistent with a semi-metal.
We now turn our attention to the [(SnSe)1+δ]m[TiSe2]2 heterostructures. After cleaving the samples and transferring them to UHV, XPS survey scans were carried out over a large energy range to assess the quality of the cleaved surface. As expected, the samples were largely free of oxygen compared to uncleaved samples. Only a few samples appeared to have small traces of oxygen left on the surface, which also showed up as a small TiOx shoulder accompanying the Ti2p core level at around 459 eV. From the intensity of the core-level signals, the ratios of the elements present in the samples could be estimated. As expected, an increase in the Sn/Ti ratio with increasing SnSe layer thickness m can be observed. Additionally, measurements were not only carried out in normal emission geometry but also at a 60° angle between surface normal and analyzer. In the 60°-geometry, surface sensitivity is enhanced because electrons from a certain depth have to travel a longer path through the sample to reach the surface. By comparing the intensity ratios in normal emission and under 60°, we find a decrease in Sn content and an increase in Ti in the more surface sensitive geometry, suggesting that a TiSe2 layer appears to be on the top after the cleave. As mentioned earlier, both halves of the cleaved sample could be investigated. Though some samples showed barely any signal from the grown thin films, suggesting a cleave at the substrate, in the instances where there was still enough film left to be investigated, this behavior of the Sn/Ti ratio could be reproduced. Cleaving the samples again for a second time gave the same qualitative results. This is consistent with a cleave of the crystals occurring primarily at the van der Waals gap between the two TiSe2 layers. For one sample, the cleaved surface was exposed to air for a couple of days after the experiment and then measured again. The spectra showed a much higher degree of oxidation for Ti compared to Sn, which further supports the claim that the samples are cleaved between the TiSe2 layers, leaving them more exposed to ambient oxygen.
The main focus of this work was to investigate the electronic interactions between the layers as a function of SnSe layer thickness m. Figure 4(a) shows the normalized Sn3d core-level spectra for binary SnSe and the [(SnSe)1+δ]m[TiSe2]2 heterostructures. The binding energy of the Sn3d 5/2 peak is shifted by an average of 0.44 eV to lower binding energies in the heterostructures compared to binary SnSe. The binding energy is the same within error for all samples and m values. In the previously investigated [(SnSe)1+δ]1[NbSe2]2 system, a pronounced asymmetry and even larger shift of the Sn3d core level was observed [Reference Göhler, Mitchson, Alemayehu, Speck, Wanke, Johnson and Seyller26]. This was explained by the SnSe layers obtaining a metallic character due to electron transfer into the NbSe2 layers. In the [(SnSe)1+δ]m[TiSe2]2 samples presented herein, this asymmetry is very small for m = 1 and completely absent for m ≥ 2. The Ti2p core-level spectra are shown in Fig. 4(b). For all samples, the core-level binding energy and peak shape are the same as in the binary compound. Both the Sn3d and Ti2p core levels show an increased Gaussian peak width in the heterostructures in comparison to the binary compounds, which we attribute to a higher degree of structural distortions and disorder which are present in these samples. While no dependence of the Gaussian width on the number of SnSe layers was observed for the Sn3d core level, the Gaussian width of the Ti2p core increases slightly with increasing m.
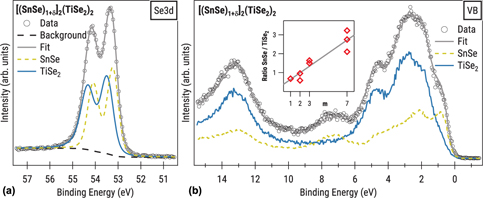
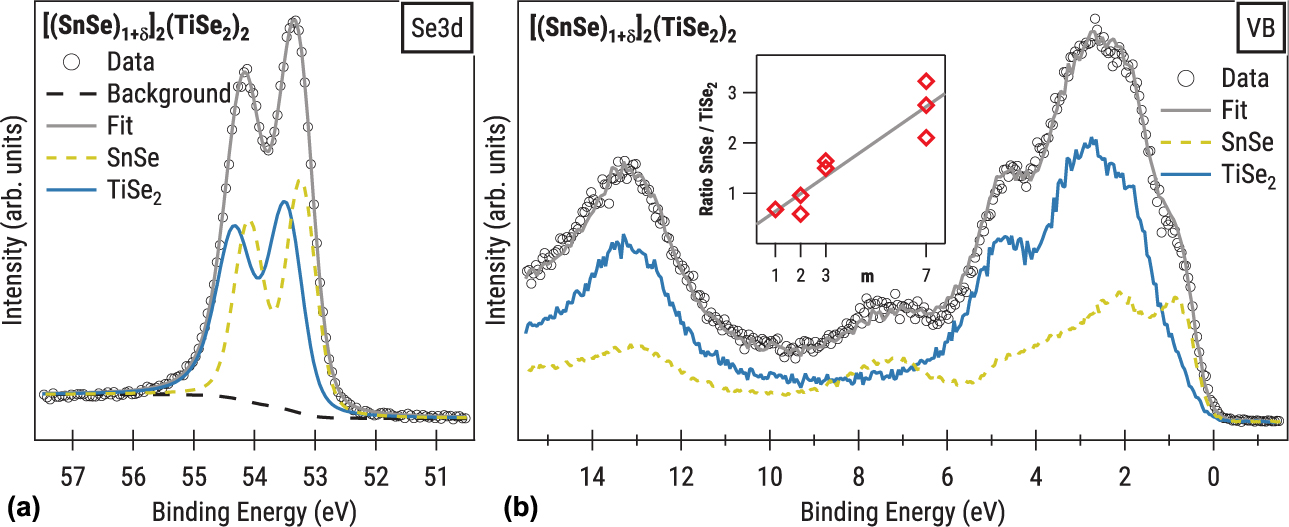
Analyzing the contributions of the two types of layers is more challenging for the Se3d core-level and valence band spectra, as both constituents contribute to the measured signal. For the Se3d, the data were fitted using a weighted superposition of a SnSe and a TiSe2 component. The relative intensity of these two components was estimated from the elemental Sn/Ti ratio as determined from survey scans for each sample and was held constant during the fit routine. The peak shape of each component was constrained to the results obtained on the binary compounds. Only a shift in binding energy and a Gaussian broadening of the individual spectra was allowed. An example is shown for the compound with m = 2 in Fig. 5(a). A Shirley background is used to account for the increase in background intensity of inelastically scattered electrons at lower kinetic energies (higher binding energies) [Reference Shirley36]. The measured spectra are very well reproduced by shifting the SnSe component by about 0.5 eV to lower binding energies from its position in the binary to 53.28 eV, while shifting the TiSe2 component about 0.3 eV to higher binding energies. This procedure was carried out for all measured samples. Within accuracy of the method (approximately ±0.10 eV), all samples exhibit the same shifts of the SnSe and TiSe2 components as the sample shown in Fig. 5(a).
Fit of the Se3d (a) and valence band (b) spectra using superpositions of the SnSe and TiSe2 components, shown exemplarily for [(SnSe)1+δ]2[TiSe2]2. For the Se3d fit, the ratio of the two components was constrained using composition data. The inset in (b) shows the ratio of SnSe/TiSe2 needed to adequately fit the data, showing a linear increase with m.
Taking a closer look at the valence band spectra in Fig. 4(d), it can be seen how the characteristic features of the SnSe valence band are getting more pronounced with increasing m. This is especially true for the Sn5s state and the distinct peak below the Fermi energy, which are found at 7.6 eV and 1.3 eV in binary SnSe, respectively. They do, however, appear shifted about 0.4–0.5 eV toward lower binding energies in the heterostructures. In the same manner, the pronounced peak which can be found at 4.85 eV in binary TiSe2 decreases in intensity with increased SnSe layer thickness.
A similar approach as for the Se3d core level was used to model the valence band spectra of the heterostructures, as is shown again for m = 2 in Fig. 5(b). Unlike the Se3d core level, the different states of the SnSe and TiSe2 valence band are expected to show different photoionization cross-sections. As a consequence, the information on elemental ratios from the survey scans could not be used to constrain the fit. To fit the measured spectrum of the [(SnSe)1+δ]m[TiSe2]2 heterostructure (data points), a weighted superposition of the measured valence band spectra of the binary samples was carried out. The spectra of the two components were free to shift during the fit routine. The quality of the fits was assessed by how well distinct features of the dataset could be reproduced, especially the Sn5s state and the characteristic states between 5 eV and the Fermi energy. As can be seen from the example shown in Fig. 5(b), with this method, it is possible to reproduce the experimental data fairly well. Consistent with the observations in the Se3d core level, in the valence band, a shift of the SnSe component by 0.4–0.5 eV to lower binding energies was found, while the TiSe2 component appears shifted 0.10–0.22 eV toward higher binding energies. However, it should be noted that this simple approach has its limitations, as it is not possible to account for possible changes in band filling or band dispersion compared to the binary compounds. The inset in Fig. 5(b) shows how the ratio of SnSe to TiSe2, needed to adequately reproduce the spectrum of the heterostructure, changes with increasing m, where each data point corresponds to a fitted measurement. Even though the data points show some variation, a clear linear trend can be observed, as should be expected for a linearly increasing SnSe layer thickness.
Discussion of XPS results
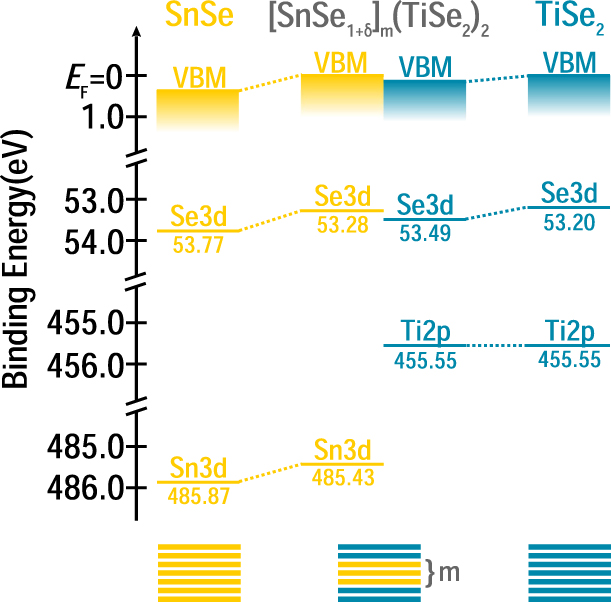
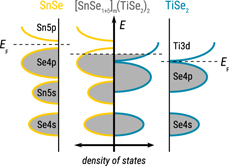
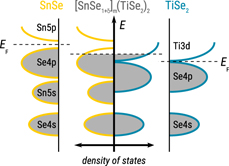
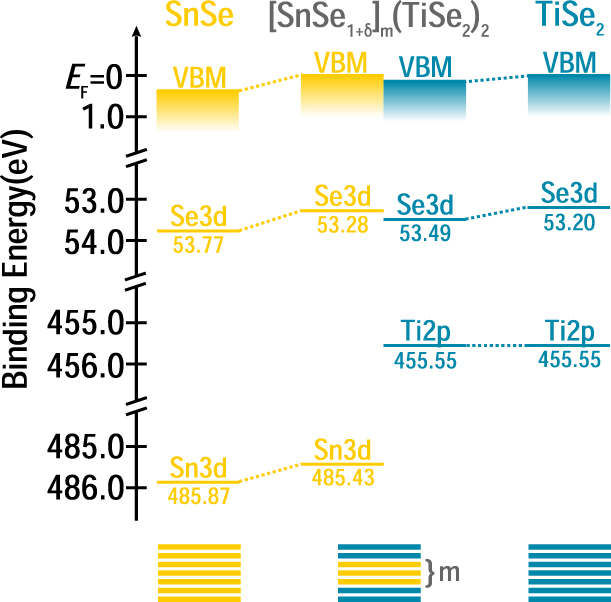
Figure 6 summarizes the experimental binding energies as well as the position of the valence band maximum for binary SnSe and TiSe2. Since no dependence of the binding energy on the SnSe layer thickness m was observed for the [(SnSe)1+δ]m[TiSe2]2 heterostructures within the accuracy of our method, average values are given for Sn3d, Ti2p, and the respective Se3d core levels. The SnSe component of the heterostructure shows a rigid band shift of the core levels and the valence band. The energy shifts are about 0.4–0.5 eV toward lower binding energies for all core levels. This energy shift can be explained by a transfer of charge from the SnSe into the TiSe2, similar to that proposed by Merrill et al. [Reference Merrill, Moore, Ditto, Sutherland, Falmbigl, Winkler, Pernau and Johnson20]: As a binary compound, SnSe is a semiconductor, so the Fermi energy is in the band gap and the topmost energy states (mainly the Se4p [Reference Makinistian and Albanesi31]) are completely filled. When SnSe is interleaved with TiSe2, it donates electrons into the TiSe2 layers, which leads to a shift of E F to the top of the Se4p band, as can be seen in the schematic band structure shown in Fig. 7. Since binding energies in XPS are measured relative to E F, this electron donation leads to a reduction in the binding energies in SnSe. It is, however, somewhat puzzling that this observed shift is independent of the thickness m of the SnSe layer stack in the heterostructure. With increased thickness, one would expect that the donation efficiency of the innermost SnSe layers is smaller than for the layers at the interface with TiSe2, leading to differently charged layers and, thus, different binding energies for the nonequivalent layers. This is, however, not observed experimentally, but it could be that any difference between the layers is too small to be resolvable in XPS. A similar observation can be made for the case of multilayer graphene grown epitaxially on silicon carbide, where each graphene layer is at a different doping level due to doping from the substrate, but the individual layers cannot be distinguished in the core-level spectra [Reference Ohta, Bostwick, McChesney, Seyller, Horn and Rotenberg37, Reference Bostwick, Ohta, McChesney, Emtsev, Seyller, Horn and Rotenberg38, Reference Emtsev, Speck, Seyller, Ley and Riley39]. Given that the information depth in XPS is limited and most of the signal stems from the first 2–3 layers of the surface, the contributions of the innermost SnSe layers are expected to be small for the sample with larger m.
Energy diagram of the experimental binding energies of core levels and valence band maximum (VBM) in SnSe (left), [(SnSe)1+δ]m[TiSe2]2 (middle), and TiSe2 (right). The Sn3d, Se3d, and VBM show an energy shift in the heterostructure compared to the binary compound.
Simplified schematic band diagram around the Fermi energy E F in SnSe, [(SnSe)1+δ]m[TiSe2]2, and TiSe2. The position of E F in the constituents and the heterostructure is indicated by dashed lines. Adapted and reproduced with permission from Ref. Reference Merrill, Moore, Ditto, Sutherland, Falmbigl, Winkler, Pernau and Johnson20. Copyright Wiley-VCH Verlag GmbH & Co. KGaA.

Using the experimental shift ΔE of the valence band in SnSe, it is possible to estimate the amount of charge transferred into TiSe2 for small m values. Considering that there are m layers of SnSe and two layers of TiSe2 in [(SnSe)1+δ]m[TiSe2]2, there are  ${1 \over 2} \cdot m \cdot \left( {1 + \delta } \right)$ SnSe unit cells for each TiSe2 unit cell. The number of electrons transferred on each Ti atom n can then be calculated as follows:
 $$n = {1 \over 4} \cdot m \cdot \left( {1 + \delta } \right) \cdot \int_0^{\Delta E} {{\rm{DOS}}\left( E \right){\rm{d}}E} \quad .$$
The density of states (DOS) in Eq. (1) was taken from calculations for bulk SnSe by Makistinian et al. [Reference Makinistian and Albanesi31]. Please note that an additional factor of 1/2 had to be added in Eq. (1) because the SnSe unit cell of the [(SnSe)1+δ]m[TiSe2]2 samples only contains one bilayer of SnSe, in contrast to the two bilayers per unit cell for the bulk SnSe used in the calculations. With this approach, the number of accepted electrons per Ti atom can be estimated to be about 0.12 for m = 1 and 0.24 for m = 2. These values compare very well to the charge carrier density of 0.3 electrons per Ti atom, which Merrill et al. [Reference Merrill, Moore, Ditto, Sutherland, Falmbigl, Winkler, Pernau and Johnson20] determined from transport data for the similar (SnSe)1.2TiSe2 compound with m = n = 1, if we assume that transport is only carried by the donated electrons from the SnSe. In the case of m = 1 for the [(SnSe)1+δ]m[TiSe2]2 samples discussed here, the donated charge has to be distributed over twice the number of TiSe2 layers compared to the compound investigated by Merrill et al., while for m = 2, the ratio of SnSe to TiSe2 layers is the same as in their samples.
Interpretation of the results obtained on the charge accepting TiSe2 layers goes beyond a simple rigid band shift. For the valence band, a small shift of 0.10–0.22 eV toward higher binding energies is observed. The Se3d core level is also shifted toward higher binding energies, but the shift is slightly larger at around 0.3 eV. In the binary compound, band structure calculations by Shkvarin et al. [Reference Shkvarin, Yarmoshenko, Skorikov, Yablonskikh, Merentsov, Shkvarina and Titov35] suggest that the density of states at E F is small, but there are empty Ti3d states with a high density of states right above the Fermi energy. It is, therefore, reasonable to assume that the Fermi energy is shifted significantly into the Ti3d band when accepting the electrons from SnSe, as shown in Fig. 7. This leads to an increase in binding energy, as is observed for the valence band and the Se3d core level. A similar observation of the filling of the Ti3d band in such a heterostructure due to electron transfer was made by Brandt et al. in an angle-resolved photoemission spectroscopy (ARPES) study on the ordered misfit layer compound (PbS)1.18(TiS2)n with n = 1 and 2 [Reference Brandt, Kipp, Skibowski, Krasovskii, Schattke, Spiecker, Dieker and Jäger40], where the constituents PbS and TiS2 have similar electronic structures as SnSe and TiSe2, respectively [Reference Shkvarin, Yarmoshenko, Skorikov, Yablonskikh, Merentsov, Shkvarina and Titov35, Reference Shalvoy, Fisher and Stiles41]. The same mechanism of charge transfer is also discussed for the misfit layer compound (PbSe)1.16(TiSe2)2 [Reference Giang, Xu, Hor, Williams, Dutton, Zandbergen and Cava42] and its rotationally disordered polymorph [Reference Moore, Beekman, Disch, Zschack, Häusler, Neumann and Johnson43].
The 2p core level of titanium appears at the same binding energy in the heterostructures and the binary compound and shows only a slight increase in Gaussian peak width with increasing m. This seems to contradict the observations on the Se3d core level and valence band. Similar effects have been observed for example in intercalated graphene, where the rigid core-level shift is counteracted at higher doping levels and, therefore, different than the shift of the Fermi energy [Reference Schröder, Petrović, Gerber, Martínez-Galera, Grånäs, Arman, Herbig, Schnadt, Kralj, Knudsen and Michely44].
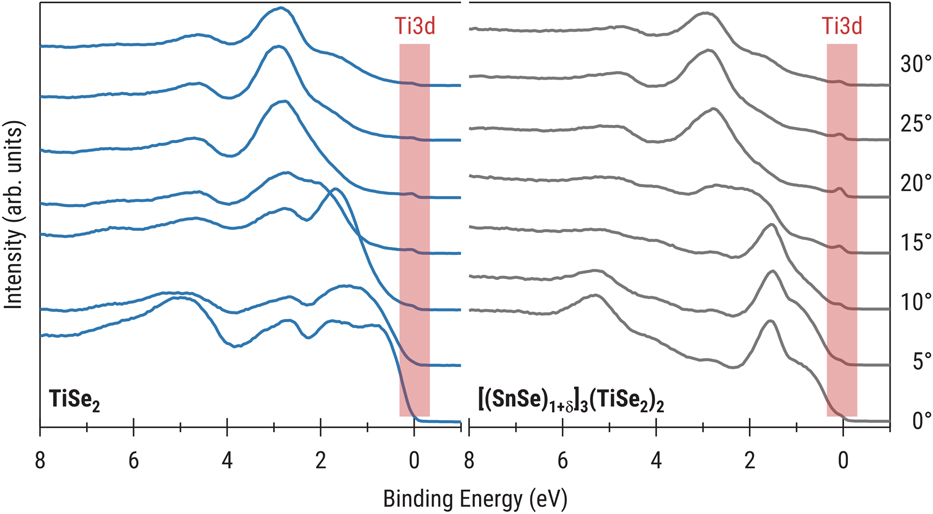
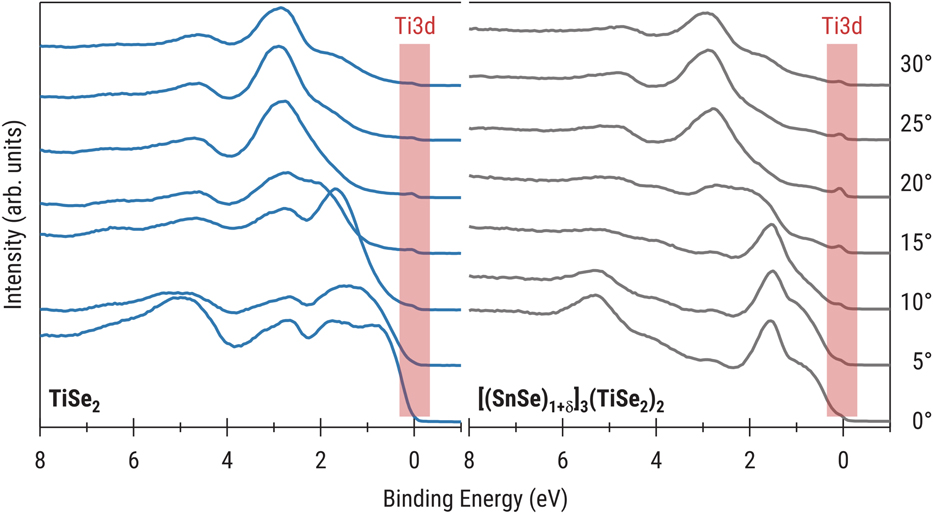
To further substantiate the interpretation of the XPS results, the valence bands of TiSe2 and a representative [(SnSe)1+δ]m[TiSe2]2 sample with m = 3 were measured with UPS using He-II excitation to achieve a better resolution and intensity of the spectra. The results of these measurements are shown for polar angles between 0° and 30° in Fig. 8. By increasing the polar angle between the sample’s surface normal and the analyzer, electrons with a parallel component of the wave vector further away from the Γ-point of the Brillouin zone can be detected. Similar as in the work by Brandt et al. [Reference Brandt, Kipp, Skibowski, Krasovskii, Schattke, Spiecker, Dieker and Jäger40], in binary TiSe2, the Ti3d band at the Fermi energy can be seen as a weak signal at larger polar angles, which shows that this state is partially filled at room temperature. Upon adding electron-donating SnSe layers in [(SnSe)1+δ]3[TiSe2]2, the overall appearance of the spectrum changes due to contributions from SnSe. Even though the effect is smaller than that observed by Brand et al., the intensity of the Ti3d band is increased by a factor of approximately 2–3, which can be explained by a higher electron population in this state in the heterostructure in comparison to the binary sample. This is consistent with the donation of electrons by SnSe and, thus, confirms the conclusions drawn from XPS. The XPS and UPS valence band spectra show a nonzero density of states at the Fermi energy for the investigated [(SnSe)1+δ]m[TiSe2]2 heterostructures. We, therefore, expect the samples to show metallic behavior at room temperature, consistent with a prior report on the electrical properties of [(SnSe)1+δ]mTiSe2 compounds [Reference Hamann, Lygo, Esters, Merrill, Ditto, Sutherland, Bauers and Johnson23]. The [(SnSe)1+δ]2[TiSe2]2 sample investigated here has the same stoichiometry as the (SnSe)1+δTiSe2 compound, but with a different interface density. We expect that these two compounds will have similar electrical properties.
Valence bands of TiSe2 and [(SnSe)1+δ]3[TiSe2]2 measured with UPS at different polar angles between sample surface and analyzer. Especially for larger angles, the Ti3d state at E F can be observed. In the heterostructure, the intensity of this Ti3d peak is increased, confirming a higher electron population in this state.
While all the data are consistent with a charge transfer of electrons from SnSe into TiSe2 occurring in [(SnSe)1+δ]m[TiSe2]2, it is still unclear why no significant differences between samples with different m can be observed. Using our simple rigid band model for SnSe and concluding that each layer donates roughly the same amount of electrons, a change of the core-level binding energies or valence band of the TiSe2 layers with increasing m would be expected, since the number of charge accepting layers stays the same. This is, however, not observed as even though the total amount of charge distributed along the TiSe2 layers appears to increase 7-fold from m = 1 to 7, no significant difference in the experimental electronic structure can be observed within the resolution of the XPS instrument. Further research on other stacking arrangements in this family of heterostructures is necessary to fully comprehend the interplay between layers.
Conclusions and outlook
A series of [(SnSe)1+δ]m[TiSe2]2 heterostructures with increasing thickness of the SnSe stack m = 1, 2, 3, and 7 was grown by self-assembly from designed amorphous precursors. The optimum crystallization temperature was determined via an annealing study to be 350 °C. Structural investigations using XRR, XRD, and HAADF-STEM showed that the films grow in crystalline layers parallel to the substrate but show rotational disorder between layers, as is common for products from this synthesis. Their electronic structure was investigated by applying XPS to samples cleaved at the van der Waals gap between the TiSe2 layers and comparing them to the results obtained on binary TiSe2 and SnSe samples grown in the same manner. Contrary to expectations, no significant differences in the electronic structures could be observed between samples with different m. The measured spectra of the heterostructures can be modeled by a weighted superposition of the spectra of the constituent layers. The SnSe component shows a rigid band shift toward lower binding energies, consistent with a transfer of electrons into the TiSe2 layers. By accepting charges from SnSe, the Ti3d band of TiSe2 is filled, which is also confirmed by UPS, leading to a shift of the observed valence band and Se3d core-level positions toward higher binding energies. To further understand the nature of the interactions in this system, a follow up study on a series of [(SnSe)1+δ]1(TiSe2)n heterostructures with increasing thickness n of the TiSe2 layer stack is planned for the immediate future.
Experimental details
Synthesis
Layered amorphous precursors for the preparation of [(SnSe)1+δ]m[TiSe2]2 heterostructures (m = 1, 2, 3, and 7) and binary TiSe2 and SnSe films were deposited in a high-vacuum chamber by physical vapor deposition. All materials were evaporated from elemental sources onto silicon wafer substrates with a native SiO2 layer. Sn and Ti were deposited using electron beam guns, and Se was deposited using a Knudsen effusion cell. Pneumatic shutters and a house written LabView code were used to control the deposition [Reference Esters45]. Quartz crystal microbalances were used to monitor the rate of deposition and the relative amount of material deposited. The amount of material required to crystallize a single bilayer of TiSe2 or SnSe was calibrated using an iterative process, including XRD, XRR, and XRF measurements [Reference Hamann, Bardgett, Cordova, Maynard, Hadland, Lygo, Wood, Esters and Johnson28]. The amorphous precursors were annealed ex situ in a nitrogen atmosphere glove box to facilitate the crystallization of the targeted binary compound or heterostructure. An annealing study was conducted for the heterostructures to determine the correct conditions for crystallization, which included annealing a sample at multiple temperature steps for 30 min.
Diffraction
XRR, specular XRD, and in-plane XRD were collected to characterize the structure of the samples analyzed in this study as well as to investigate the evolution of their crystallization. All XRD data were collected in house using Cu kα as the source of radiation. XRR and specular XRD were collected on a Bruker D8 Discover diffractometer outfitted with a Göbel mirror. In-plane diffraction was collected on a Rigaku SmartLab using the in-plane general medium resolution and parallel beam optics alignment. A nickel filter was used on both instruments to eliminate any signal from Cu Kβ. XRF, used to determine the amount of material needed in each layer, was collected on a Rigaku ZSX Primus II wavelength dispersive XRF spectrometer with a rhodium X-ray source and analyzed using the method described previously by Hamann et al. [Reference Hamann, Bardgett, Cordova, Maynard, Hadland, Lygo, Wood, Esters and Johnson28].
HAADF-STEM
HAADF-STEM images were collected for [(SnSe)1+δ]m[TiSe2]2 to provide a real space depiction of the crystallized structure. Ultrathin cross-sections were prepared using an FEI Helios NanoLab 600i FIB-SEM (FEI Company, Hillsboro, OR). As the lamellae approached electron transparency, low-energy 2 kV milling was used to avoid damaging the crystallinity of the sample. The prepared samples were imaged in HAADF-STEM mode at 300 kV using Lawrence Berkeley National Lab’s (LBNL) TEAM 0.5 microscope (Berkeley, CA). The camera length was 105 mm.
Photoelectron spectroscopy
XPS measurements were carried out in ultrahigh vacuum (UHV) at a pressure below 3 × 10⁻¹⁰ mbar using Al Kα radiation from a SPECS XR50M X-ray source equipped with a SPECS FOCUS 500 crystal monochromator for excitation and a SPECS Phoibos 150 MCD-9 hemispherical analyzer (SPECS Surface Nano Analysis GmbH, Berlin, Germany) for detection of the photoelectrons. Prior to experiments, the crystals were cleaved to remove surface oxides and contaminants. This was achieved by mounting the samples between two steel plates using epoxy adhesives and breaking off the top plate in the load lock chamber of the UHV system under flow of dry N2, as demonstrated previously [Reference Göhler, Mitchson, Alemayehu, Speck, Wanke, Johnson and Seyller26]. Insulating EPO-TEK H72 epoxy was used on the sample plane and silver-filled, conductive EPO-TEK H22 (Epoxy Technology, Inc., Billerica, MA) was used at the edges of the sample. This was done to get a good electrical contact, while at the same time preventing contributions from the silver particles of the H22 to the spectra. After cleaving, each half of the cleaved crystal could be investigated. Attaching another steel plate to the cleaved plane after the experiment allowed for a second cleave of the same sample. Estimating an inelastic mean free path λ of 22 Å for electrons with a kinetic energy of about 1000 eV (corresponding to Sn3d and Ti2p states), and an information depth of about 3λ, most of the measured signal stems from the first 10–12 layers at the surface, covering 2–3 unit cells for the compounds with m ≤ 3. Selected samples were cleaved in the same way and used for UPS, using monochromatic He-II radiation from a SPECS UVS 300 UV source and SPECS TMM 304 monochromator in combination with a SPECS Phoibos 150 hemispherical analyzer (SPECS Surface Nano Analysis GmbH, Berlin, Germany) equipped with a 2D-CCD detector and operated in wide-angle mode.
Acknowledgments
This material is based upon the work supported by the National Science Foundation Graduate Research Fellowship Program under Grant No. 1309047. The authors acknowledge the support from the National Science Foundation under grant DMR-1710214. Work at the Molecular Foundry was supported by the Office of Science, Office of Basic Energy Sciences, of the U.S. Department of Energy under Contract No. DE-AC02-05CH11231.