


1. Introduction
The characteristics of fold-and-thrust belt curvature have been studied for many years via analogue modelling (e.g. Marshak & Wilkerson, Reference Marshak and Wilkerson1992; Calassou et al. Reference Calassou, Larroque and Malavieille1993; Zweigel, Reference Zweigel1998; Macedo & Marshak, Reference Macedo and Marshak1999; Cotton & Koyi, Reference Cotton and Koyi2000; Lickorish et al. Reference Lickorish, Ford, Bürgisser and Cobbold2002; Marshak Reference Marshak and McClay2004; Reiter et al. Reference Reiter, Kukowski and Ratschbacher2011). Many different parameters have been tested, such as different curvatures of the indenter, variations in thickness within the deforming layers, variations in basal friction and irregularities in the footwall/foreland. This paper focuses on indenter-related parameters, similar to the work performed by Macedo & Marshak (Reference Macedo and Marshak1999). These parameters relate to different indenter shapes and to the various ways in which the indenter is moved. The experimental material used in the models was wet sandy silt. Special attention was paid to the influence of indenter rotation on the formation of fault patterns in front of the moving rigid indenter. Many geodynamic reconstructions have postulated a rotation of the advancing crustal block: for example, an anticlockwise rotation of the Adria block (Western Alps) during the Miocene (Vialon et al. Reference Vialon, Rochette, Menard, Coward, Dietrich and Park1989); a clockwise rotation of the Tarim block (Western Himalaya) during the Devonian (e.g. Chen et al. Reference Chen, Lu, Ji, Cai and Wu1999) and an anticlockwise rotation of the Iberian plate during the Late Cretaceous (O'Brien, Reference O'Brien2001).
The aim of the present investigation is to determine a plausible geodynamic analogue scenario for the Oligocene–Miocene tectonic evolution of the northern Outer Carpathian fold-and-thrust belt. The Outer Carpathians are an external part of the Carpathian–Pannonian–Dinaride system (Fig. 1; e.g. Csontos & Vörös, Reference Csontos and Vörös2004; Schmid et al. Reference Schmid, Bernoulli, Fügenschuh, Matenco, Schefer, Schuster, Tischler and Ustaszewski2008). Current opinion suggests that the northern Outer Carpathian belt, i.e. the Western and northern Eastern Carpathians, formed in front of the advancing East Alpine–Carpathian–Pannonian (ALCAPA) block (which is a continental fragment) as an accretionary prism from Oligocene time (e.g. Pescatore & Ślączka Reference Pescatore and Ślączka1984; Morley Reference Morley1996; Behrmann et al. Reference Behrmann, Stasiany, Milicka and Pereszlenyi2000) up to the Middle Miocene (the Serravallian, locally termed the Sarmatian; e.g. Oszczypko, Reference Oszczypko2006; Nemčok et al. Reference Nemčok, Dilov, Wojtaszek, Ludhová, Klecker, Sercombe, Coward, Ries, Butler and Graham2007). Based on the results of these investigations, the ALCAPA block may be a key element in formation of the Outer Carpathian fold-and-thrust belt. This belt developed in front of the ALCAPA block which could behave as a huge bulldozer (for explanation see Chapple, Reference Chapple1978). Moreover, the southern boundary of the northern Outer Carpathians is quasi-triangular in outline and concave northerly. The northern outline of the northern Outer Carpathians is convex to the north and slightly mimics the arcuate shape of the southern boundary. What may confirm the movement of the triangular indenter, which is an equivalent of the ALCAPA block, is the construction of an analogue model of the northern Outer Carpathian fold-and-thrust belt. The influence of indenter-controlled parameters on the generation of curved fold-and-thrust belts is indisputable (Macedo & Marshak, Reference Macedo and Marshak1999). Therefore, this effect is first explored in modelling the tectonic development of the northern Outer Carpathians.
Map of the Carpathian–Pannonian–Dinaride system (Csontos et al. Reference Csontos, Nagymarosy, Horváth and Kováč1992) with location of the Vienna basin (Kováč et al. Reference Kováč, Nagymarosy, Oszczypko, Ślączka, Csontos, Marunteanu, Matenco, Márton and Rakuš1998). The rectangle marks the most northern part of the northern Outer Carpathians, the location of the Polish part of Carpathians shown in Figure 2a. Geology of the Polish Carpathians modified after Książkiewicz (Reference Książkiewicz1977) and Jankowski (Reference Jankowski1997). PKB: Pieniny Klippen Belt.

To date, there have been four publications that have analogue modelled the geodynamic evolution of the Outer Carpathians. In modelling the Eastern Carpathians, Zweigel (Reference Zweigel1998) modelled the influence of the shape of the upper plate and the movement direction of the upper plate relative to the orientation of its margins. In their investigation of the Western Outer Carpathians, Nemčok et al. (Reference Nemčok, Coward, Secombe and Klecker1999) used the results of the model examining the influence of basal friction on thrust generation. Rauch (Reference Rauch and Dziadzio2001) extended the results of Zweigel (Reference Zweigel1998) by testing indenter-controlled parameters on the modelled evolution of the Western Outer Carpathians. Sieniawska et al. (Reference Sieniawska, Aleksandrowski, Rauch and Koyi2010) modelled a fragment of the Polish Carpathian orogenic front and tested the influence of synorogenic sedimentation in front of an active fold-and-thrust wedge that rested on top of a weak ductile detachment horizon, thereby examining the dynamics of growth structures.
The results of the experiments presented in this paper are the first modelling of the tectonic evolution of the entire northern Outer Carpathians. The most northern segment of the northern Outer Carpathians is located in Poland. The Polish part of the northern Outer Carpathians occupies a significant geological position: it occurs in front of the apex formed by the Pieniny Klippen Belt which is the border between the Outer and Inner Carpathians. The latter belongs to the ALCAPA block, and provides the possibility of studying the influence of the advancing ALCAPA block on the formation of the Carpathian accretionary prism.
2. Regional background
2.a. Alpine–Carpathian–Pannonian System
The Outer Carpathian arc (Fig. 1) is the external part of the Carpathian orogen and is characterized by outward-verging nappes. Mapping of the Carpathian–Pannonian region suggests that there are two distinct crustal blocks here, named microplates or mega-units. These have been termed the Alpine–Carpathian–Pannonian (ALCAPA) block and Tisza–Dacia block (e.g. Fodor et al. Reference Fodor, Csontos, Bada, Györfi, Benkovics, Durand, Jolivet, Horváth and Séranne1999; Csontos & Vörös, Reference Csontos and Vörös2004; Schmid et al. Reference Schmid, Bernoulli, Fügenschuh, Matenco, Schefer, Schuster, Tischler and Ustaszewski2008). The two parts of the composite Tisza–Dacia block are considered as independent terranes in the Mesozoic (Csontos & Vörös Reference Csontos and Vörös2004). The ALCAPA and Tisza–Dacia blocks moved as two separate crustal fragments during the development of the Outer Carpathian arc (e.g. Csontos, Reference Csontos1995; Fodor et al. Reference Fodor, Csontos, Bada, Györfi, Benkovics, Durand, Jolivet, Horváth and Séranne1999). According to Csontos & Vörös (Reference Csontos and Vörös2004), the ALCAPA block includes the Eastern Alps, West Carpathians and Transdanubian Range north of Lake Balaton.
The overall driving mechanism for the development the Carpathian area was the convergence of Africa with Europe (e.g. Dewey et al. Reference Dewey, Pitman, Ryan and Bonnin1973; Burchfil, Reference Burchfil1980; Royden, Reference Royden1993; Golonka et al. Reference Golonka, Oszczypko and Ślączka2000; Neugebauer et al. Reference Neugebauer, Greiner and Appel2001). The migration of the ALCAPA and Tisza–Dacia blocks towards their present location in the Carpathian realm was accompanied by an eastwards extrusion in the Eastern Alps (Ratschbacher et al. Reference Ratschbacher, Frisch, Linzer and Merle1991a , b), by an eastwards retreat of European crust (Royden & Burchfield, Reference Royden and Burchfield1989; Royden, Reference Royden1993; Nemčok et al. Reference Nemčok, Krzywiec, Wojtaszek, Ludhová, Klecker, Sercombe and Coward2006) and by eastwards migration of the last collisional activity along the Carpathian arc (e.g. Nemčok et al. Reference Nemčok, Krzywiec, Wojtaszek, Ludhová, Klecker, Sercombe and Coward2006). Lateral extrusion in the Eastern Alps, forced by the continental collision which affected the Alps, was possible because the subduction retreat provided the space necessary for this eastwards movement (Ratschbacher et al. Reference Ratschbacher, Frisch, Linzer and Merle1991a ; Sperner et al. Reference Sperner, Ratschbacher and Nemčok2002). A continental escape of the ALCAPA block from the Alpine area started in the Late Eocene (Fodor et al. Reference Fodor, Magyari, Kázmér and Fogarasi1992), but best developed in the Oligocene (Csontos et al. Reference Csontos, Nagymarosy, Horváth and Kováč1992; Fodor et al. Reference Fodor, Magyari, Kázmér and Fogarasi1992). The amount of this escape is estimated as c. 60–100 km in the Alps (Schmid et al. Reference Schmid, Aebli, Heller, Zingg and Coward1989). According to Frisch et al. (Reference Frisch, Kuhlemann, Dunkl and Brügel1998), the lateral extrusion of the Eastern Alpine units lasted from the late Late Oligocene to the late Middle Miocene. Starting in the late Early Miocene, crustal deformation in the Carpathian realm was characterized by the mutually opposite rotation of the ALCAPA and Tisza–Dacia blocks and their progressive advancement into the Carpathian embayment (e.g. Balla Reference Balla1987). The northern part of the Outer Carpathian belt – the Western and northern part of the Eastern Carpathians – formed in front of the advancing ALCAPA block during Late Eocene – Middle Miocene times (Nemčok et al. Reference Nemčok, Dilov, Wojtaszek, Ludhová, Klecker, Sercombe, Coward, Ries, Butler and Graham2007). The thrusting in the East Outer Carpathians continued into the Early Pliocene (Late Miocene; Matenco & Bertotti, Reference Matenco and Bertotti2000).
During the last two decades, numerous kinematic or palinspastic restorations of the Alpine–Carpathian–Dinaride system have been published (e.g. Balla, Reference Balla1987; Csontos et al. Reference Csontos, Nagymarosy, Horváth and Kováč1992; Kováč et al. Reference Kováč, Král, Márton, Plašienka and Uher1994; Nemčok et al. Reference Nemčok and Nemčok1998a ; Fodor et al. Reference Fodor, Csontos, Bada, Györfi, Benkovics, Durand, Jolivet, Horváth and Séranne1999; Márton et al. Reference Márton, Kuhlemann, Frisch and Dunkl2000; Ustaszewski et al. Reference Ustaszewski, Schmid, Fügenschuh, Tischler, Kissling and Spakman2008). Certain reconstructions of the Neogene evolution of the ALCAPA region have suggested that there was a very important 30–90° counter-clockwise rotation of the ALCAPA block (e.g. Balla, Reference Balla1987; Márton & Márton, Reference Márton, Márton, Morris and Tarling1996; Fodor et al. Reference Fodor, Csontos, Bada, Györfi, Benkovics, Durand, Jolivet, Horváth and Séranne1999), while others have considered ALCAPA rotation to be minor (e.g. Ustaszewski et al. Reference Ustaszewski, Schmid, Fügenschuh, Tischler, Kissling and Spakman2008) or absent (e.g. Ellouze & Roca, Reference Ellouze, Roca and Roure1994). The amount of the Neogene counter-clockwise rotation of the ALCAPA block is still an open question. Based on palaeomagnetic observation, it could be 30–35° (Balla, Reference Balla1987), 80° (Márton et al. Reference Márton, Tischler, Csontos, Fügenschuh and Schmid2007) or even 70–90° (Márton & Márton, Reference Márton, Márton, Morris and Tarling1996; Fodor et al. Reference Fodor, Csontos, Bada, Györfi, Benkovics, Durand, Jolivet, Horváth and Séranne1999).
The northern Outer Carpathians (the Western and the most northern part of Eastern Outer Carpathians) are located close to the ALCAPA block (Fig. 1). Past research has supported the idea that the ALCAPA block has played a significant role in the formation of the northern Outer Carpathian belt (e.g. Kováč et al. Reference Kováč, Král, Márton, Plašienka and Uher1994; Fodor et al. Reference Fodor, Csontos, Bada, Györfi, Benkovics, Durand, Jolivet, Horváth and Séranne1999; Nemčok et al. Reference Nemčok and Nemčok1998a , Reference Nemčok, Pospišil, Lexa and Donelick b ).
2.b. Western Outer Carpathians as the main part of the northern Outer Carpathians
The Western Carpathians and the most northern part of Eastern Carpathians (Fig. 1) have traditionally been divided into two ranges by the Pieniny Klippen Belt: an older, inner range and a younger, outer range (Książkiewicz, Reference Książkiewicz1977). The West Inner Carpathians represent a Late Cretaceous imbricated nappe system comprising crystalline basement units and post-nappe Late Cretaceous – Neogene sedimentary and volcanic formations (e.g. Książkiewicz, Reference Książkiewicz1977; Plašienka, Reference Plašienka1991; Plašienka et al. Reference Plašienka, Grecula, Putiš, Kováč, Hovorka, Grecula, Hovorka and Putiš1997; Lexa et al. Reference Lexa, Schulmann and Ježek2003).
The Pieniny Klippen Belt is c. 600 km long and is now a 1–20-km-wide shear zone (Książkiewicz, Reference Książkiewicz1977; Birkenmajer, Reference Birkenmajer1986; Nemčok & Nemčok, Reference Nemčok and Nemčok1994). This belt comprises Mesozoic and Palaeogene rocks that were once a nappe pile but that were subsequently intensely deformed in a shear zone (Książkiewicz, Reference Książkiewicz1977; Birkenmajer, Reference Birkenmajer1986; Ratschbacher et al. Reference Ratschbacher, Frisch, Linzer, Sperner, Meschede, Decker, Nemčok, Nemčok and Grygar1993; Nemčok & Nemčok, Reference Nemčok and Nemčok1994). The belt became a shear zone during the Miocene (e.g. Nemčok & Nemčok, Reference Nemčok and Nemčok1994).
The Polish segment of the northern Outer Carpathians (Fig. 2a) is a north-verging fold-and-thrust belt (Fig. 2b) composed of Upper Jurassic – Lower Miocene flysch-dominated rocks (Książkiewicz, Reference Książkiewicz1977; Oszczypko, Reference Oszczypko2004; Ślączka et al. Reference Ślączka, Krugłov, Golonka, Oszczypko, Popadyuk, Golonka and Picha2005). The belt comprises five nappe complexes (from south to north): the Magura, the Fore-Magura–Dukla Group, the Silesian, the Subsilesian and the Skole (Fig. 2a). Only the most southern nappe, which is called Magura, extends along the whole Western Outer Carpathians. The other nappes are exposed mostly in the central and eastern part of the Western Outer Carpathians. The only exception is the Subsilesian nappe along with its western equivalents (Ždánice and Waschberg units), which crop out more extensively in the western part of Western Outer Carpathians (Picha et al. Reference Picha, Stráník, Krejčí, Golonka and Picha2005). The Miocene sediments of the southern part of the Polish Carpathian Foredeep were also deformed and incorporated into the Western Outer Carpathians as the Zgłobice Unit (Kotlarczyk, Reference Kotlarczyk and Kotlarczyk1985; Krzywiec, Reference Krzywiec2001). Sedimentation in the Carpathian Foredeep lasted to the Middle Miocene (the Serravallian, locally termed the Sarmatian; Oszczypko, Reference Oszczypko1998), but the presence of the Pannonian sediments (Olszewska, Reference Olszewska1999; Wójcik et al. Reference Wójcik, Szydło, Marciniec and Nescieruk1999) suggests that sedimentation could have finished as late as 8 Ma (Late Miocene; according to B. Olszewska in Márton et al. Reference Márton, Tokarski, Krejčí, Rauch, Olszewska, Tomanová and Wójcik2011). The Carpathian Foredeep sediments were deposited on the highly complex epi-Variscan platform and on the Permian–Mesozoic sedimentary cover of the European Platform (Karnkowski, Reference Karnkowski and Pożaryski1974; Oszczypko, Reference Oszczypko1998, Reference Oszczypko2006).
(a) Geological map of the Outer Carpathians modelled in this study with location of cross-section 1–2 (simplified after Żytko et al. Reference Żytko, Gucik, Ryłko, Oszczypko, Zając, Garlicka, Nemčok, Eliáš, Menčík, Dvořák, Stráník, Rakus, Matejovská, Poprawa and Nemčok1989; Połtowicz Reference Połtowicz1991; Jankowski, Reference Jankowski2007). (b) Simplified cross-section along line 1–2 after Żytko et al. (Reference Żytko, Gucik, Ryłko, Oszczypko, Zając, Garlicka, Nemčok, Eliáš, Menčík, Dvořák, Stráník, Rakus, Matejovská, Poprawa and Nemčok1989).

According to Pescatore & Ślączka (Reference Pescatore and Ślączka1984), Roca et al. (Reference Roca, Bessereau, Jawor, Kotarba and Roure1995) and Behrmann et al. (Reference Behrmann, Stasiany, Milicka and Pereszlenyi2000), the Outer Carpathian accretionary wedge formed in the direction from hinterland to foreland and its accretion started from the Magura nappe during the Oligocene. However, the results of synsedimentary deformation studies in the Eocene rocks of the Magura nappe suggest that the tectonic shortening started earlier during the Late Eocene (Świerczewska & Tokarski Reference Świerczewska and Tokarski1998). Balanced cross-section analyses have supported the earlier date (Nemčok et al. Reference Nemčok, Krzywiec, Wojtaszek, Ludhová, Klecker, Sercombe and Coward2006).
The tectonic evolution of the Polish segment of the northern Outer Carpathians is characterized by the superposition of two tectonic shortening events that were connected with regional tectonic transport directed first NNW–(N) and then NE (Aleksandrowski, Reference Aleksandrowski1985, 1989; Decker et al. Reference Decker, Nescieruk, Reiter, Rubinkiewicz, Ryłko and Tokarski1997, Reference Decker, Tokarski, Jankowski, Kopciowski, Nescieruk, Rauch, Reiter and Świerczewska1999; Zuchiewicz et al. Reference Zuchiewicz, Tokarski, Jarosiński and Márton2002; Tokarski et al. Reference Tokarski, Świerczewska, Zuchiewicz, Márton, Hurai, Anczkiewicz, Michalik, Szeliga and Rauch-Włodarska2006). The tectonic map of the Polish Outer Carpathians by Jankowski (Reference Jankowski2007) clearly shows the superposition of two generations of the map-scale thrusts.
According to Aleksandrowski (Reference Aleksandrowski1989) and Nemčok et al. (Reference Nemčok, Dilov, Wojtaszek, Ludhová, Klecker, Sercombe, Coward, Ries, Butler and Graham2007), the reconstructed σ1 stress axis trajectories for the Magura and Silesian nappes based on the regional folds and thrusts are characterized by an overall fan-shaped pattern, which supports an earlier study of jointing in the Silesian nappe (Mastella & Konon, Reference Mastella and Konon2002). According to Aleksandrowski (Reference Aleksandrowski1989) and Decker et al. (Reference Decker, Tokarski, Jankowski, Kopciowski, Nescieruk, Rauch, Reiter and Świerczewska1999) these regional structures were formed during the first event. The first structures were then partly refolded and overprinted by the set of structures derived from the second horizontal compression oriented NE–SW (Aleksandrowski, Reference Aleksandrowski1989; Decker et al. Reference Decker, Nescieruk, Reiter, Rubinkiewicz, Ryłko and Tokarski1997). Some NE-striking thrusts from the first shortening event were reactivated as sinistral strike-slip faults in the Polish western part of the Silesian and Magura nappes (Decker et al. Reference Decker, Nescieruk, Reiter, Rubinkiewicz, Ryłko and Tokarski1997) and also further to the SW in the Czech part of the Outer Carpathians (Fodor, Reference Fodor1995). However, only the folds and thrusts related to the horizontal compression oriented NE–SW occur in the eastern part of the Silesian nappe (Decker et al. Reference Decker, Tokarski, Jankowski, Kopciowski, Nescieruk, Rauch, Reiter and Świerczewska1999; Rubinkiewicz, Reference Rubinkiewicz2000).
The occurrence of two tectonic shortening events in the Polish Outer Carpathians connected with a c. 45° clockwise rotation of the regional horizontal compression has been interpreted as either due to a clockwise far-field stress rotation (Aleksandrowski, Reference Aleksandrowski1989; Decker et al. Reference Decker, Tokarski, Jankowski, Kopciowski, Nescieruk, Rauch, Reiter and Świerczewska1999) or a counter-clockwise body rotation of the Outer Carpathians (Zuchiewicz et al. Reference Zuchiewicz, Tokarski, Jarosiński and Márton2002; Tokarski et al. Reference Tokarski, Świerczewska, Zuchiewicz, Márton, Hurai, Anczkiewicz, Michalik, Szeliga and Rauch-Włodarska2006; Márton et al. Reference Márton, Rauch-Włodarska, Krejčí, Tokarski and Bubík2009).
Palaeomagnetic investigations in the Western Outer Carpathians were performed mainly in the westernmost part of the belt, on rocks from the Magura and Silesian nappes (Koráb et al. Reference Koráb, Krs, Krsová and Pagác1981; Krs et al. Reference Krs, Krsova, Pruner, Morris and Tarling1996; Grabowski et al. Reference Grabowski, Krzemiński, Nescieruk and Starnawska2006). The Cretaceous and Palaeogene rocks of the western part of Western Outer Carpathians showed a 40°–73° counter-clockwise rotation (Koráb et al. Reference Koráb, Krs, Krsová and Pagác1981; Krs et al. Reference Krs, Muska and Pagáč1982, Reference Krs, Krsová, Chvojka and Potfaj1991, Reference Krs, Chvojka and Potfaj1993 and 1996). Lower Cretaceous teschenitic rocks from the Silesian nappe showed an anticlockwise rotation of c. 14–70° (Grabowski et al. Reference Grabowski, Krzemiński, Nescieruk and Starnawska2006). Further, the Eocene rocks of the Dukla nappe in the eastern part of Slovakia (Eastern Outer Carpathians) indicated a counter-clockwise rotation of c. 20° (Krs et al. Reference Krs, Krsova, Pruner, Morris and Tarling1996).
The recent systematic palaeomagnetic investigations of the Late Eocene – Oligocene strata of the Magura nappe and the Oligocene strata of the Silesian nappe in the Czech and Polish segment of the Western Outer Carpathian belt enable the post-Eocene amount of rock rotation to be recognized within the Western Outer Carpathian belt (Márton et al. Reference Márton, Rauch-Włodarska, Krejčí, Tokarski and Bubík2009). The Magura nappe strata were rotated counter-clockwise by c. 50°, and these strata acquired their palaeomagnetic signals after folding. The central and eastern part of the Silesian nappe also underwent large counter-clockwise rotations (c. 45°) after the acquisition of the palaeomagnetic signals. The rocks of the western part of the Silesian nappe underwent a larger counter-clockwise rotation of c. 75°. According to Márton et al. (Reference Márton, Rauch-Włodarska, Krejčí, Tokarski and Bubík2009), such large rotations were caused by left-lateral shear related to a left-lateral wrench corridor, as documented from the Czech part of Outer Carpathians (Fodor, Reference Fodor1995). Márton et al. (Reference Márton, Rauch-Włodarska, Krejčí, Tokarski and Bubík2009) suggested that the Magura and Silesian nappes moved together after the Oligocene and that the movement was accompanied by a c. 50° counter-clockwise rotation.
3. Analogue modelling
Analogue modelling is a useful research method by which to understand the deformation mechanisms of individual structures or of entire orogens. The relationship between a particular structure and the experimental conditions under which it formed can therefore be better correlated. In this way, analogue modelling allows different geodynamic hypotheses to be tested for real geological structures, such as the development of fold-and-thrust belts and accretionary prisms (e.g. Davis et al. Reference Davis, Suppe and Dahlen1983; Mulugeta & Koyi, Reference Mulugeta and Koyi1987; Davy & Cobbold, Reference Davy and Cobbold1988; Mulugeta Reference Mulugeta1988; Zweigel, Reference Zweigel1998; Marshak Reference Marshak and McClay2004; Reiter et al. Reference Reiter, Kukowski and Ratschbacher2011). Such analogue modelling mostly uses an indenter, which may be either a rigid block (e.g. Zweigel, Reference Zweigel1998) or a vertical plate (e.g. Mulugeta & Koyi, Reference Mulugeta and Koyi1987), to push the soft experimental material in whatever way is required.
The experimental material itself must fulfil certain rheological criteria: these materials should behave in a mechanically similar way to the brittle rocks of the upper crust and follow the Coulomb yield criterion (e.g. Mulugeta, Reference Mulugeta1988). Traditionally, dry granular materials such as sand have been used in the analogue models of tectonic processes (e.g. Hubbert, Reference Hubbert1951; Schellart, Reference Schellart2000). However, the properties of wet clay are also appropriate because this ensures a dynamic similarity between the model and nature (e.g. Hubbert, Reference Hubbert1937). In the past, analogue models have used wet clay, plasticine, silicon or mixtures of different materials (e.g. Tapponnier et al. Reference Tapponnier, Peltzer, Le Dain and Armijo1982; Eisenstadt & Sims, Reference Eisenstadt and Sims2005; Boutelier et al. Reference Boutelier, Schrank and Cruden2008). A significant feature of dry sand is its very low cohesion (e.g. Schellart, Reference Schellart2000; Mechelen, Reference Mechelen2004), with any cohesive strength being mainly due to interlocking between grains (e.g. Mechelen, Reference Mechelen2004). The strength of dry sand can be increased through the addition of a small amount of liquid (Mechelen, Reference Mechelen2004). Nevertheless, the low cohesion of dry sand precludes any significant folding (Eisenstadt & Sims, Reference Eisenstadt and Sims2005) and any strain is essentially accommodated by faulting. Additionally, dry sand models and wet clay models produce very different results in inversion experiments: almost all faults are reactivated in the wet clay models but only a few, if any, are significantly reactivated in sand-only models (Eisenstadt & Sims, Reference Eisenstadt and Sims2005). This property of wet clay meant that wet material with clay was chosen as the experimental material in the present modelling. The possibility of the reactivation of the thrust surface of already-existing nappes during experiments was a significant property of the experimental material in the present models. The results of mesostructural investigations performed by Decker et al. (Reference Decker, Nescieruk, Reiter, Rubinkiewicz, Ryłko and Tokarski1997) suggest that, in the western part of the Polish Outer Carpathians, the main thrust of the Magura and Fore-Magura nappes were reactivated as low-angle strike-slip faults.
The results of the indentation experiments depend on the different parameters being tested such as basal friction, the effect of sedimentary thickness, the dip of the indenter and its geometry/shape and any other factors (e.g. Colletta et al. Reference Colletta, Letouzey, Pinedo, Ballard and Balé1991; Liu et al. Reference Liu, McClay, Powell and McClay1992; Zweigel, Reference Zweigel1998; Lickorish et al. Reference Lickorish, Ford, Bürgisser and Cobbold2002). In many experiments, the indenter is usually simply moved along a straight line (e.g. Zweigel, Reference Zweigel1998). Only rarely have indenters been moved along a more complicated path such as a curve, or with an added simultaneous rotation component (e.g. Lickorish et al. Reference Lickorish, Ford, Bürgisser and Cobbold2002).
In indentation analogue modelling, the most popular type of indenter has been the simple vertical plate which produces frontal indentation normal to the indenter margin (e.g. Mulugeta & Koyi, Reference Mulugeta and Koyi1987, Reference Mulugeta and Koyi1992). Oblique indentation can be modelled when the indenter movement is not perpendicular to the frontal margin of the indenter itself, or when the shape of the indenter is curved (e.g. Zweigel, Reference Zweigel1998; Lickorish et al. Reference Lickorish, Ford, Bürgisser and Cobbold2002). There have been experiments where the width of the indenter is smaller than the width of the experimental box, which produces deformation of the experimental material at the lateral indenter margins (e.g. Zweigel, Reference Zweigel1998). Such narrower indenters were used in the experiments presented in this paper.
4. Experimental procedure
4.a. Experimental material
Unconsolidated sediment from a very small lake in the vicinity of Kolbuszowa, Poland was used for the analogue models. The lake is in an area covered by Quaternary glacial sediments, mostly sand, silt or loess. The sediment used in the models is light-grey in colour and is unstratified. Binocular microscope observations showed that, by applying Powder's Roundness Scale (Powders, Reference Powders1953), the coarse silt and very fine sand are subangular to subrounded, and the fine and medium sand are rounded to well-rounded. The surfaces of sand have a frosted appearance suggestive of an aeolian origin. Zingg's shape classification (Pettijohn, Reference Pettijohn1975) would term the very fine silt as being mostly prolate, while sand is mostly equiaxial; muscovite is the exception, being triaxial.
The material used for the modelling contains c. 12.3% clay minerals (muscovite, smectite and illite), 7.8% albite, 8.5% microcline and the remaining 71.4% being quartz. These mineral proportions were quantified by X-ray powder diffraction. With respect to the grain size, the sediment as a whole can be classed as a sandy silt (Head, Reference Head1992), but the detailed size fractions (in weight %) are as follows: clay fraction (<0.002 mm) 6%; silt fraction (0.050–0.002 mm) 49% and sand fraction (2.00–0.05 mm) 45%.
The material has low cohesion (14.16 kPa) and small angle of internal friction of 12.12° (Table 1). The plastic limit of the material is 17.50% by weight, its liquid limit is 25.65% by weight, its plasticity index is 8.15% and its flow index is 0.21. The sandy silt used in the experiments was wet and had a density of c. 1.86 g cm−3 and a water content of c. 20%. A suitable water content was determined by repeated testing, because the wet sandy silt should be able to undergo brittle deformation (faulting) as well as folding. Before each experiment the sandy silt was mixed with water to form a homogeneous composition.
Quantity nature model scaling ratio (model/nature)

aAverage density after Stefaniuk et al. (Reference Stefaniuk, Ostrowski, Targosz and Wojdyła2009); bProperties of shales after Broniatowska (Reference Broniatowska2008); cProperties of sandstones after Łukaszewski (2007).
4.b. Model construction
All experiments were performed at the Laboratory of Analogue Modelling in the Institute of Geological Sciences, Polish Academy of Sciences. The layer of the sandy silt used in the modelling was c. 6 mm thick (Fig. 3). The maximum thickness of the sedimentary sequences of the Carpathian basin reached 5000 m, locally even 7000 m in the Silesian nappe (Poprawa et al. Reference Poprawa, Malata and Oszczypko2002). The vertical scaling of the model was c. 10−6, i.e. 1 mm in the model represents 1000 m in nature. The average density of the rocks in the Polish Outer Carpathians is 2.64 g cm−3 (Stefaniuk et al. Reference Stefaniuk, Ostrowski, Targosz and Wojdyła2009).
Diagram of the experimental apparatus. (a) Plan view of the deformation table showing analogue model start position and the rectangular indenter that was used in experiment 1 (white arrow shows the compression direction). (b) Cross-section of the deformation table with compression direction from right to left.

An orthogonal grid with the mesh size of c. 2 × 2 cm was inscribed on top of the experimental layer. The grid enabled continuous monitoring of the deformation and rotation of the material during the experiment. Each experiment was systematically photographed. Each layer of experimental material was laid horizontally and was blocked on two sides in the direction of indentation (to the north and east) to simulate resistance by the Carpathian Foreland.
Each indenter was wooden, 3 cm thick and had vertical sides because the southern margin of the Polish Outer Carpathians is vertical or subvertical on published cross-sections (Fig. 2b). Two kinds of indenter shape were tested: a rectangular and a quasi-triangular indenter. The quasi-triangular shape resembled the present-day southern boundary of the northern Outer Carpathians (Fig. 1). The rectangular indenter was included as a typical shape of the indenter.
The base of the indenter was in contact with the table and was displaced at a constant velocity of 0.1 mm s−1 (36 cm h−1). This indentation velocity produced thrusts that dipped towards the indenter, which were successively formed in the foreland direction. Slower indentation caused a topographic accumulation of material in front of the indenter, but without any macroscopically visible brittle deformation (e.g. thrusts). The experiments were repeated several times and revealed similar results in all cases. The length scaling of the model was 10−6, i.e. 1 cm in the model represents 10 km in nature (Table 1).
4.c. Three model scenarios
Three experiments were performed, one with the rectangular indenter and two with the quasi-triangular indenter. The rectangular indenter was pushed into the sandy silt normal to its frontal margin (Fig. 3). This simple experiment was also performed for comparative purposes for the more complex quasi-triangular indenter experiments.
Reconstructions of the Oligocene–Miocene tectonic evolution of the Pannonian–Carpathian system (e.g. Kováč et al. Reference Kováč, Král, Márton, Plašienka and Uher1994; Fodor et al. Reference Fodor, Csontos, Bada, Györfi, Benkovics, Durand, Jolivet, Horváth and Séranne1999; Nemčok et al. Reference Nemčok and Nemčok1998a ) suggest that the ALCAPA block moved north- and eastwards with a probable simultaneous counter-clockwise rotation during the Miocene. Additionally, detailed mesostructural research on the Western Outer Carpathians (Aleksandrowski, Reference Aleksandrowski1989; Decker et al. Reference Decker, Nescieruk, Reiter, Rubinkiewicz, Ryłko and Tokarski1997, Reference Decker, Tokarski, Jankowski, Kopciowski, Nescieruk, Rauch, Reiter and Świerczewska1999; Tokarski et al. Reference Tokarski, Świerczewska, Zuchiewicz, Márton, Hurai, Anczkiewicz, Michalik, Szeliga and Rauch-Włodarska2006) suggests that there were two different directions of the regional tectonic transport caused by the motion of the hinterland/ALCAPA block, both of which were oriented first N–S and then NE–SW. In the laboratory, the different ways that the indenter/ALCAPA block movement were tested. The experimental procedures differentiated between the direction of indenter movement and the presence of a simultaneous anticlockwise rotation. The two types of experiments (Fig. 4a, b) were: (1) the quasi-triangular indenter was pushed in two successive directions that varied by c. 45°, i.e. the indenter was pushed first to the north (in relation to present geographic coordinates) and then to the northeast; and (2) the quasi-triangular indenter was pushed in one defined direction (NE–SW in relation to present geographic coordinates) with a simultaneous counter-clockwise rotation of c. 60°. The amount of indenter rotation was determined on the basis of palaeomagnetic investigations of the Oligocene Podhale Flysch (Inner Western Carpathians, south of the Pieniny Klippen Belt), which suggested that this flysch underwent an anticlockwise rotation of c. 60° (Márton et al. Reference Márton, Mastella and Tokarski1999).
Schematic scenarios of experiments 2 and 3, which used a quasi-triangular indenter. (a) Experiment 2, in which the indenter was pushed initially to the north (in present geographic coordinates) and then to the NE. (b) Experiment 3, in which the indenter was pushed ENE but with a simultaneous anticlockwise rotation of c. 60°. The quasi-triangular shape of the indenter was intended to resemble the present-day southern boundary of the northern Outer Carpathians. Geological map of the Carpathian–Pannonian–Dinaride region after Csontos et al. (Reference Csontos, Nagymarosy, Horváth and Kováč1992).

The amount of Oligocene–Miocene displacement of the ALCAPA block has also been much debated. Shortening of the western part of the northern Outer Carpathians along a NW–SE profile reached a maximum of 160 km (Picha et al. Reference Picha, Stráník, Krejčí, Golonka and Picha2005); the shortening of the eastern part of the northern Outer Carpathians along a NE–SW profile reached a maximum of 260 km (e.g. Behrmann et al. Reference Behrmann, Stasiany, Milicka and Pereszlenyi2000). The amount of the continental escape of the ALCAPA block is estimated as 60–100 km in the Alps (Schmid et al. Reference Schmid, Aebli, Heller, Zingg and Coward1989).
The type of experimental material used imposed the additional difficulty of selecting the length of indentation. According to Eisenstadt & Sims (Reference Eisenstadt and Sims2005), indenter movement at the start of an analogue experiment into wet clay (and wet sandy silt) does not cause the formation of macroscopically visible overthrusts. In the present experiments, the displacement size of the indenter was therefore chosen arbitrarily and was dependent on the suitable quantity of slices in experimental prism, the equivalents of nappes in the real Carpathian belt. In consideration of that fact, the displacement size of the indenter was greater than suggested in the literature. Conversion of the distance in the model to the distance in the Carpathian area shows that the amount of the indenter displacement reached c. 450 km in the first experiment with the rectangular indenter, 600 km (400 km to the north, 200 km to the northeast) in the second experiment with the quasi-triangular indenter and 210 km (in reference to the rotation pivot of indenter) in the third experiment (Fig. 4).
Corner effects at the Bohemian promontory have also been considered an important factor which influence the style of ALCAPA block movement during its Neogene emplacement into the Carpathian embayment (Sperner et al. Reference Sperner, Ratschbacher and Nemčok2002; Ratschbacher et al. Reference Ratschbacher, Frisch, Linzer and Merle1991b ; Bada, Reference Bada1999). In the experiment with the rotation of the quasi-triangular indenter, the position of the pole of rotation was therefore the position associated with and assumed for the Bohemian Massif (Fig. 4b).
5. Experimental results for the three scenarios
5.a. Experiment 1: model with rectangular indenter
5.a.1. Experiment 1 results
In this experiment the indenter was 12 cm wide and had a rectangular shape. The experimental layer was 30 cm long and 28 cm wide (Fig. 5a). The indenter was pushed into the wet sandy silt perpendicular to its leading edge and parallel to its lateral edges.
Line drawings taken from photographs of the model of experiment 1, which utilized a rectangular indenter. The drawings show the deformation style during the chosen stages of Experiment 1.

The forward motion of the indenter deformed the experimental layer such that the grid lines became curved and there was a simultaneous lateral and horizontal escape of experimental material. This lateral escape manifested as lateral bending of the experimental layer. The left (referred to below as western) side of the sandy silt layer was not blocked, so the bending was more strongly developed on that side. The originally orthogonal grid lines (Fig. 5a) became non-orthogonal in the deformed region in front of the moving indenter (Fig. 5b); these lines recorded a penetrative shear strain. In relation to the middle of the indenter, the longitudinal grid lines rotated clockwise in front of the left-hand (western) side of the indenter and counter-clockwise on the right-hand (eastern) side. At the same time the latitudinal lines rotated counter-clockwise on the left-hand (western) side of the indenter and clockwise on the right-hand (eastern) side. The majority of grid meshes in the deformed part of the experimental layer in front of the prism were therefore rhomboid in shape, indicative of simple shearing, a feature also visible on both sides of the frontal part of prism (Fig. 5f). Whereas the rear part of the prism underwent pure shearing, as indicated by the style of grid line deformation, the grids have been squeezed perpendicular to the frontal indenter margin and stretched parallel to it (Fig. 5b). Grid lines were deformed well beyond the range of the prism: after only 20% shortening, nearly all the grid lines were deformed except for the last one in the most distal part of the experimental layer (Fig. 5b). All grid lines were deformed after 23.33% shortening. Such deformation of the grid lines suggested a long distance of penetration of the stress in the wet sandy silt layer without any significant faults except the basal detachment of this experimental layer from the basement.
At about 20% shortening of the model (Fig. 5b) the material was accumulated as the topographical elevation at the front of the moving indenter, but there was no sign of macroscopically visible brittle deformation within such a wedge. This wedge, called a protoprism, was laterally terminated by steeply dipping transfer faults (Fig. 6). These transfer faults had the character of tear faults, and they were formed in the indenter lateral edge prolongation and penetrated the whole layer of experimental material. The indenter lateral edges were parallel to the direction of indentation.
Photograph showing an oblique view of the model of experiment 1 (rectangular indenter displacement is 7 cm; bulk shortening is 23.33%).

Main thrusts were initiated as segments (Fig. 5c) and these smaller thrusts propagated laterally and, with increasing indenter displacement, became linked together across the model by the transfer faults mostly in the form of oblique thrusts (Fig. 5d). Each trace of the main thrust was therefore not linear but varied along-strike. At the beginning, the trace of almost every new small thrust at the front of the prism was slightly arched. The lateral linking of such thrusts was finished by formation of the large thrust whose trace was also in general arched (Fig. 5d). Further indentation forced the prism to grow and caused a straightening of the traces of older, inner thrusts so that these became nearly parallel to the frontal margin of the rectangular indenter (compare Figs 5d–f).
Main thrusts were formed in the sequence towards the indenter's foreland and dipped towards the indenter. There were also a small number of thrusts that dipped in opposite directions and accompanied the main thrusts, interpreted as back-thrusts (Fig. 5e).
The markers in the rear part of the prism (Fig. 7, a–g markers) showed that, at the start of the experiment, the innermost slice bent convexly to the foreland when there was up to 23.33% shortening (Figs 5c, 7a). Further indentation caused a straightening of this slice (Figs 5e, 7) and, later, its bending in the opposite direction (convexly to the hinterland). This latter geometry resulted from back-thrusting of the experimental prism over the indenter (Figs 5f, 7). The markers in front of the prism (Fig. 7; h–p markers) showed continuous bending of the material convexly to the foreland during the whole experiment (Fig. 7b).
Marker orientations from experiment 1, which used a rectangular indenter. (a) Sketch of the original model before the experiment showing the location of markers through the whole experiment. (b) Sketch of the final model with the final orientation of the markers.

5.a.2. Experiment 1: comparison between the model and the Western Outer Carpathians
The rectangular indenter was used in the first experiment. Although the outline of the experimental prism was convex to the north (Fig. 5f), the model with the rectangular indenter did not produce a sufficiently arcuate geometry as compared to the northern Outer Carpathians (Fig. 8a). Additionally, the traces of the main thrust in the northern Outer Carpathians are curved convexly to the foreland and are not sharply terminated on transfer faults striking N–S as in model 1 (Fig. 8a).
Comparison between model 1 (see Fig. 5f) and the map-view of the main tectonic features of the Carpathian area (after Csontos et al. Reference Csontos, Nagymarosy, Horváth and Kováč1992). (a) Indentation direction N0°E. (b) Indentation direction N30°E.

In the eastern part of the northern Outer Carpathians (northern part of the Eastern Outer Carpathians), the traces of the main thrusts are almost straight and parallel to each other, parallel to the frontal margin of the Carpathian wedge and parallel to the southern boundary of the Carpathian wedge (Fig. 1). This type of wedge geometry could be produced by the rectangular indenter moving to the NE (azimuth of indentation direction, N30°E). However, such a model (Fig. 5f) is abruptly terminated on tear faults at both its sides, suggesting that the correct type of indenter for simulating the evolution of the Western Carpathian wedge should be less curved on its western side compared to the right corner of the rectangular indenter (Fig. 8b). The rectangular indenter model shows neither the presence of two successive stages of tectonic shortening nor well-marked counter-clockwise horizontal rotation of rocks within the prism.
5.b. Experiment 2: model with quasi-triangular indenter moved in two successive directions
5.b.1. Experiment 2 results
In experiment 2, the experimental layer was 30 cm long and 28 cm wide, and the shape of the indenter was quasi-triangular in order to resemble the shape of the ALCAPA block (Fig. 9a). The experiment was divided into 2 stages: first, the indenter was moved northwards (relative to present geographic coordinates; Figs 9a–e); second, and subsequent to the first stage, the indenter was moved to the NE (Fig. 9f).
Line drawings taken from photographs of the model of experiment 2, which used a quasi-triangular indenter moving in the two successive directions (same legend as in Fig. 5). The drawings show the deformation style of two-stage model during both stages.

At the beginning of the indentation process when there was up to 14.61% shortening (Fig. 9b), the observed processes were very similar to Experiment 1: accumulation of material at the indenter front, but no sign of brittle deformation (Fig. 10); curvature of the grid lines; and lateral escape of material (Fig. 9b). The originally orthogonal grid lines (Fig. 9A) were deformed in front of the moving indenter in an opposing style relative to the apex of the quasi-triangular indenter (Fig. 9b). The longitudinal grid lines rotated counter-clockwise on the left-hand (western) side of the indenter apex and clockwise on its right-hand (eastern) side. The majority of the grid meshes in the deformed part of the experimental layer had a rhomboid shape, indicative, as for Experiment 1, of simple shearing. The grid meshes at the rear (southern) part of the experimental layer showed that this material underwent a rotation component. In this rear zone, the material deformed via pure shear: the grid meshes were squeezed perpendicular to the frontal indenter margin and were stretched parallel to this margin (Fig. 9b).
(a) Oblique frontal and (b) top-view of experiment 2, which used a quasi-triangular indenter after 14.61% bulk shortening; see Figure 9b for the map-view of the model.

During the first northwards stage (Fig. 9a–e), the trace of a newly formed thrust was slightly arched, convex to the foreland. In the initial phase of thrust formation, the trace of its fault line disappeared laterally. The main thrusts initiated as segments of small thrusts (Fig. 9d) that laterally propagated and linked across the model with increased displacement of the faults (Fig. 9e; note thrusts in the frontal part of the experimental prism). Increased fault displacement caused the formation of transfer faults as the lateral termination of thrust propagation (Fig. 9e). On the left-hand (western) side of the indenter apex, where the experimental layer was not blocked and the indenter margin was less oblique to the indentation direction, the thrusts terminated on tear faults (Fig. 9e). On the right-hand (eastern) side of the apex, tear faults seldom occurred but oblique thrusts were formed (Fig. 9e). In relation to present geographic coordinates, the tear fault traces were orientated in three predominant ways (Fig. 9e): (1) mostly NNE–SSW in the left-hand (western) side of the experimental prism (in relation to the apex of the indenter); (2) mostly NNW–SSE (to NW–SE) and NNE–SSW in front of the indenter's apex; and (3) mostly NNE–SSW on the right-hand (eastern) side of the experimental prism.
The main thrust that developed during this experiment dipped towards the indenter. Back-thrusts only occurred in small numbers and accompanied the main faults (Fig. 9e). After the indenter was displaced by 11 cm (Fig. 9d) the traces of any new faults were almost perpendicular to the direction of indenter movement. By this time, the older/inner thrust had become more curved and slightly mimicked the indenter shape. In relation to present geographic coordinates, the thrust traces were orientated in three main ways (Fig. 9e): (1) mostly WSW–ENE (N65–80°E), with rare W–E trends and a local SW–NE trend in the left-hand side of the experimental prism (in relation to the apex of the indenter); (2) mostly W–E in front of the indenter apex; and (3) mostly WNW–ESE (N110–125°E) with a rare W–E trend, or a local SW–NW trend (note oblique thrust in the frontal part of the prism) in the right-hand (eastern) side of the experimental prism. The traces of the inner thrusts are strongly curved convex to the foreland, the orientation of these traces roughly mimicking the quasi-triangular outline of the indenter. The outline of the prism (the first stage of experiment 2) was nearly linear in its central part and more curved in its eastern part, where the oblique thrusts were formed. The western side of the prism was characterized by the step-like geometry of the outline, because the main thrusts terminated westerly on a tear fault.
Numerous tension gashes formed within the whole experimental prism (Fig. 9c–e). These structures were particularly numerous in front of the left-hand (western) side of the quasi-triangular indenter which had a less oblique margin to the indentation direction compared to its eastern margin (Fig. 9e). All the observed extensional cracks were orientated predominantly NNW–SSE and N–S, with a rare subset oriented NW–SE and some locally NNE–SSW at the left-hand (western) side of the experimental wedge (Fig. 9e). At the right-hand (eastern) side of the wedge, tension cracks were less frequent and were oriented mostly NNE–SSW or N–S. This side of the model was blocked. The E–W extension exerted the largest influence at the front of the indenter apex and was marked by a formation of large gaps within the wet sand silt. The orientation of the extensional structures suggests they may be viewed as orogen-parallel extension within the experimental prism (Fig. 9e).
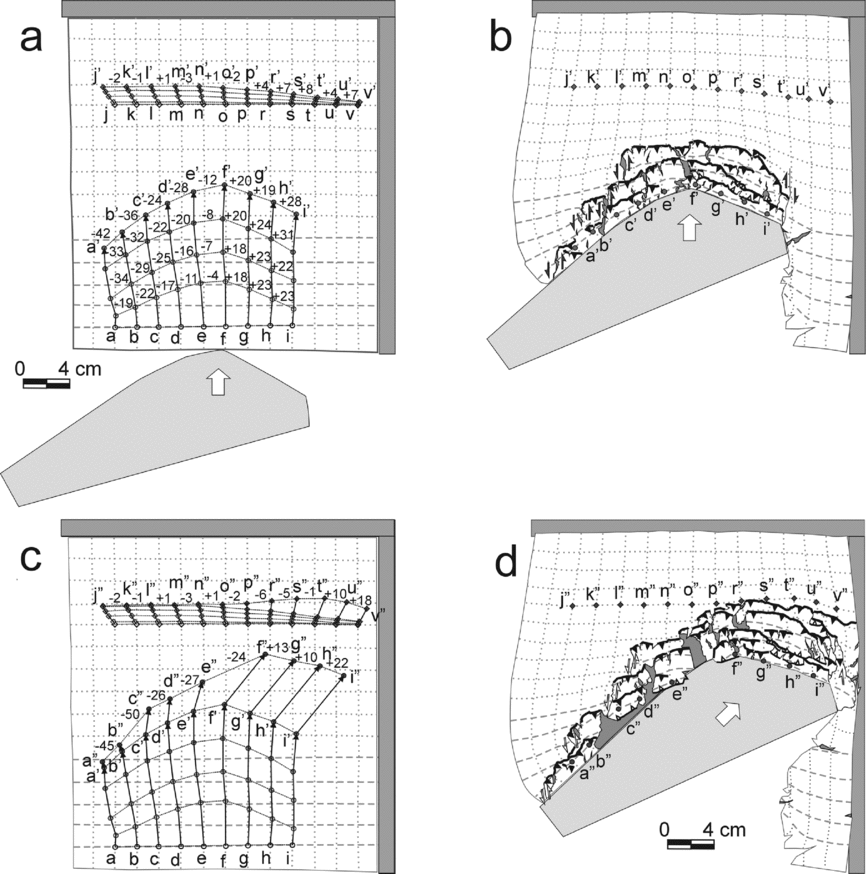
The second stage of the experiment was when the indenter was then moved to the NE (in relation to present geographic coordinates). During this phase, a new structure formed at the right-hand (eastern) side of the experimental prism (Fig. 9f). At the left-hand (western) side of the model, the older thrust surfaces were reactivated as sinistral faults. The numerous tension gashes formed here during the first stage became increasingly stretched. At the right-hand side of the model, the tension gashes remained weakly developed. At the left-hand side of the model at the end of the experiment, the thrust traces were oriented mostly WSW–ENE (N60–80°E), locally SW–NE or even NNE–SSW in the southern-most part of the model, and E–W in its northern part. At the end of the experiment, the thrust traces were oriented mostly W–E and WNW–ESE (N110–120°E) and locally NW–SE at the eastern part of the model. Also at the eastern part, the older slices which had formed during the first event were slightly counter-clockwise rotated by up to 5–10°, as determined from the rotation of the longitudinal grid lines and the previous orientation of the thrusts (Fig. 11). In the western part of the model, the older slices were also locally rotated by c. 5–10° either clockwise (Fig. 9f, see slice partly back-thrusted over the indenter) or counter-clockwise (Fig. 9f, see the most northern slice). The slices in the experimental wedge also underwent simple shearing (Fig. 9f; see the rhomboid shape of the originally rectangular grid meshes). The real rotation of the experimental material should therefore be slightly different from the rotation determined via orientation of the longitudinal grid lines (Fig. 11). Back-thrusts were observed mostly in the rear part of the model, but also locally in the central part where single small slices were back-thrusted over the indenter.
Marker orientations from the two-stage model of experiment 2, which used a quasi-triangular indenter. (a) Sketch of the original model before the experiment showing the location of markers through the first stage of the experiment. (b) Sketch of the final model of the first stage with the final location of the markers at this stage. (c) Sketch of the original experimental layer showing the location of markers through the whole two-stage experiment. (d) Sketch of the final location of the markers in this experiment. A letter of the alphabet was a symbol of each marker; numbers show the amount of rotation of the hypothetical line which jointed the neighbouring markers; – means anticlockwise rotation; + means clockwise rotation in comparison to the original position of markers. Other symbols as in Figure 7.
5.b.2. Experiment 2: a comparison between model 2 and the Outer Carpathians
The first stage of experiment 2 with indentation northwards produced a roughly symmetrical final model, omitting the lateral termination of the main thrusts. The thrust traces of the inner slices of the experimental wedge were oriented roughly similar to the outline of the indenter.
In the model the main thrusts were sharply terminated laterally and westwards on sinistral tear faults. In the western part of the Western Outer Carpathians, the main thrusts of the Magura and Silesian nappes were not laterally or sharply terminated on tear faults (Fig. 12a). Nevertheless, the trace of the frontal thrust of the Magura nappe shows a stair-like outline, which may suggest that the Magura nappe could have been formed during such oriented indentation. The first stage of experiment 2 explains the presence of the tectonic shortening which is related to the horizontal N–S compression, but not NE-SW compression. The occurrence of the second shortening event may be explainable in terms of stage 2 of this experiment.
Comparison between the results of the two-stage model of experiment 2, which used a quasi-triangular indenter moving in two successive directions (Fig. 9) and the map-view of the Carpathian area (after Csontos et al. Reference Csontos, Nagymarosy, Horváth and Kováč1992). (a) End of the first stage of the experiment after indentation to N (Fig. 9e) and (b) final stage (Fig. 9f).

Stage 2 of the model with the quasi-triangular indenter produces a more curved geometry, more compatible with that of the Western Outer Carpathians than that produced only by stage 1 (Fig. 12). A map-view geometry of the model corresponds to the geometry of the inner part of the northern Outer Carpathians, i.e. it seems to model the Magura nappe (Fig. 12a). Today, the trace of the frontal thrust of the Magura nappe in the western part of the Western Outer Carpathians has a stair-like outline (Fig. 2a; see also Żytko et al. Reference Żytko, Gucik, Ryłko, Oszczypko, Zając, Garlicka, Nemčok, Eliáš, Menčík, Dvořák, Stráník, Rakus, Matejovská, Poprawa and Nemčok1989 and Lexa et al. Reference Lexa, Elecko, Mello, Polak, Potfaj and Vozar2000). Comparison between the two-stage model of the second experiment and the real Outer Carpathians (Fig. 12a) suggests that the innermost part of the northern Outer Carpathians could have been formed as a result of northwards indentation by the ALCAPA block, in relation to the present-day position of the ALCAPA block and Outer Carpathians. The two-stage model explains the occurrence of the two shortening events in the Western Outer Carpathians as a result of change of movement direction of the ALCAPA block.
However, there are large differences between the model and the real orogen. In the western part of the two-stage model, the sharp lateral termination of the main thrusts on the tear faults were still visible. In the western part of the Western Outer Carpathians, the main thrusts of the Magura and Silesian nappes were not so sharply terminated on tear faults as in the model (Fig. 12). Additionally, the counter-clockwise rotation of the rocks was detected along most of the northern Outer Carpathians while the experimental material rotated counter-clockwise in the western part of the prism (related to the western part of the northern Outer Carpathians) and clockwise in its eastern part (Fig. 11).
5.c. Experiment 3: model with quasi-triangular indenter rotated and simultaneously moved in one direction
5.c.1. Experiment 3 results
For experiment 3, the width of the experimental layer was 26 cm and the lengths of the layer sides were 26 and 35 cm (Fig. 13a). The shape of the indenter was also quasi-triangular in this experiment, resembling the shape of the ALCAPA block (Fig. 4b). The model simulated movement of the ALCAPA block in the NE direction (in relation to present-day geographic coordinates) but with a simultaneous counter-clockwise rotation of c. 60°. This rotation was constant throughout the whole experiment, the indenter moved to the NE, and the rotation axis was located at the western end of the indenter (Figs 4b, 13).
Line drawings from photographs of model of experiment 3. In this experiment the quasi-triangular indenter moved to the NE and simultaneously rotated anticlockwise (same legend as in Fig. 5). The drawings show the deformation style of model during the chosen stages of experiment 3.

The progressive indentation caused the grid lines to curve in front of the moving indenter, as in Experiments 1 and 2 (Fig. 13b). During the whole of Experiment 3, the zone of curvature of the grid lines was also visible in front of the experimental prism (Fig. 13b–g). However, the penetration range of the shear strain was here significantly smaller than for the other two experiments (compare Figs 5, 9, 13). The shear strain which showed up as lateral bending of the experimental layer in the previous experiments was not visible in this model (Fig. 13g). Latitudinal grid lines were rotated counter-clockwise in front of the western part of the indenter and clockwise in front of its eastern part (Fig. 13c). Longitudinal grid lines were rotated counter-clockwise almost in front of the entire indenter. The slices of the western part of the prism rotated counter-clockwise. The degree of primary counter-clockwise rotation of the slices was increased by the additional counter-clockwise rotation of the prism together with the indenter. The degree of primary clockwise rotation of the slices in the eastern part of the experimental prism was reduced by progressive counter-clockwise rotation of the whole prism together with the indenter (Fig. 13g).
During initial indentation (up to 6.92% shortening along the longitudinal direction), material accumulated at the front of the moving indenter and was only manifested topographically as an elevation of the material, i.e. there was no macroscopically visible brittle deformation (Fig. 13b). During this initial indentation, the left-hand (western) side margin of the quasi-rectangular indenter was roughly perpendicular to the resultant direction of the indenter apex movement and its right-hand (eastern) side margin was almost oriented at an acute angle to this direction, a simplification of reality similar to that used in experiment 1 (Figs 4a, 13a). As a result of such orientation of the indenter compared to the indentation direction, dextral tear faults formed in front of the indenter's apex as this was the sharp edge of the indenter (Fig. 13b).
Thrusts that developed as experiment 3 progressed were gently curved, convex towards the foreland and roughly perpendicular to the direction of indentation (e.g. Fig. 13c, d). In the initial phase of thrust formation, the trace of the fault line disappeared laterally. The thrusts initiated as segments (e.g. Fig. 13d; see the thrusts in the frontal part of the experimental prism) that laterally propagated and linked across the model with increased displacement on the faults (Fig. 13e). In the western part of the model, the thrusts terminated mostly as oblique thrusts (Fig. 13f); only one tear fault was formed here and this fault was located at the SW end of the experimental wedge. A different situation developed in the eastern part of the model with respect to the indenter's apex. The majority of the thrusts in this inner part of the experimental wedge laterally terminated on tear faults (e.g. Fig. 13e). Starting from a position of 26.53% shortening (along the longitudinal direction), a major thrust formed at the front of the experimental wedge and was laterally terminated eastwards as an oblique thrust (Fig. 13e). The traces of the majority of the thrusts were parallel or subparallel to the orientation of the indenter margin in the eastern part of the final model, with the exception of the oblique thrusts (Fig. 13g).
A different situation developed in the western part of the model. The outline of this part of the experimental wedge was nearly parallel to the orientation of the indenter margin. The frontal thrusts of the experimental wedge were mostly composed of the segments of the different oblique thrusts (an exception was one internal slice; Fig. 13g). The direction of the thrust traces varied significantly at the front of the indenter apex in the final model, ranging from NE–SW through W–E to NW–SE.
The markers in the western part of the experimental wedge (Fig. 14; a–d markers) showed that this part of the wedge curved convexly towards the foreland when shortening was up to 6.92% (compare Fig. 13b). Further indentation caused a slight straightening of this part of the slice and the simultaneous progressive counter-clockwise rotation of the prism together with the indenter (Fig. 14a). Observations of the grid mesh squares in front of the western part of the indenter showed that the grid meshes were initially deformed into rhomboid shapes (Fig. 13b) and subsequently into rectangular shapes (Fig. 13e). The grid meshes in the final model suggest that the experimental material was squeezed perpendicular to the frontal indenter margin and stretched parallel to it (Fig. 13g).
Marker orientations during experiment with quasi-triangular indenter moved to the NE and simultaneously rotated anticlockwise. (a) Sketch of the original model before the experiment with the orientation of markers through the whole experiment. (b) Sketch of final model with final orientation of the observed markers. Symbols as in Figures 7 and 11.

Observations of the grid mesh squares in the eastern part of the experimental wedge showed that the grid meshes underwent a large degree of simple shearing (Fig. 13g). The longitudinal grid lines were first rotated clockwise (Fig. 14a; see f–g markers) and then rotated counter-clockwise, as a result of the counter-clockwise rotation of the prism together with the indenter. The markers at the front of the prism (Fig. 14; m–z markers) showed that there was a continuous slight bending of this part of the material convexly to the foreland, and this was connected to a slight clockwise rotation of this bend (Fig. 7b).
5.c.2. Experiment 3: a comparison between model 3 and the Outer Carpathians
In the third experiment the quasi-triangular indenter was moved NE and simultaneously rotated counter-clockwise by c. 60°. The orientation of the trace lines of the main thrusts in the model are roughly the same as for the real Outer Carpathians, especially in the northern part of the experimental model (Fig. 2a; see also Żytko et al. Reference Żytko, Gucik, Ryłko, Oszczypko, Zając, Garlicka, Nemčok, Eliáš, Menčík, Dvořák, Stráník, Rakus, Matejovská, Poprawa and Nemčok1989; Lexa et al. Reference Lexa, Elecko, Mello, Polak, Potfaj and Vozar2000). The thrusts in the western part of the prism terminated on sinistral oblique thrusts. A comparison between experiment 3 and the Outer Carpathians reveals that the Silesian nappe seems to fit well with the model: this nappe terminates westwards on the frontal Magura thrust and the trace of the frontal thrust of the Silesian nappe has the same oblique orientation as in the model (compare Figs 2a, 15). The innermost slice, corresponding to the Magura nappe of the Outer Carpathians, extends to the western-most end of the experimental prism as in the northern Outer Carpathians. However, the trace of the frontal thrust of this slice is only slightly convex to the north in comparison to the real orogen. Additionally, the trace of this thrust does not show the stair-like outline of the trace of the frontal thrust of the Magura nappe in the western part of the Western Outer Carpathians (Fig. 2a).
Comparison of the results of the third experiment (with quasi-triangular indenter which moved to the NE and simultaneously rotated anticlockwise; Fig. 13g) and the map-view of the Carpathian area (after Csontos et al. Reference Csontos, Nagymarosy, Horváth and Kováč1992). The figure shows the location of two significant gaps in the experimental prism which were located at a similar position as two Neogene basins of the Western Outer Carpathians.

The eastern part of the model shows structures that correlate with those seen in the northern Outer Carpathians (Fig. 1). Namely, the traces of the thrusts in the model are parallel to each other and parallel to the orientation of the eastern margin of the indenter (Fig. 15). The counter-clockwise rotation of the experimental material in the western and central parts of the prism is quite well recorded in experiment 3 (Fig. 14). These parts of the experimental prism correspond to the Western Outer Carpathians (Fig. 15).
The map-view geometry of model 3 roughly corresponds to the geometry of the northern Outer Carpathians (Fig. 15). The outline of this experimental prism is appropriately arcuate when compared to the northern Outer Carpathians; it is asymmetrical and is wider in its eastern part. This experiment explains the occurrence of two shortening events and the counter-clockwise rotation of rocks within the Western Outer Carpathians. The northern Outer Carpathians could therefore be formed in front of the counter-clockwise-rotating ALCAPA block which moved to the NE.
6. Summary and discussion of the modelling
The Outer Carpathian fold-and-thrust belt is one of the most curved belts in the world. The northern part of this belt was the subject of the present study. The curved thrust traces seen in map-view are common in real fold-and-thrust belts (e.g. Elliott, Reference Elliott1976; Fischer & Woodward, Reference Fischer, Woodward and McClay1992). A variety of parameters generate curved fold-and-thrust belts (e.g. Butler et al. Reference Butler, Richards, Sempere and Marshall1995; Macedo & Marshak, Reference Macedo and Marshak1999; Yonkee & Weil, Reference Yonkee and Weil2010). It is currently thought that the northern Outer Carpathian belt was formed as an accretionary prism in front of the advancing continental fragment, the so-called ALCAPA block during Oligocene–Miocene times (e.g. Pescatore & Ślączka Reference Pescatore and Ślączka1984; Kováč et al. Reference Kováč, Král, Márton, Plašienka and Uher1994; Morley Reference Morley1996; Nemčok et al. Reference Nemčok and Nemčok1998a ; Fodor et al. Reference Fodor, Csontos, Bada, Györfi, Benkovics, Durand, Jolivet, Horváth and Séranne1999; Behrmann et al. Reference Behrmann, Stasiany, Milicka and Pereszlenyi2000). The present-day southern boundary of the northern Outer Carpathians has a concave, quasi-triangular shape. The similar convex shape is the northern boundary of the northern Outer Carpathian belt, which suggests that the quasi-triangular ALCAPA block had an influence on the formation of the convexly curved Outer Carpathian belt; the influence of the indenter-controlled parameters was therefore tested at the beginning of this research. According to Macedo & Marshak (Reference Macedo and Marshak1999), the influence of indenter-controlled parameters on the generation of curved fold-and-thrust belts is indisputable. In order to test the possible influence of such parameters on the geodynamic evolution of the northern Outer Carpathian belt, three experiments which differed in respect of the shape of indenter used and its movement were conducted. The positive results of the modelling seem to be very promising, suggesting that it can be a plausible geodynamic analogue scenario for Oligocene–Miocene tectonic evolution of the northern Outer Carpathians. However, the positive results of modelling do not necessarily imply that other parameters are not important. For example, Nemčok et al. (Reference Nemčok, Coward, Secombe and Klecker1999) described the influence of basal friction on thrust generation in the Western Outer Carpathians. These authors suggested that the differences in basal friction influenced the formation of the Outer Carpathians. The models presented in this paper were simple; details of the tectonic evolution of this part of the Outer Carpathians should be investigated in successive experiments.
According to the results of the modelling, both the rectangular and triangular indenters caused the formation of experimental wedges which were more or less curved. The frontal indentation by the rectangular indenter of model 1 generated gently curved thrust traces in map-view and confirms previous experiments (e.g. Dixon & Liu, Reference Dixon, Liu and McClay1992). However, the experimental wedge in Experiment 1 was not curved enough in comparison to the real northern Outer Carpathian wedge (Fig. 8). According to literature, the wedges that were more curved were generated by indenters that had an angular outline to their leading edge (e.g. Davy & Cobbold, Reference Davy and Cobbold1988; Zweigel, Reference Zweigel1998, Lickorish et al. Reference Lickorish, Ford, Bürgisser and Cobbold2002) and the magnitude of wedge curvature depends on the magnitude of the curvature of the indenter (Marshak, Reference Marshak and McClay2004). The experimental shape of the ALCAPA block corresponded to the present southern margin of the Outer Carpathians, hence the choice of a quasi-triangular indenter shape so that the shape of the experimental wedge roughly mimics the shape of the indenter. The simple indentation of the quasi-triangular block northwards (in present geographic coordinates) produces a realistic wedge (Fig. 9a–e) and one that is roughly symmetrical, although this does not correspond to the asymmetry of the Western Outer Carpathian wedge (Fig. 12a). The two-stage model 2 (Fig. 12b) and model 3 (Fig. 15) are more suitable. However, none of these models exactly reproduces the geometry of the real orogen. In the two-stage model 2, the main thrusts were sharply terminated laterally and westwards on sinistral tear faults. In the western part of the Western Outer Carpathians, the main thrusts of the Magura and Silesian nappes were not so sharply terminated laterally on tear faults (Fig. 12a); these thrusts were possibly terminated on oblique thrusts as in model 3 (Fig. 15).
The northern Outer Carpathians were created as an accetionary prism, from hinterland to foreland, during the Late Eocene – Middle Miocene (Sarmatian) in front of the advancing ALCAPA block. The northern Outer Carpathian belt has a northwards convex outline, is asymmetric in shape and is wider at its eastern end (Fig. 1). The trend line of the basal thrusts of the main nappes is also convex to the north (with the exception of the Skole nappe which is exposed in the eastern part of the studied area).
In the fold-and-thrust model experiments reported here, wet sandy silt was used as the experimental material, a methodology based on the work of An & Sammis (Reference An and Sammis1996), Mechelen (Reference Mechelen2004) and Eisenstadt & Sims (Reference Eisenstadt and Sims2005). A suitable water content for the degree of wetness was empirically determined by repeated testing.
At the start of indenter motion for all the models, the wet sandy silt took up the strain without visibly fracturing. Such an observation is in line with the results of the previous experiments, when the wet clay was an experimental material (Eisenstadt & Sims, Reference Eisenstadt and Sims2005). The indenter movement at the start of an analogue experiment into wet clay does not cause the formation of macroscopically visible overthrusts.
The pressure of the indenter strained the experimental layer and produced a curving of the orthogonal grid in front of the moving indenter and simultaneous lateral escape of the material of the experimental layer (Figs 5b, 9b). Such an influence of the moving indenter on the foreland is less visible in experiment 3 with the rotated indenter (Fig. 13b). Latitudinal grid lines tended to compress within the experimental prism; longitudinal grid lines became curved and rotated counter-clockwise on the western part of the prism and clockwise on the eastern part, which is visible within all models.
Almost all the experimental prisms were characterized by greater or lesser rotations of the experimental material, as observed from the rotation of the grid lines. These rotations mainly depended on the magnitude of the indenter's curvature. In the model with the rectangular indenter, the rotation of the material within the experimental prism was very low and was located within the lateral ends of the frontal part of the prism. The well-marked opposite rotation of the material of the experimental wedge took place in front of the triangular indenter (Fig. 11a), suggested by the occurrence of the counter-clockwise rotation of the grid lines on the left-hand side of the indenter and the clockwise rotation on its right-hand side (in relation to the indenter's apex). Aleksandrowski (Reference Aleksandrowski1989) and Nemčok et al. (Reference Nemčok, Dilov, Wojtaszek, Ludhová, Klecker, Sercombe, Coward, Ries, Butler and Graham2007) described a fan-shaped pattern for the stress axis σ1 trajectories in the Polish part of the northern Outer Carpathian accretionary wedge (Magura and Silesian nappes).
The same phenomenon of opposite rotation of the experimental material appears in the model with rotating quasi-triangular indenter. In this case however, the counter-clockwise rotation of indenter increases the counter-clockwise rotation of the material in front of the left-hand side of the indenter, but decreases the clockwise rotation of the material in front of the right-hand side of indenter. The addition of a counter-clockwise rotation of the quasi-triangular indenter in experiment 3 therefore increased the counter-clockwise rotation of the experimental material in the western part of the experimental prism. In the eastern part of the prism however, the counter-clockwise rotation of the material (which was forced by indenter rotation) interfered with the clockwise rotation induced by having oblique indentation (Fig. 14a), reducing the amount of clockwise rotation of the experimental material within this part of wedge. Additionally, several slices seemed to be counter-clockwise rotated.
The same variability of the material rotation along the vertical axis, detected by palaeomagnetic investigation, is also observed in the northern Outer Carpathian belt. According to Grabowski et al. (Reference Grabowski, Krzemiński, Nescieruk and Starnawska2006), the amount of counter-clockwise rotation in the Silesian unit seems to decrease along-strike from SW to NE and E. Models 2 and 3 show the same trend (Figs 11, 14): the rotation value of the markers in the western part of the experimental wedge decreases along-strike from W to E up to the zone in front of the indenter apex.
Simple shearing could be inferred from rhomboid grid line development. When this occurred, the grid line rotation (Figs 5, 9, 13) cannot be simply taken as the equivalent of rotation in the real rocks as deduced palaeomagnetically.
In experiments 2 and 3 the southern slices in the central part of the experimental wedge were convexly bent to the North, and this geometry fits the Polish part of the northern Outer Carpathians. However, the main thrust in model 2 terminated westwards on tear faults. In the western part of the northern Outer Carpathians, only the trace line of the frontal thrust of the Magura nappe shows a stair-like geometry. This could mean that the Magura nappe, being the most southern/upper nappe of the studied wedge, was formed before the possible rotation of the ALCAPA block. That theory is consistent with the published information that the Magura nappe was attached to the ALCAPA block during the Oligocene (e.g. Oszczypko, Reference Oszczypko2006) and that this block started to rotate during the Miocene (e.g. Márton & Fodor, Reference Márton and Fodor2003).
The newly formed thrusts at the front of the prism in all experiments had a small curvature. The traces of thrusts dipping to the indenter were gently convex towards the foreland (e.g. Figs 9d, 13d; see the thrusts furthest from the indenter). At the beginning of the indentation, the strike of newly formed thrusts depended both on the indentation direction and the orientation of the indenter margin when indentation was oblique as in experiments 2 and 3 (Figs 9, 13). Later, the strike of new thrusts at the front of the prism was mostly dependent on indentation direction and was often not related to the shape of the indenter. As the experiments progressed, the indentation of the older innermost thrusts was accommodated to the indenter shape. The thrusts developed a greater degree of curvature within experiments 2 and 3 as compared to experiment 1 (Figs 5f, 9f, 13g). Such accommodation of the trend lines of the existing, older thrusts to the outline of the indenter has already been documented (e.g. Macedo & Marshak, Reference Macedo and Marshak1999).
The major thrusts in all models were not linear; their geometry varied along-strike (Figs 5, 9, 13) as a result of the initial formation of separate segments that subsequently became linked along-strike as shortening increased. The major forward thrusts nucleated successively in sequence, and the majority of new thrusts were perpendicular, or near-perpendicular, to the shortening direction. The oblique thrusts in the models with the quasi-triangular indenter were an exception; they were numerous particularly at the beginning of the experiment. Their orientation depends on the relation between the orientation of the indenter margin and direction of indentation; such relationships have already been documented (Doglioni, Reference Doglioni1992).
The orogen-parallel extension, manifested by stretching of the grid meshes, occurred in all experiments (Figs 5f, 9f, 13g). However, the occurrence of the tension gashes within the wedge is visible only in the case of the triangular-shaped indenter.
7. Comparison to the Western Alps
On a regional level, the main tectonic features of the northern Outer Carpathians have geometrical similarities to the Western Alps. The Western Alps developed during Cenozoic NW-directed collision of the Apulian microplate with the southwards-subducting European passive margin (Dewey et al. Reference Dewey, Pitman, Ryan and Bonnin1973; Vialon et al. Reference Vialon, Rochette, Menard, Coward, Dietrich and Park1989; Lickorish et al. Reference Lickorish, Ford, Bürgisser and Cobbold2002). Within the external Western Alps, two regional arcuate systems are distinguishable (Lickorish et al. Reference Lickorish, Ford, Bürgisser and Cobbold2002): (1) the structures of the Helvetic–Dauphinois zones, which form the older (Eocene–Miocene) internal and principal part of the Western Alps; and (2) the arcuate Jura arc and the Digne thrust, which form the younger (Miocene–Holocene) external part of this orogen. The internal Helvetic–Dauphinois system extends along the whole of the Western Alps, whereas the Jura belt is located at the right-hand side of this part of the Alps. The relative geometrical position of the Jura belt in relation to the Apulian microplate suggests a similarity to the position of the Skole nappe in the Western Outer Carpathians in relation to the ALCAPA block. A comparison of the Western Alps and the northern Outer Carpathians suggests that the Apulian microplate was more curved than the ALCAPA block, as the principal Western Alpine arc developed in two orthogonal and synchronous branches (Lickorish et al. Reference Lickorish, Ford, Bürgisser and Cobbold2002). According to Lickorish et al. (Reference Lickorish, Ford, Bürgisser and Cobbold2002), from the Eocene to the Early Miocene the Apulian microplate moved along a slightly diagonal path with respect to the European margin. In the Middle Miocene, it then moved by counter-clockwise rotation of c. 10–15° along a curved path.
8. Conclusions
The experiments described here suggest that it is possible to reproduce the large-scale structures of the northern Outer Carpathians in two different ways using a quasi-triangular indenter: (1) in two successive directions varied by c. 45°, first to the north (in the present geographic coordinates) and then to the northeast; and (2) in one direction, to NE but with a simultaneous counter-clockwise rotation of c. 60°. Model 3, which incorporated counter-clockwise rotation of the indenter, produced results most similar to the northern Outer Carpathians.
The wet sandy silt used as experimental material meant that the influence of the indenter displacement was well-marked far outside the experimental prism. The pressure of the indenter strained the experimental layer and produced a curving of the orthogonal grid in front of the moving indenter and simultaneous lateral escape of the material in experiments 1 and 2 (Figs 5b, 9b). Such influence of the moving indenter on the foreland is less visible in experiment 3 with rotating indenter (Fig. 13b).
Rotation effects within the sandy silt experimental wedges were easily visible when the shape of the indenter was triangular. However, the occurrence of simple shearing means that the amount of experimental rotation and the amount of rotation in the actual orogen cannot be directly correlated. Counter-clockwise rotation of the indenter influences the model by increasing the counter-clockwise rotation of the slices in the western part of the experimental wedge and decreasing the clockwise rotation of the slices in its eastern part. When the amount of indenter rotation is large enough, the slices in the eastern part of the final model are also rotated counter-clockwise.
The results of the indentation modelling suggest that the orientation of the trace line of newly formed thrusts depends mostly on the indentation direction. At the start, all the thrusts (which dipped to the hinterland) were gently curved and were convex towards the foreland. When the indenter had straight margins the thrust traces became less curved, but when the indenter had a quasi-triangular shape the thrust traces became more curved because they accommodated more to the curvature of the indenter margin.
All three experiments produced a stack of scales equivalent to the development of an accretionary prism (Figs 5, 9, 13). The outline of all models was curved and this curvature depended principally on the curvature of the indenter. The least-curved model resulted from a rectangular-shaped indenter (Fig. 5f), while the most-curved model resulted from the use of the quasi-triangular-shaped indenter (Figs 9f, 13g). The quasi-triangular indenter produced a sufficiently curved experimental prism (model 2 and 3) to be comparable to that of the northern Outer Carpathians (Figs 12, 15), including the degree of prism asymmetry. Model 3 however, which incorporated indenter rotation, seemed to produce results most similar to the northern Outer Carpathians (Fig. 15).
According to the results of the experiments described here, the northern Outer Carpathians started to form when the ALCAPA block was moving approximately to the north (in relation to present position of the ALCAPA block) and had no significant rotation. The stair-like outline of the frontal thrust of the western part of Magura nappe suggests the occurrence of oblique thrusts or tear faults. Such faults were rare in the western part of the model when the indenter was rotated. The deformational front was later shifted to the Silesian nappe and the ALCAPA block started its counter-clockwise rotation during this time. This rotation probably finished with the formation of the Skole nappe.
Acknowledgements
This work was supported by the Ministry of Science and Higher Education (grant number NN 525363637) and the Institute of Geological Sciences, Polish Academy of Sciences (Karpaty, INGPAN). I would like to thank Tadeusz Kawiak (Institute of Geological Sciences, Polish Academy of Sciences) for mineral identifications, Dorota Bakowska and Małgorzata Zielińska (Institute of Geological Sciences, Polish Academy of Sciences) for measuring the density and water contents and Jacek Dąbrowski and Aleksandra Borecka (AGH University of Science and Technology, the Faculty of Geology, Geophysics and Environmental Protection) for analysing the mechanical and physical properties of the modelling material. I also thank anonymous reviewers for their constructive comments.



