I. INTRODUCTION
Nanocluster production using inert gas condensation technique has become progressively popular for both basic and applied fields of material science. This technique represents a novel method for nanocluster production since it allows fine-tuning of nanocluster size, composition, as well as structure.Reference Yamamuro, Sumiyama, Sakurai and Suzuki1 In addition, size selection of nanoclusters is possible since they are produced unsupported and mostly ionized.Reference Ayesh, Qamhieh, Ghamlouche, Thaker and EL-Shaer2 Therefore, nanoclusters with particular sizes can be used as building blocks to generate self-assembled nanocluster devices.Reference Ayesh3 Herein, a material is vaporized and the vapor meets a cooling inert gas that decreases the temperature of the vapor rapidly leading to a high supersaturation causing vapor nucleation and nanocluster formation. The source material can be vaporized by various methods including Joule heating, thermal plasma, laser ablation, and sputtering.
Since the introduction of a nanocluster source that combines sputtering and inert gas condensation by Haberland et al.,Reference Haberland, Karrais, Mall and Thurner4 various modifications were introduced as nanocluster sources to optimize the size and yield of the produced nanoclusters. This technique is highly versatile for material production since most metals and semiconductors can be sputtered using direct current (DC) or radio frequency (RF) sputtering regardless of their melting temperatures. In addition, many unique advantages are associated with this technique such as generation of nanoclusters without passivation layers, since they are produced inside a vacuum chamber, and production of nanoclusters with designated compositions by controlling the composition of the sputtering target.
In the recent decades, numerous research groups described the fabrication of nanoclusters using sputtering and inert gas condensation technique.Reference Sánchez-López and Fernández5 Nevertheless, only a few reports were published on nanocluster formation mechanisms.Reference Lehtinen and Kulmala6 Nanocluster production using inert gas condensation is still unoptimized, thus far from large-scale production, which increases the cost of their use for commercial applications.Reference Simchi, Ahmadi, Seyed Reihani and Mahdavi7 Understanding the role of the parameters of a nanocluster source and their correlation with the nanocluster formation mechanisms is essential to provide optimum control of nanocluster size and yield.
Titanium (Ti) and its oxide have various applications, especially in the fields of solar cells and environmental purification.Reference Ikezawa, Homyara, Kubota, Suzuki, Koh, Mutuga, Yoshioka, Nishiwaki, Ninomiya, Takahashi, Baba, Kida, Hara and Famakinwa8 For example, TiO2 exhibits strong oxidation and reduction abilities when irradiated with light with energy larger than its band gap. Therefore, TiO2 is used for environment purification applications such as purification of air and water, and degradation of hazardous volatile organic and malodorous compounds.Reference Liqiang, Xiaojun, Weimin, Zili, Yaoguo and Honggang9 Ti nanoclusters fabricated in this work oxidize naturally once they are removed outside the vacuum system, and thus, they can be used for the above applications.
This work discusses the effect of the nanocluster source parameters (inert gas flow rate, aggregation length, and sputtering discharge power) on Ti nanocluster size and yield. The experimental results are compared with a theoretical model for nanocluster production based on three-body collision. The produced results provide a clear insights about the formation mechanisms of Ti nanoclusters formation.
II. EXPERIMENTAL
Ti nanoclusters were produced inside an ultrahigh vacuum (UHV) compatible system using magnetron plasma sputtering and inert gas aggregation condensation.Reference Ayesh, Thaker, Qamhieh and Ghamlouche10 The system was initially pumped down to a base pressure of ∼10−8 mbar. The nanoclusters were initially produced inside the source chamber, then they travel through a quadrupole mass filter (QMF) for measuring their size distribution, and finally they form a nanocluster beam inside the main chamber and are deposited on a suitable substrate. A schematic diagram of the UHV system and nanocluster source is shown elsewhere.Reference Ayesh, Thaker, Qamhieh and Ghamlouche10 A Ti metal target with a purity of 99.99% was fixed on the sputter head and utilized to generate nanoclusters using a variable discharge power (P). The sputter head as well as the source chamber jacket were water-cooled at room temperature. Argon (Ar) inert gas with a purity of 99.999% was used to generate the plasma, sputter Ti, and to establish the inert gas condensation inside the source chamber. The inert gas flow rate (f Ar) was controlled using a mass flow controller (MKS Instruments, Andover, MA1810, USA) in the range of 0.0–100.0 (±0.5) sccm. The gas stream sweeps the nanoclusters outside the source chamber into the main chamber through two nozzles (5- and 6-mm diameters in order) at the exit of the source chamber, where the nanocluster growth is stopped. Nanoclusters were then deposited on a substrate mounted on a sample holder facing the nanocluster beam. A quartz crystal monitor (QCM) was used to measure the nanocluster deposition rate, where the QCM is fixed on a motorized linear translator that enables driving the QCM facing the nanocluster beam, checking the deposition rate, and then driving it back away from the beam path. The aggregation length (L), defined as the distance from the surface of the sputtering target to the source exit nozzle, was controlled by a motorized linear translator which drives the sputter head by up to 100 mm without venting the source chamber.
The QMF was used to measure the nanocluster size distribution in situ inside the vacuum system directly after their production in the source chamber and before deposition inside the main chamber.Reference Ayesh, Qamhieh, Ghamlouche, Thaker and EL-Shaer2 The QMF consists of four parallel metal rods, where each opposing rod pair is electrically connected together. Since the majority of the produced nanoclusters are ionized, the mass selection inside the QMF was realized by applying potentials of +(U + V cos(ωt)) and −(U + V cos(ωt)) on each pair of rods, where U is a DC voltage and V cos(ωt) is an AC voltage. The resolution of the mass filter can be adjusted for mass scan by setting the U/V ratio up to 0.168. A grid (Faraday cup) located at the exit of the mass filter was used to measure the ion flux (frequency) of the size-selected nanoclusters, and the current (I) was measured by a picoammeter. Thus, I (nA) will be used in the text below to represent the frequency of the produced nanoclusters. The nanocluster size distribution was also measured from TEM images obtained using a Philips CM10 transmission electron microscope (TEM).
III. RESULTS AND DISCUSSION
Figure 1(a) depicts a TEM image of Ti nanoclusters produced using f Ar = 50 sccm, L = 70 mm, and P = 49 W. A comparison between nanocluster size distributions measured using QMF (solid line) and TEM image (open symbols) is presented in Fig. 1(b), which reveals a reasonable agreement between nanocluster size distribution measured by the TEM images and QMF. Inert gas condensation source provides a flexible tool of controlling the size and yield of nanoclusters by controlling the different source parameters. It is reasonable to start the work by testing the QMF performance used to measure nanocluster size distribution. Figure 2(a) shows the size distributions measured at different mass filter resolutions and using L = 70 mm, f Ar = 40 sccm, and P = 49 W. The figure shows that increasing U/V reveals extra peaks (local maxima) in the size distribution curves but decreases the number of nanoclusters detected by the mass filter. However, the average nanocluster size remains constant. A U/V ratio of 0.1 allows the detection of a reasonable amount of nanoclusters while maintaining the general features of the size distribution, and thus, it was fixed as a constant in the other experiments of the present work.
(a) TEM image of Ti nanoclusters, and (b) comparison between nanocluster size distributions measured using QMF (solid line) and TEM image (open symbols). The nanoclusters were produced using f Ar = 50 sccm, L = 70 mm, P = 49 W, and U/V = 0.1.

Figure 2(b) shows the effect of inert gas flow rate on nanocluster size distribution. This figure shows that increasing the inert gas flow rate decreases the average nanocluster size. However, the nanocluster yield (area under the size distribution curves) initially increases then decreases with increasing the inert gas flow rate. The area under a size distribution curve indicates the number of nanoclusters produced inside the source and detected by the Faraday cup, and thus, “nanocluster yield” will be used in the following text to indicate the area under each nanocluster size distribution curve.
The effect of changing the aggregation length on nanocluster size distribution is revealed in Fig. 2(c), which shows that increasing the aggregation length increases the nanocluster average size and decreases their yield. Figure 2(d) shows the effect of controlling the sputtering discharge power on the nanocluster size and yield. The average nanocluster size increases and then decreases with increasing the sputtering discharge power. A similar trend can be observed for the nanocluster yield.
Nanocluster size distributions produced by varying (a) mass filter resolution, U/V, (herein L = 70 mm, f Ar = 40 sccm, and P = 49 W) (b) inert gas flow rate, f Ar, (herein L = 100 mm, and P = 49 W) (c) aggregation length, L, (herein f Ar = 30 sccm, and P = 49 W) and (d) power, P, (herein L = 70 mm, and f Ar = 40 sccm).
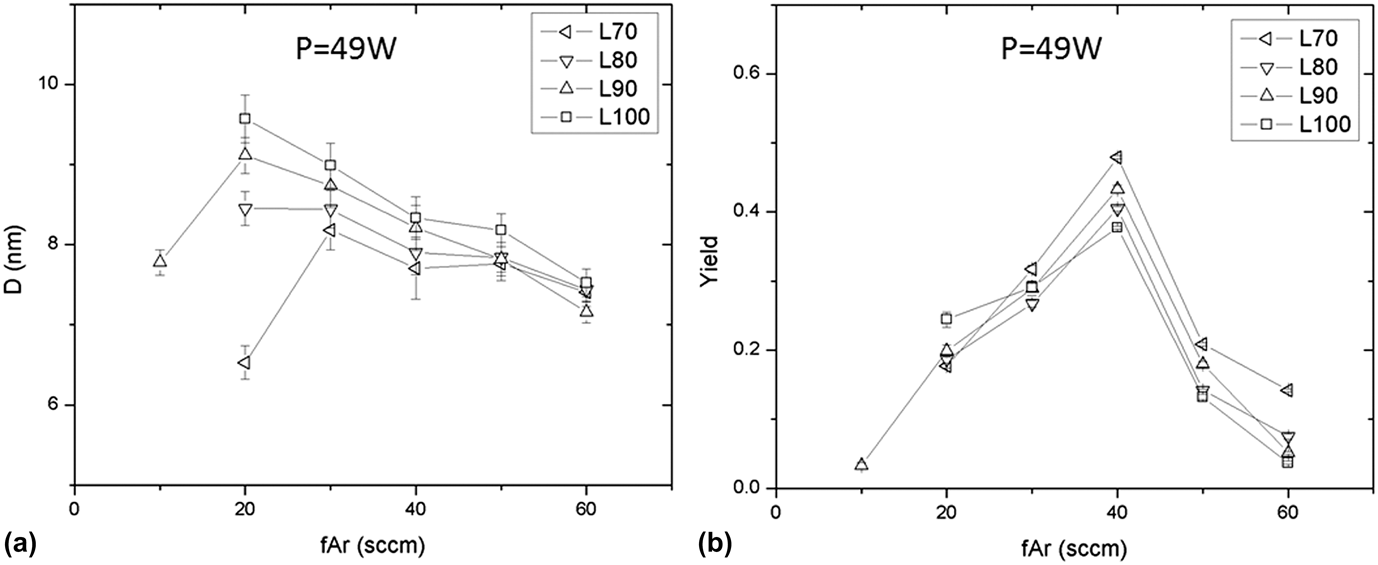
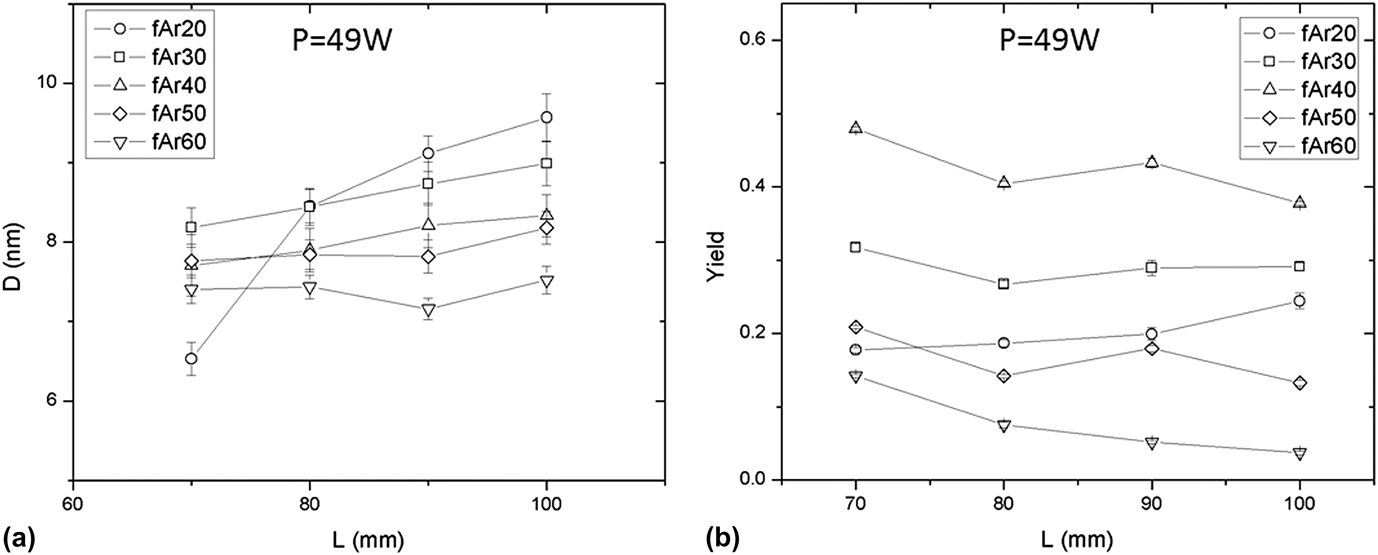
In order to further investigate the effect of the three variables (f Ar, L, and P) on the average nanocluster size and yield, systematic measurements of the nanocluster size distributions as a function of the above variable were performed. For each size distribution curve, (at given f Ar, L, and P), statistical analyses were performed using origin software to determine the average nanocluster size (D). In addition, the integral of each curve was calculated and used to represent the nanocluster yield. Those results were used to generate the figures below of (Figs. 3–5) nanocluster size and yield dependence on the source variables.
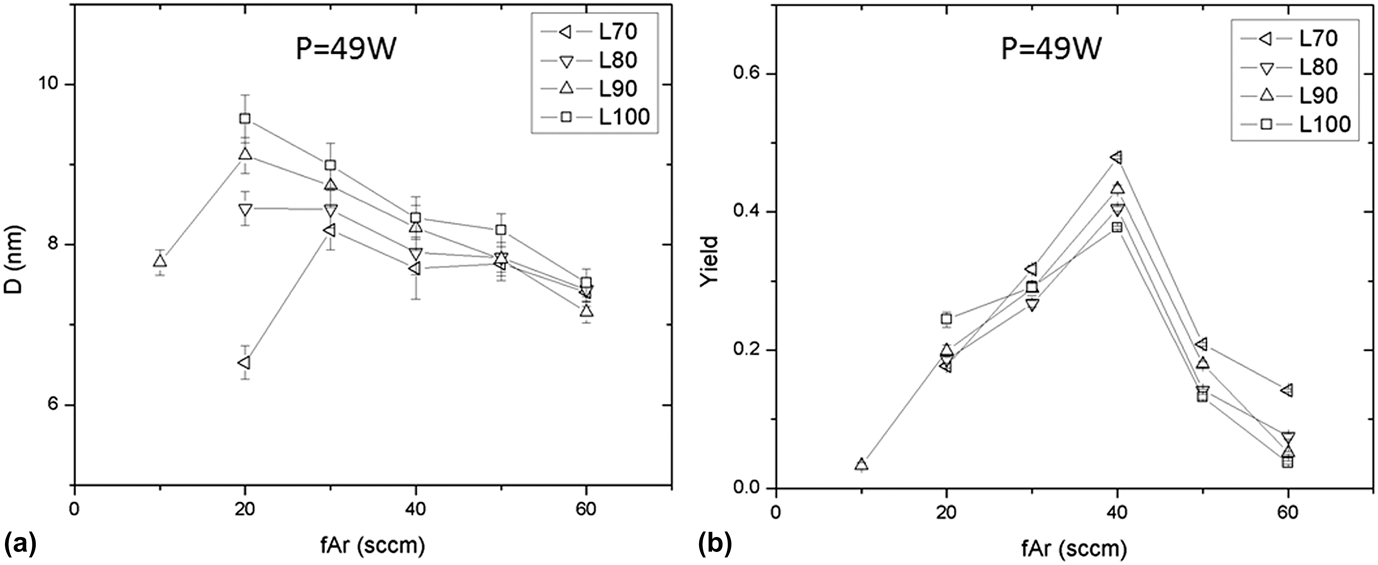
Dependence of nanocluster size (a) and yield (b) on the inert gas flow rate at different aggregation lengths and fixed L of 49 W.
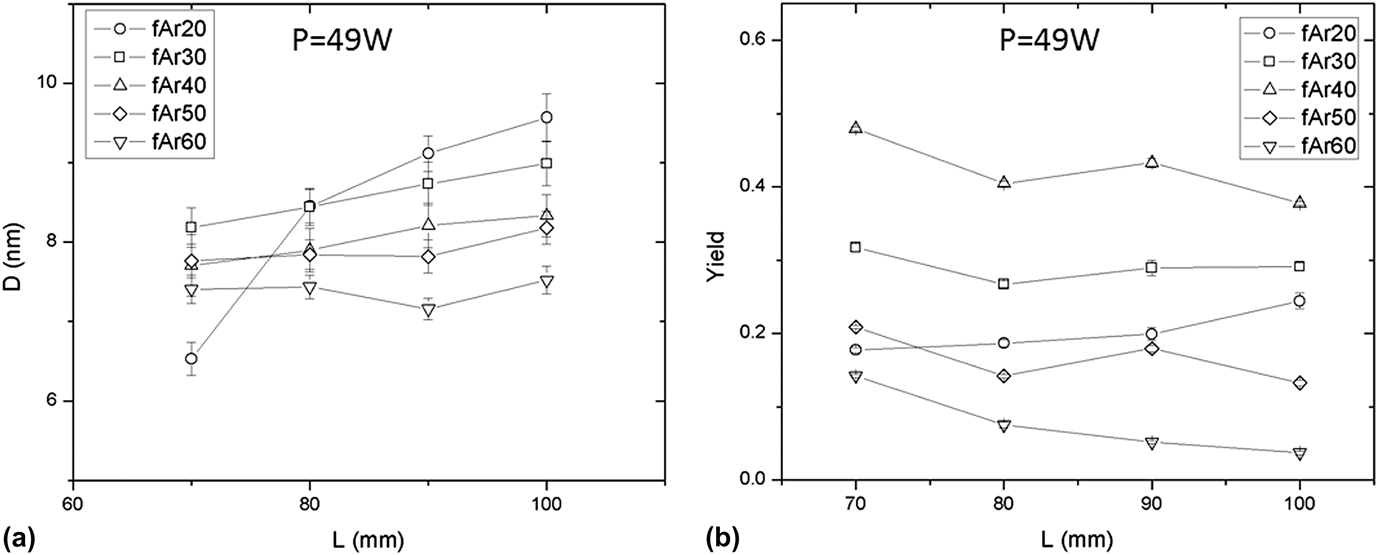
Dependence of nanocluster size (a) and yield (b) on the aggregation lengths at different inert gas flow rates and fixed P of 49 W.
Dependence of nanocluster size and yield on the sputtering discharge power at L = 70 mm and f Ar = 40 sccm.
The dependence of the nanocluster average size on the inert gas flow rate for different aggregation lengths is shown in Fig. 3(a). The figure reveals that, in general, the average nanocluster size decreases as the inert gas flow rate increases. However, for L = 70 and 90 mm, D initially increases with f Ar (at low inert gas flow rate) and then it decreases. Each error bar shown in Fig. 3(a) represents one standard deviation of the size distribution curve. The small standard deviation indicates that narrowly size nanoclusters are formed.
The variation of D as a function of inert gas flow rate can be explained by considering the type of collision involved in nanocluster production as well as the role of inert gas inside the nanocluster source where nanocluster formation processes are disturbed in the gas stream. Two types of collisions are involved in nanocluster nucleation and growth: three-body and two-body collisions. The three-body collision occurs between two sputtered atoms (or small nanoclusters) and an Ar atom that removes the excess kinetic energy of the sputtered atoms/nanoclusters. This collision process is essential for nanocluster seed production from the sputtered atoms. The collision probability is determined by the sputtered material density and the nucleation and growth times. Herein, increasing f Ar increases the drift velocity of the material and decreases the nucleation and growth times, and thus, nanocluster size is expected to decrease as f Ar increases.Reference Yamamuro, Sumiyama, Sakurai and Suzuki1,Reference Ayesh, Qamhieh, Mahmoud and Alawadhi11 Nanoclusters grow further by two-body collision that might include nanocluster–atom (atomic condensation) and nanocluster–nanocluster collisions.Reference Banerjee, Krishna and Das12–Reference Hihara and Sumiyama14 This type of collision is likely to occur at low inert gas flow rate, where increasing f Ar decreases the mean-free-path which increases the probability of collision and thus promotes nanocluster growth.Reference Yamamuro, Sumiyama, Sakurai and Suzuki1 Consequently, the dependence of D on f Ar shown in Fig. 3(a) can be explained as follows. The increase of D with f Ar observed at L = 70 mm for f Ar below 30 sccm and L = 90 mm for f Ar below 20 sccm could be attributed to the dominance of the two-body collision mechanism. Nevertheless, the decrease in D with f Ar at faster inert gas flow rates and longer aggregation lengths indicates the dominance of the three-body collision mechanism.
Figure 3(b) shows the dependence of nanocluster yield on the inert gas flow rate at P = 49 W and various values of L. It is clear that nanocluster yield increases with f Ar and then decreases with a maximum yield at f Ar = 40 sccm and L = 70 mm. The maximum yield occurs at an intermediate value in terms of f Ar which defines the time of nanocluster nucleation and growth. At f Ar < 40 sccm, nanocluster production is promoted by two-body (atomic condensation) and three-body collisions since the mean-free-path is small at low inert gas flow rates, which increases the probability of collisions. At f Ar > 40 sccm, increasing f Ar decreases the nanocluster nucleation and growth times, which decrease the number of produced nanoclusters. This result is consistent with the results shown in Fig. 3(a) and agrees with our previous work on other metallic nanoclusters like SnCu.Reference Ayesh, Qamhieh, Mahmoud and Alawadhi11
The dependence of nanocluster average size on the aggregation length measured at P = 49 W and different inert gas flow rates is shown in Fig. 4(a). The figure reveals that the average nanocluster size increases with increasing the aggregation length. The direct increase of D with L is a result of the increase in nanocluster nucleation and growth times. The volume of the aggregation region increases with increasing the aggregation length, and thus, nanocluster size increases since they remain longer within the aggregation region. Figure 4(b) shows the dependence of nanocluster yield on the aggregation length. The figure illustrates that the yield is constant with the aggregation length. This could be a result of the compromise between the production of new nanoclusters by three-body collision and nanocluster consumption by two-body (nanocluster–nanocluster) collision, as the nucleation and growth times increase when L increases. This also can be used to explain the slight increase in D with L in Fig. 4(a) since nanocluster growth will be reduced by the production of new nanoclusters with increasing L.
Figure 5 shows the dependence of nanocluster size and yield on the sputtering discharge power measured at L = 70 mm and f Ar = 40 sccm. Both size and yield of nanoclusters increase with the increase of the discharge power and reach a maximum at P ≈ 63 W, then decrease. Nanoclusters could not be produced at discharge powers below 33 W or above 75 W. The sputtering discharge power controls plasma generation as well as the amount of material sputtered from the target, and thus it is a main factor affecting production and growth of nanoclusters. Herein, nanoclusters can be detected within an optimum range of the discharge power. Nanoclusters cannot be detected when insufficient sputtering discharge power is applied since such a power would not produce sufficient self-bias to the target.Reference Ayesh, Qamhieh, Ghamlouche, Thaker and EL-Shaer2 Therefore, nanocluster production is limited by a minimum sputtering discharge power to initiate the three-body and two-body collisions depending on the target material. In addition, applying a discharge power higher than the maximum of a particular target leads to instability of the plasma, hence, intermittent nanocluster production.Reference Pratontep, Carroll, Xirouchaki, Streun and Palmer15 Thus, the maximum nanocluster size and yield at 63 W is a result of applying the optimum discharge power that produces maximum amount of the sputtered material.
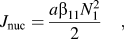
As the three-body collisions are a major mechanism for nucleation and growth of Ti nanoclusters, a modelReference Lushnikov and Kulmala16,Reference Lehtinen, Backman, Jokiniemi and Kulmala17 was used to verify our experimental results. A nanocluster seed can be formed due to a collision between two material atoms/clusters with a third participant (i.e., inert gas atom) to satisfy energy and momentum conservation. The nucleation rate (J nuc) resulting from a collision between two monomers and a gas atom can be written as:
 $${J_{{\rm{nuc}}}} = {{a{{\rm{\beta }}_{11}}N_1^2} \over 2}\quad ,$$
where a is a correction factor that is related to the probability of collision, β11 is the collision frequency function, and N 1 is the number concentration of monomers. Herein, the dynamics of the process can be described by a discrete coagulation schemeReference Lehtinen and Kulmala6,Reference Fuchs, Sutugin, Hidy and Brock18 :
 $${{{\rm{d}}{N_1}} \over {{\rm{d}}t}} = - 2{J_{{\rm{nuc}}}} - {N_1}\mathop\sum\limits_{i = 2}^\infty {{{\rm{\beta }}_{1i}}{N_i} - {R_1}} \quad ,$$
 $${{{\rm{d}}{N_2}} \over {{\rm{d}}t}} = - 2{J_{{\rm{nuc}}}} - {N_2}\mathop\sum\limits_{i = 1}^\infty {{{\rm{\beta }}_{2i}}{N_2}{N_i} - {R_2}} \quad ,$$
 $${{{\rm{d}}{N_k}} \over {{\rm{d}}t}} = {1 \over 2}\mathop\sum\limits_{i = 1}^{k - 1} {{{\rm{\beta }}_{i,k - i}}{N_i}{N_{k - i}}} - {N_k}\mathop\sum\limits_{i = 1}^\infty {{{\rm{\beta }}_{1k}}{N_i} - {R_k}} {\rm{(}}k > 2{\rm{)}}\quad ,$$
where the first class of Eqs. (2a), (2b), and (2c) represents molecules, whereas the second the smallest stable nanoclusters with a nucleation rate of J nuc. R k is the removal by deposition to the walls of the source.Reference Jokiniemi, Lazaridis, Lehtinen and Kauppinen19 The parameters a, β11, and R k were calculated as described elsewhere.Reference Lehtinen, Backman, Jokiniemi and Kulmala17
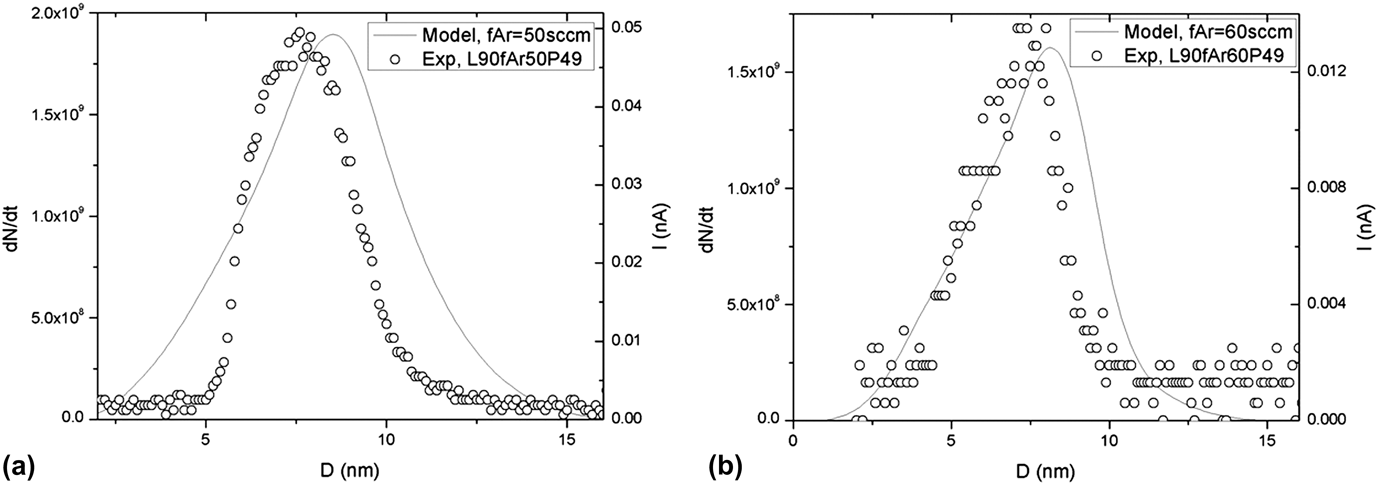
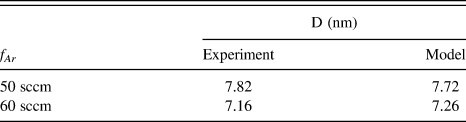
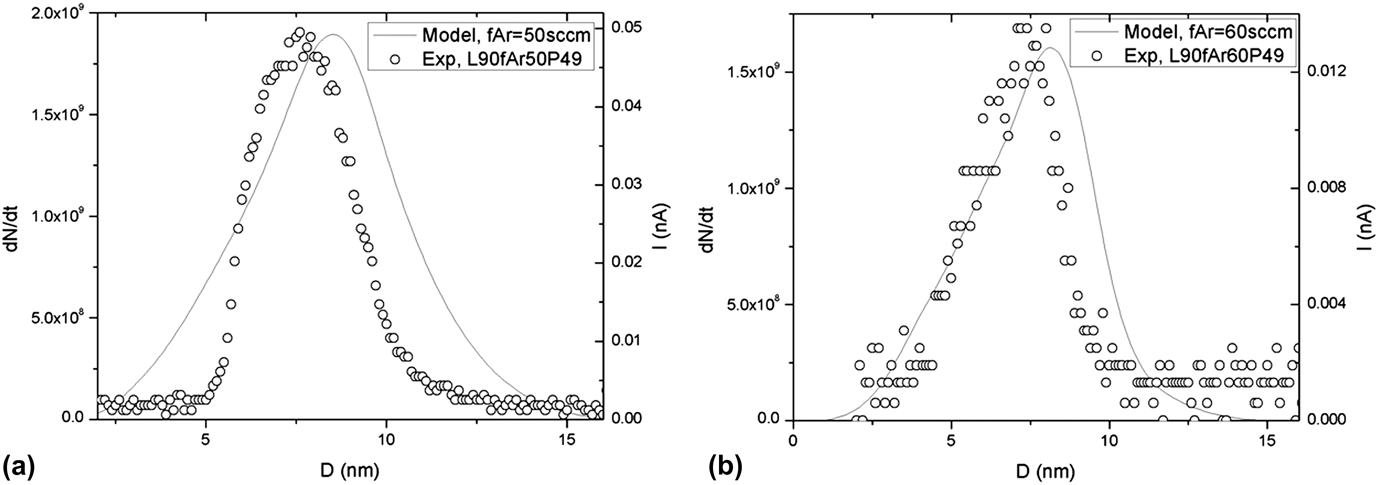
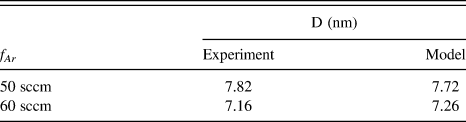
Figure 6 compares the model and experimental size distributions measured at L = 90 mm and P = 49 W, and argon flow rates of (a) 50 sccm and (b) 60 sccm. The model results were plotted using Eqs. (1) and (2a) using a fitting parameter of a = 4 × 10⁻⁷. The model demonstrates that increasing the inert gas flow rate from 50 to 60 sccm decreases both nanoclusters yield (i.e., the area under the size distribution curve) and average nanocluster size. Those results are qualitatively consistent with the experimental results. Table 1 reveals a comparison of the average nanocluster size as determined using the model and experiment. The figure and table demonstrate a fair agreement with the model; however, the model produces wider distributions. The discrepancy between the model and the experiment is understandable since the model is applied in one dimension during the growth of nanoclusters, whereas in the experiment, the produced size distribution of nanoclusters is a collection from various streamlines.
Comparison between nanocluster size distributions produced experimentally (open symbols) and using the three-body collision model (solid lines) at (a) L = 90 mm, P = 49 W, and f Ar = 50 sccm; and (b) L = 90 mm, P = 49 W, and f Ar = 60 sccm.
Comparison between the nanocluster sizes determined using the experiment and the model (Eqs. 1 and 2a).
IV. CONCLUSION
Size-selected titanium (Ti) nanoclusters were fabricated using sputtering and inert gas condensation inside an UHV compatible system. The size and yield of nanoclusters could be tuned by controlling the nanocluster source parameters: inert gas flow rate, length of the aggregation region, and sputtering discharge power. Detailed measurements showed that the three-body collision mechanism is a dominant mechanism for the formation of Ti nanoclusters produced in this work. The experimental results were compared with a theoretical model that describes nanocluster formation and growth using three-body collision. Both model and experiments showed that the inert gas flow rate is a primary factor determining the nanocluster size and yield.
ACKNOWLEDGMENTS
This work was supported by Emirates Foundation (United Arab Emirates) under Grant Ref. No. 2011/177 and United Arab Emirates University under grant code G00000840. The authors would like to thank Mr. S. Tariq at FMHS (United Arab Emirates University) for the TEM images.