Introduction
Bulk chalcogenide glasses have received extensive attention as the best material candidate for application to infrared optical instruments, such as night vision and surveillance cameras, because of their superior infrared transmission, mass productivity, mold formability, and low-cost raw materials [Reference Sanghera, Shaw and Aggarwal1, Reference Bureau, Zhang, Smektala, Adam, Troles, Ma, Boussard-Plèdel, Lucas, Lucas, Coq, Riley and Simmons2, Reference Zhang, Bureau, Lucas, Boussard-Pledel and Lucas3]. In addition to chalcogenide glasses, recently, chalcohalide glasses that are composed of chalcogenides with the incorporation of halides except fluorides have become increasingly interesting. The incorporation of halides expands the glass-forming regions of the chalcogenide glasses without deterioration of their excellent infrared transmissivity and any shift of the absorption edge at the long (infrared) wavelength side [Reference Le Toullec, Christensen and Lucas4, Reference Sanghera, Heo and Mackenzie5, Reference Tver’yanovich, Nedoshovenko, Aleksandrov, Turkina, Tver’yanovich and Sokolov6]. Furthermore, significant variations in various properties of the chalcogenide glasses are expected, e.g., thermophysical and optical properties, such as the glass transition temperature, thermal expansion coefficient, energy of the absorption edge at the short-wavelength side, and refractive index [Reference Calvez, Ma, Lucas and Zhang7, Reference Ledemi, Amraouri and Messaddeq8, Reference Bréhault, Calvez, Adam, Rollin, Cathelinaud, Fan, Merdrignac-Conanec, Pain and Zhang9, Reference Kuroda, Okumura, Fujiwara, Wakasugi and Kadono10, Reference Ashida, Wakasugi, Okada and Kadono11, Reference Qiu, Yang, Zhang, Li, Zhang, Tang and Yang12, Reference Zhang, Yang, Zhao, Yang, Li and Tao13, Reference Ashida, Okada, Wakasugi and Kadono14]. These variations probably originate from differences between chalcogen and halogen elements in electronegativity, polarizability, and valence of the anions, whereas the anion sizes of the same period are close [Reference Frederikse15]. However, systematic investigations of the effects of halide incorporation on the properties of the chalcohalide glasses are limited.
We prepared sulfide chloride glasses based on two compounds selected from Ga2S3, GeS2, and Sb2S3, and with incorporated CsCl. An excess sulfur was incorporated into the base sulfide components to investigate the nonstoichiometric glasses. In addition to the basic properties, including the absorption spectra, we investigated the photodoping behavior of silver in the prepared bulk glasses. Photodoping is one of the most interesting and investigated phenomena among the photoinduced effects in amorphous chalcogenides [Reference Tanaka and Shimakawa16]. However, few studies exist on photodoping into bulk chalcogenide glasses, and no studies have used bulk chalcohalide glasses to the best of our knowledge [Reference Tanaka17, Reference Kitagawa, Takebe and Kuwabara18, Reference Terakado and Tanaka19, Reference Kadono, Fujiwara, Takahiro and Wakasugi20].
Results
Glass preparation and basic glass properties
Table I shows the glass transition temperatures, densities, and absorption edges of transparent glasses with various compositions. The compositions are represented by 100 mol% stoichiometric sulfides (basic composition), and the mol% of excess sulfur and additive CsCl incorporated into the basic composition. Hereafter, compositions are abbreviated as 80Ge–20Sb–40S–10CsCl for 80GeS2·20SbS3/2·40S·10CsCl. The appearance of these glasses is shown in Table I.
Glass composition, transition temperature, density, and absorption edge at the short-wavelength side, and appearance of the prepared glasses.
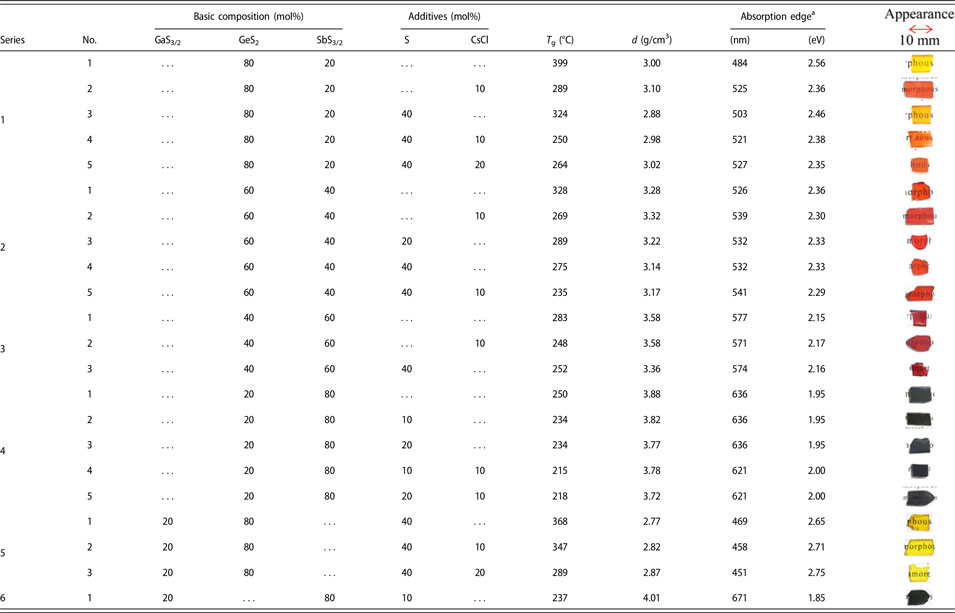
a Wavelength and energy where the absorbance [ln(T/100), where T is transmittance (%)] reaches 5.
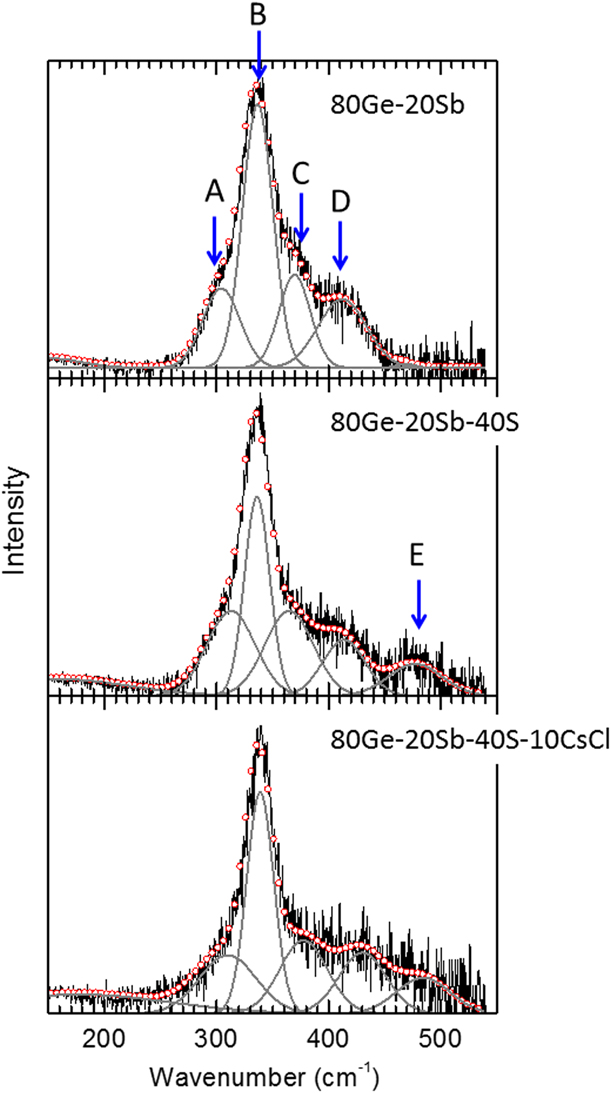
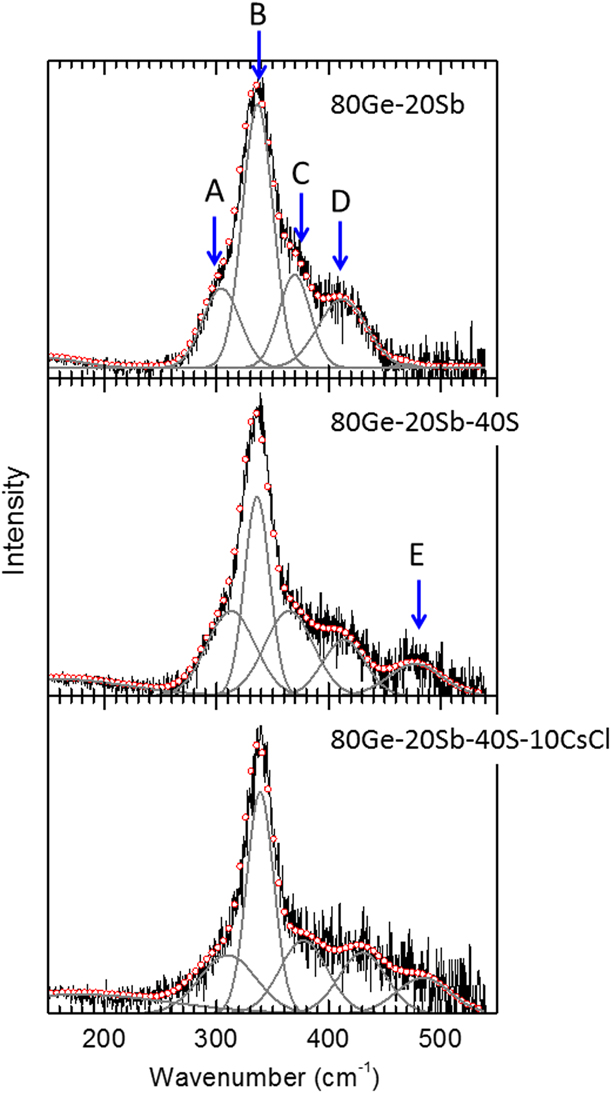
The structures of sulfide glasses can be considered analogues of oxide glasses that consist of network formers and modifiers. Glasses based on Ga2S3, GeS2, and Sb2S3 are considered to consist of network-forming units, GaS4 and GeS4 tetrahedra, and an SbS3 pyramid, connected by corner- and edge-sharing [Reference Kawamoto and Tsuchihachi21, Reference Higuchi, Kanno, Kawamoto, Takahashi and Kadono22, Reference Song, Choi and Heo23]. Figure 1 shows the Raman spectra of the glasses based on the GeS2–Sb2S3 system; these spectra were obtained from the measured spectral data that are shown in Fig. S1 in the Supplementary material to correct thermal population effect by the following equation [Reference Kobliska and Solin24, Reference Lucovsky, Galeener, Keezer, Geils and Six25]:
 $${I_{\rm{R}}}\left( \nu \right) = \nu {\left( {{\nu _{\rm{i}}} - \nu } \right)^{ - 4}}\left\{ {1 - \exp \left( {{{h\nu } \!\left/{\vphantom{{h\nu } {kT}}}\right.{kT}}} \right)} \right\}I\left( {\nu ,T} \right)\quad ,$$
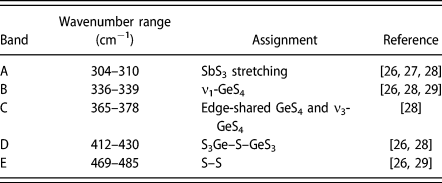
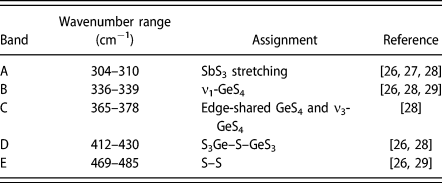
where νi is the wavenumber of the incident laser photon, νs = νi − ν is that of the scattered light, and I(ν, T) is the intensity of the measured Raman spectra. The Raman spectra were decomposed into five bands, as shown in Fig. 1. Among them, four bands (A, B, C, and D), except for the fifth band of the highest wavenumber (E), are assigned to stretching modes related to the GeS4 and SbS3 structures, as summarized in Table II [Reference Frumarová, Němec, Frumar, Oswald and Vlček26, Reference Watanabe, Noguchi and Shimizu27, Reference Heo, Yoon and Ryou28, Reference Koudelka, Frumar and Pisárčik29]. The fifth band E is assigned to the S–S stretching vibration, and the intensity increased with the incorporation of excess sulfur, as shown in Fig. 1. Halides with more ionic bonds than those of the sulfides play a role of modifier as follows: The halide ions bind to the glass-forming cations and make non-bridging sulfide ions, which results in an interruption in network connectivity.
Raman spectra for GeS2–Sb2S3-based glasses. These spectra were obtained from the measured spectral data that are shown in Fig. S1 in the Supplementary material to correct thermal population effect. The spectra were decomposed into five bands by curve fitting, and the assignments of these bands are shown in Table II. Fitting curves and five bands are shown with red circles and gray solid lines, respectively. Between these glasses, Ag photodoping occurred most easily for the 80Ge–20Sb–40S glass and the order of the doping rate was (80Ge–20Sb–40S) > (80Ge–20Sb–40S–10CsCl) > (80Ge–20Sb) (see text in detail).
Assignment of bands obtained for peak decomposition of Raman spectra of 80Ge–20Sb glass and glass incorporated with S and CsCl [Reference Frumarová, Němec, Frumar, Oswald and Vlček26, Reference Watanabe, Noguchi and Shimizu27, Reference Heo, Yoon and Ryou28, Reference Koudelka, Frumar and Pisárčik29].
This simple model provides an understandable explanation of the compositional dependences of various glass properties. As shown in Table I, the incorporation of excess sulfur into the glasses with stoichiometric compositions decreased the glass transition temperatures. This results from the decrease in average coordination number of the glass network because the excess sulfur forms S–S homobonds. The incorporation of CsCl decreased the transition temperatures because of the role of CsCl as the glass modifier.
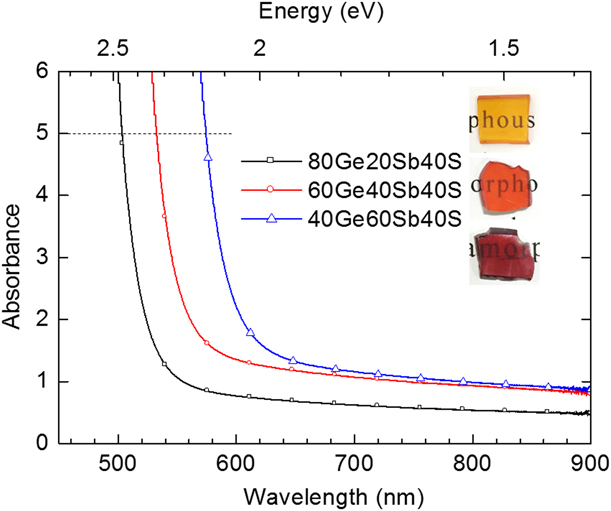
The absorption spectra of the GeS2–Sb2S3 glass with excess sulfur are presented in Fig. 2 to show the variation in absorption edge with the ratio of Sb to Ge. Variations in the absorption edge in the other glasses with different compositions are shown in Figs. S2–S4 in the Supplementary material. The absorption edges shifted to the long-wavelength direction with an increase in the Sb content (compare glasses #1–3, #2–4, and #3–3 in Table I). This trend is the same as that for the stoichiometric GeS2–Sb2S3 glasses without excess sulfur, i.e., the 80Ge–20Sb, 60Ge–40Sb, 40Ge–60Sb, and 20Ge–80Sb glasses (compare glasses #1–1, #2–1, #3–1, and #4–1 in Table I).
Absorption spectra of GeS2–Sb2S3 glass with excess sulfur showing variation in absorption edge with the ratio of Sb to Ge. The symbols (squares, circles, and triangles) are only to distinguish the lines each other. Absorption edge determined as the wavelength where the absorbance reaches 5 as shown by the dashed line (see the text).
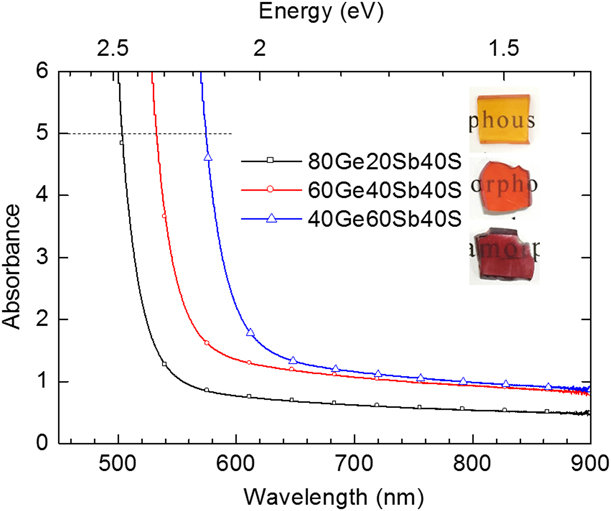
An incorporation of excess sulfur into the stoichiometric GeS2–Sb2S3 glasses shifts the absorption edge to the long-wavelength direction when the GeS2 content exceeded 50 mol% (compare glasses #1–1 with #1–3 and #2–1 with #2–3 and see Fig. S2 in the Supplementary material). In the 80Ge–20Sb glass, the shift reached 0.1 eV (20 nm) for the introduction of 40 mol% of S (80Ge–20Sb–40S glass). However, the shift decreased with an increase in Sb content and for the glasses with more than 50 mol% SbS3/2, the absorption edge did not vary or it shifted slightly to the opposite (short-wavelength) direction (compare glasses #3–1 with #3–3 and #4–3 with #4–2). The variation with CsCl incorporation was similar to that with the incorporation of excess sulfur. The absorption edge shifted to the long-wavelength direction with the incorporation of CsCl into the glasses with more than 50 mol% GeS2 (compare glasses #1–1 with #1–2 and #2–1 with #2–2); the shift was 0.2 eV (40 nm) with the incorporation of 10 mol% CsCl into 80Ge–20Sb glass. The red shift of the absorption edge by halide incorporation is noteworthy, because the direction of the shift is opposite to the general trend. An increase in Sb2S3 content, however, decreased the shift of absorption edge and tended to the short-wavelength direction as for the case with excess sulfur addition (compare glasses #3–1 with #3–2). The direction of shift with the incorporation of CsCl was the same as for the glasses with excess sulfur (compare glasses #1–3 with #1–4 and #1–5, #2–4 with #2–5, and #4–2 with #4–4).
The glasses of series 5 and 6 (glasses #5–1 to #5–3 and #6–1) that contain Ga2S3 show the variation in absorption edge with the variation in glass-forming sulfides. The absorption edge shifted significantly to the short-wavelength direction by the substitution of Ga2S3 for Sb2S3. For example, shift of absorption edges exceeded 0.18 eV from the 80Ge–20Sb glasses of the basic composition to the 20Ga–80Ge glasses (compare #1–3, #1–4, and #1–5 with #5–1, #5–2, and #5–3, respectively). The incorporation of CsCl into the glasses based on Ga2S3–GeS2 also shifted the absorption edge to the short-wavelength direction (compare #5–1 with #5–2 and #5–3), as reported previously [Reference Ledemi, Amraouri and Messaddeq8, Reference Bréhault, Calvez, Adam, Rollin, Cathelinaud, Fan, Merdrignac-Conanec, Pain and Zhang9]. In the case of the replacement of GeS2 by GaS3/2, e.g., from glass 20Ge–80Sb–10CsCl to the 20Ga–80Sb–10CsCl, the absorption edge shifted to the long-wavelength direction (compare #4–2 with #6–1).
Photodoping behaviors
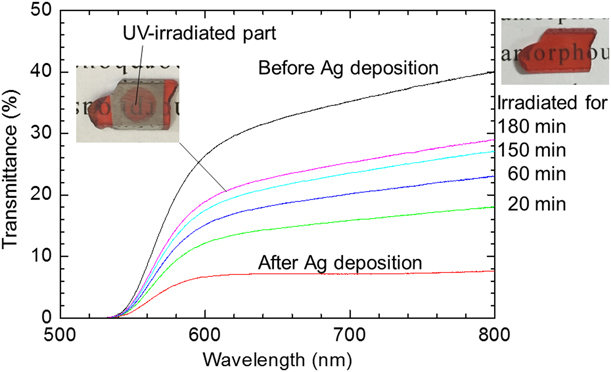
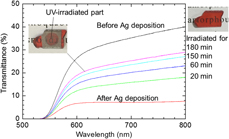
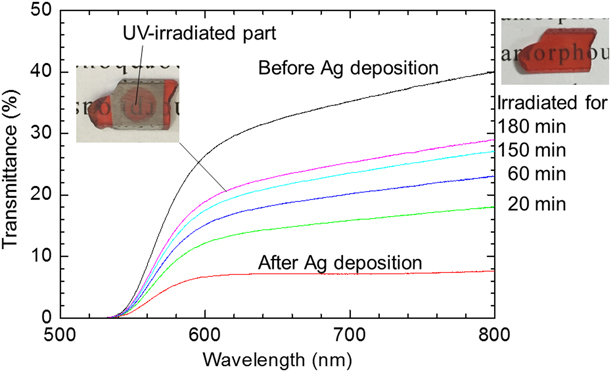
Figure 3 shows a typical example of the variation in transmission spectra of the Ag-deposited glass with ultraviolet (UV) irradiation. Photographs before Ag deposition and after UV irradiation are also shown. After Ag deposition, the transmittance in the transparent wavelength region of the glass decreased by less than 10% because of the reflection and absorption of the deposited Ag. Then, it increased with UV irradiation. The irradiated part became transparent as shown in the photograph.
Typical example of variation in transmission spectra of Ag-deposited glass with UV irradiation. Photographs show glass before and after Ag deposition, followed by UV irradiation for 180 min.
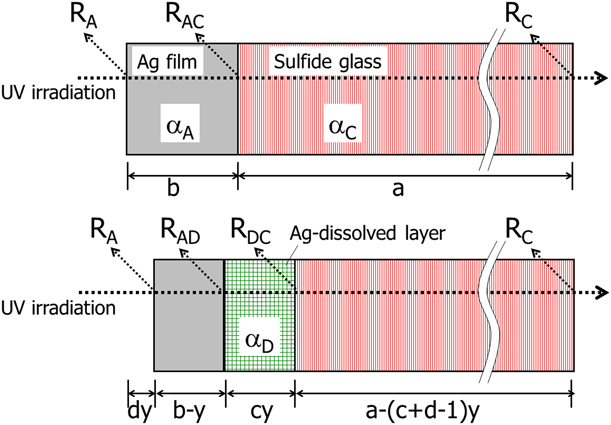
To investigate the kinetics of the Ag dissolution behaviors, we analyzed the time dependences of the transmittance according to the method proposed by Kawaguchi et al., as illustrated in Fig. 4. In this analysis, the transmittance, T(0) and T(t), at irradiation periods, t = 0 and t, respectively, are presented by the following equations [Reference Kawaguchi and Masui30, Reference Kawaguchi and Maruno31]:
 $$T\left( 0 \right) = {K_{\rm{A}}}\exp \left( { - {\alpha _{\rm{A}}}b} \right){K_{{\rm{AC}}}}\exp \left( { - {\alpha _{\rm{C}}}a} \right){K_{\rm{C}}}\quad ,$$
 $$\eqalign{T\left( t \right) = {K_{\rm{A}}}\exp \left\{ { - {\alpha _{\rm{A}}}\left( {b - y} \right)} \right\}{K_{{\rm{AD}}}}\exp \left( { - {\alpha _{\rm{D}}}cy} \right){K_{{\rm{DC}}}}\cr\exp \left\{ { - {\alpha _{\rm{C}}}\left( {a - \left( {c + d - 1} \right)y} \right)} \right\}{K_{\rm{C}}}\quad .$$
Schematic diagram of model for analyzing change in transmission spectra with photodoping proposed by Kawaguchi et al. R and α represent the reflection and absorption coefficient of each interface and phase, respectively.
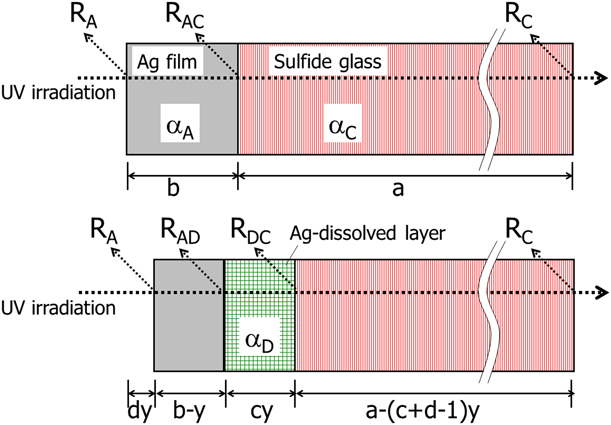
In these equations, K j’s are related to the reflectance, R j’s, K j = 1 − R j; j represents an interface, as shown in Fig. 4, and α is the absorption coefficients. The thicknesses of the sulfide glass and deposited Ag film before irradiation and dissolved Ag are expressed by a, b, and y, respectively.Then,
 $${{T\left( t \right)} \over {T\left( 0 \right)}} = {{{K_{{\rm{AD}}}}{K_{{\rm{DC}}}}} \over {{K_{{\rm{AC}}}}}}\exp \left\{ {\left( {{\alpha _{\rm{A}}} - c{\alpha _{\rm{D}}} + \left( {c + d - 1} \right){\alpha _{\rm{C}}}} \right)y} \right\}\quad ,$$
 $$\ln \left( {{{T\left( t \right)} \over {T\left( 0 \right)}}} \right) = \Delta A\left( t \right) = A\left( 0 \right) - A\left( t \right) = ky + \ln \;K\quad ,$$
where
 $$k = {\alpha _{\rm{A}}} - c{\alpha _{\rm{D}}} + \left( {c + d - 1} \right){\alpha _{\rm{C}}}\quad ,$$
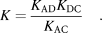 $$K = {{{K_{{\rm{AD}}}}{K_{{\rm{DC}}}}} \over {{K_{{\rm{AC}}}}}}\quad .$$
The transmittance was measured at 800 nm, where the intrinsic absorption of the glasses and Ag-dissolved glasses are negligibly small; therefore, k ∼ αA. ΔA(t) is proportional to the thickness of the dissolved silver.
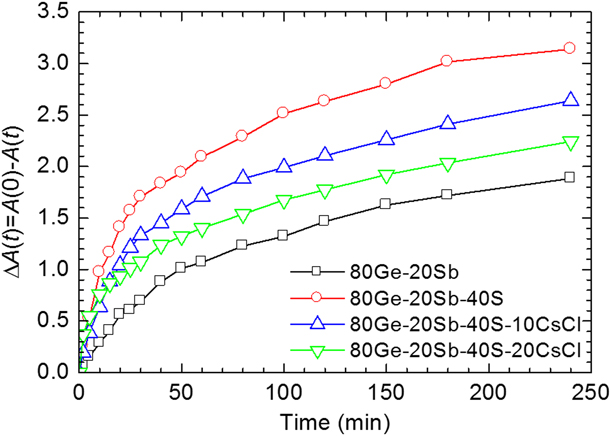
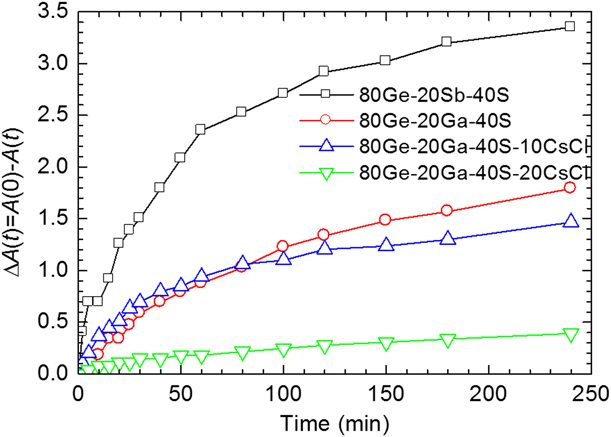
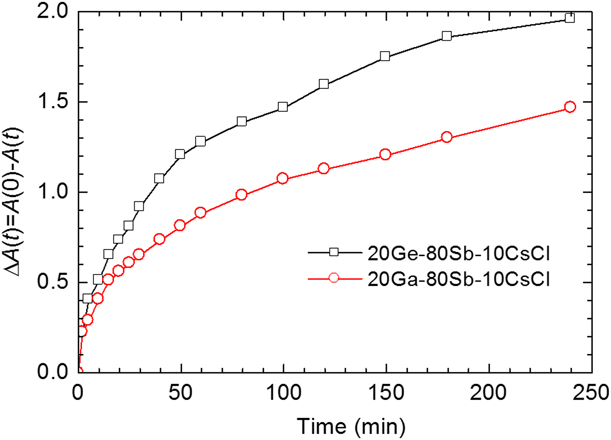
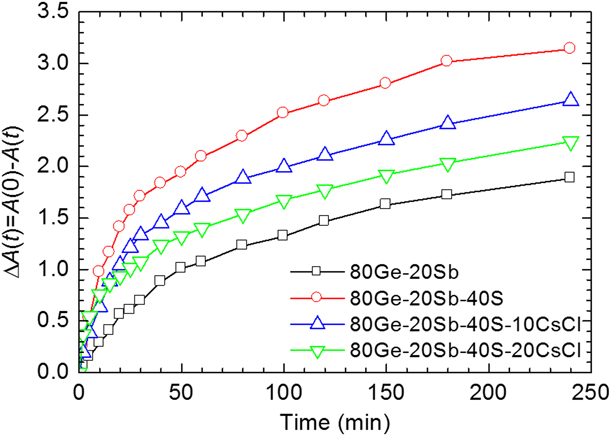
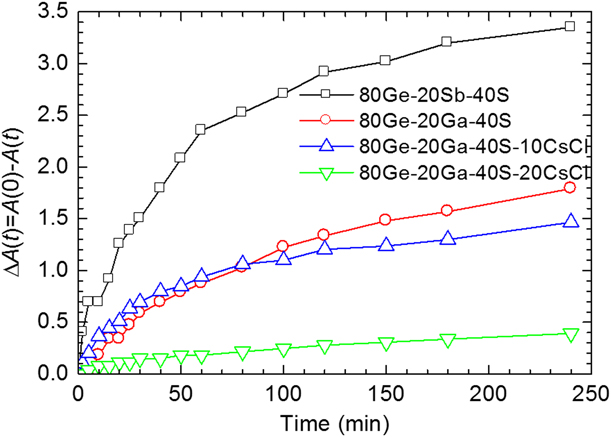
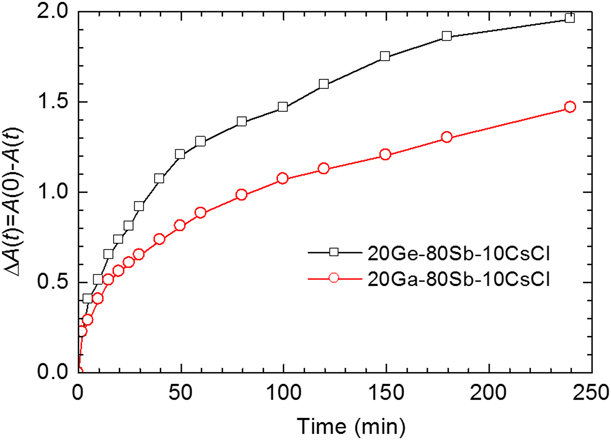
The evolution of ΔA with the irradiation time is shown in Fig. 5 for glasses based on GeS2–Sb2S3. As shown in Fig. 5, the change in ΔA increased with the incorporation of excess sulfur into the stoichiometric 80Ge–20Sb glass. However, CsCl addition to the glass that contained excess sulfur decreased the ΔA. This means that excess sulfur enhanced the photodoping, whereas the incorporation of CsCl suppressed it. The behaviors were the same for the 60Ge–40Sb glass, as shown in Fig. S5 in the Supplementary material. Figure 6 shows the evolutions of ΔA for the glasses based on Ga2S3–GeS2 compared with those of the GeS2–Sb2S3-based glasses. The replacement of Sb with Ga decreased the change in ΔA, which indicates that Ag photodoping was suppressed significantly for the glasses based on Ga2S3–GeS2. The incorporation of CsCl decreased the ΔA. The behavior was also the same as that of the GeS2–Sb2S3 glasses. A comparison between the GeS2–Sb2S3 and Ga2S3–Sb2S3 glasses is shown in Fig. 7. The replacement of Ge with Ga also decreased the change in ΔA, which indicates that photodoping was suppressed.
Evolution of ΔA for GeS2–Sb2S3-based glass and glasses incorporated with excess sulfur and CsCl. The symbols (squares, circles, and triangles) are the measured data points and lines are only to guide.
Evolution of ΔA for Ga2S3–Sb2S3-based glass and glasses incorporated with excess sulfur and CsCl, compared with that of the GeS2–Sb2S3-based glass. The symbols (squares, circles, and triangles) are the measured data points and lines are only to guide.
Evolution of ΔA for GeS2–Sb2S3-based and Ga2S3–Sb2S3-based glasses incorporated with CsCl. The symbols (squares and circles) are the measured data points and lines are only to guide.
Discussion
Additivity of density and partial molar volume
Density of glasses is often estimated by summing contributions from the individual components, which is known as an additivity concept. It has been reported that the additivity of density holds for stoichiometric sulfide glass systems based on Ga2S3–GeS2–Sb2S3 [Reference Ichikawa, Wakasugi and Kadono32] and Ga2S3–Sb2S3–CsX (X = halogen) [Reference Ashida, Okada, Wakasugi and Kadono14]. It would be interesting to know whether the additivity holds for the glass system, including excess sulfur and CsCl. Here, we examine the additivity for the GeS2–Sb2S3–S–CsCl glass system. The additivity of density is represented by Eq. (2), in which the molar volume of glass is given by the sum of the partial molar volumes of the individual components:
 $${{{W_{\rm{M}}}} \over d} = {V_{\rm{M}}} = {x_{{\rm{Ge}}{{\rm{S}}_{\rm{2}}}}}{v_{{\rm{Ge}}{{\rm{S}}_{\rm{2}}}}} + {x_{{\rm{Sb}}{{\rm{S}}_{{{\rm{3}} / {\rm{2}}}}}}}{v_{{\rm{Sb}}{{\rm{S}}_{{{\rm{3}} / {\rm{2}}}}}}} + {x_{\rm{S}}}{v_{\rm{S}}} + {x_{{\rm{CsX}}}}{v_{{\rm{CsX}}}}\quad ,$$
where d, W M, and V M are the density, molar weight, and molar volume of the glass, respectively, and x and v are the mole fraction and partial molar volume of each component, respectively. When the partial molar volumes are independent of the glass composition and do not vary in the entire composition range of the glass system, the additivity of the density holds. In Eq. (2), GeS2, SbS3/2, S, and CsCl are considered individual components of the glass system. As alternatives to these components, however, the atomic components, Ge, Sb, and S, and CsCl can also be regarded as components of the glass system. In that case, the molar volume is presented by Eq. (3).
 $${V_{\rm{M}}} = {x_{{\rm{Ge}}}}{v_{{\rm{Ge}}}} + {x_{{\rm{Sb}}}}{v_{{\rm{Sb}}}} + {x_{\rm{S}}}{v_{\rm{S}}} + {x_{{\rm{CsX}}}}{v_{{\rm{CsX}}}}\quad .$$
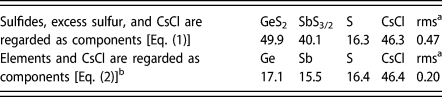
The partial molar volumes were estimated from the densities measured for all glasses prepared in this study by the least-squares fit using Eq. (2) or (3). As shown in Table III, the fittings are performed with sufficiently small root-mean-square deviations for Eqs. (2) and (3). This means that the additivity of density holds for the GeS2–Sb2S3–S–CsCl glass system. The obtained partial molar volumes of GeS2 and SbS3/2 are similar to those for the stoichiometric sulfide glass system based on Ga2S3–GeS2–Sb2S3, as already reported, and 49.8 cm3/mol and 40.4 cm3/mol for GeS2 and SbS3/2, respectively [Reference Ashida, Okada, Wakasugi and Kadono14, Reference Ichikawa, Wakasugi and Kadono32]. However, the partial molar volume of CsCl for the present glass of 46.4 cm3/mol is much smaller than that of the glass system based on Ga2S3–Sb2S3–CsCl, of 55.3 cm3/mol [Reference Ashida, Okada, Wakasugi and Kadono14]. The molar volumes of GeS2, Sb2S3 (SbS3/2), and CsCl of crystals of room-temperature phases are 45.7, 36.8, and 42.0 cm3/mol, respectively [33]. The partial molar volumes of these compounds in the GeS2–Sb2S3–S–CsCl glass are larger than those of crystals by approximately 9–10%. This result indicates that the partial molar volume of CsCl in the Ga2S3–Sb2S3–CsCl glass is 32% larger than that of the crystal, which is rather peculiar. This will be discussed elsewhere.
Partial molar volumes of glass components (cm3/mol).
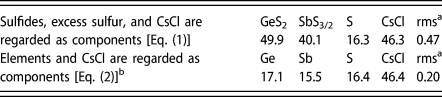
a Root-mean square of deviation (rms) between measured and calculated molar volumes of glasses.
b Molar volumes of GeS2 and SbS3/2 calculated from partial molar volumes of Ge, Sb, and S are 49.9 and 40.1 cm3/mol, respectively, which are consistent with those obtained in the fitting for GeS2, SbS3/2, S, and CsCl regarded as the components.
Absorption edge
The energy of absorption edge, and therefore, the colors of glasses changed significantly with the components and compositions of the glasses. In the GeS2–Sb2S3 glasses, the top of the valence band consists mainly of the 5s orbital of Sb3+ and/or 3p orbitals of S2− ions; the former contribution is probably larger. The bottom of the conduction band consists of anti-bonding orbitals between Sb3+ and S2−, which are contributed mainly from 5p orbitals of Sb3+ ions. In the GeS2–Sb2S3 pseudo two-component system, with an increase in Sb content, the orbitals that form the bands expand increasingly and become delocalized, which results in a band widening. This increases the energy of the top of the valence band and reduces that of the bottom of the conduction band. Then, the band gap narrows and the absorption edge shifts to the long-wavelength direction, as shown in Fig. 2.
The variation in absorption edge with the incorporation of excess sulfur and CsCl into GeS2–Sb2S3 glasses was complicated, depending on the glass composition. For glasses that contain more than 50 mol% of GeS2, the absorption edge shifted to the long-wavelength direction with the incorporation. However, for glasses with more than 50 mol% Sb2S3, the shift tended to be toward the opposite or short-wavelength direction. It is considered that such a complicated variation in absorption edge occurs because the incorporation of excess sulfur and CsCl affects the electronic structure of the glass network in varied ways. Some widen the band gap, whereas others narrow it. Here, we discuss the incorporation of CsCl. First, the glass network is terminated by the CsCl as the glass modifier, which decreases the delocalization of orbitals and results in a widening of the band gap. The difference in electronegativity of chlorine and sulfur is also important. Because of the larger electronegativity of chlorine, the 5s 2 lone-pair electrons of Sb3+ are more strongly drawn by the Cl− ions that are bound to Sb3+ than by S2− ions. This reduces the energy of the top of the valence band, which results in the band gap widening. When the network is terminated at the GeS4 tetrahedral connection, the relative ratio of SbS3 to GeS4 in the network island, in which SbS3 and GeS4 structural units are connected continuously, increases. This narrows the band gap. Furthermore, when a termination of network occurs at the SbS3 units, non-bridging sulfide that is bonded to Sb3+ is formed. The non-bridging sulfide draws the electron on the Sb3+ weakly, which results in an increase in energy of the top of the valence band and probable band gap narrowing.
A comparison of the glasses in series 5 and 6 with those of series 1 and 4, respectively, showed the variation in absorption edge with the glass network formers. First, we discuss the variation in absorption edge of the pseudo two-component GeS2–Ga2S3 glass system, in which glasses were obtained at an approximate composition range from 100 mol% GeS2 to 80 mol% GeS2, i.e., 20 mol% GaS3/2. The absorption edge shifts to a longer wavelength with an increase in Ga2S3 content. The glass network is considered to consist of GeS4 and GaS4 tetrahedra that connect with corners and edges [Reference Frumarová, Němec, Frumar, Oswald and Vlček26, Reference Heo, Yoon and Ryou28, Reference Koudelka, Frumar and Pisárčik29]. In the GaS4 tetrahedra, the forth bond is formed by the coordination of the 3p lone pair of S2− to Ga3+. In the GeS2 glass, the top of the valence band and the bottom of the conduction band are formed mainly from the 3p orbitals of S2− ions and the 4sp 3 orbitals of Ge4+ ions, respectively. When GaS4 tetrahedra are incorporated into the glass network consisting of GeS4, isolated levels that are originated from the orbital of the coordination bond may be generated in the band gap. The absorption edge is determined by the absorption assigned to the transition from the isolated level to the bottom of the conduction band. Therefore, the absorption edge shifts to the long-wavelength direction with an increase in Ga2S3 content. This situation is similar to that of the band structure of the p-type Si semiconductor, in which electron-deficient impurity elements, such as boron, create an impurity level in the band gap. However, the energy gap between the impurity level created by GaS4 and the conduction band is still larger than that of the bands that were constructed from the 5s and 5p orbitals of Sb3+. Therefore, when the Sb2S3 in the 80Ge–20Sb glass (#1–1) was replaced by the same amount of Ga2S3 in the 80Ge–20Ga glass (#5–1), the absorption edge shifted to the short-wavelength direction. The incorporation of CsCl shifted the absorption edge further toward the short wavelength. This can be explained by the role of the Cl− ions and the electronegativity of chlorine. The red shift in the absorption edge from the 20Ge–80Sb glass to the 20Ga–80Sb glass as shown in the comparison of glasses #4–2 with #6–1 cannot be explained simply, although the direction of the shift is reasonable by considering the dependence of absorption edge in the GeS2–Ga2S3 glass on the Ga to Ge ratio.
Photodoping behavior
The photodoping mechanisms have been discussed extensively. Tanaka et al. proposed a model for the mechanism of photodoping of Ag into As–S glass [Reference Tanaka and Shimakawa16, Reference Tanaka17, Reference Owen, Firth and Ewen34, Reference Tanaka35, Reference Tanaka and Sanjoh36]. In the model, first electron and hole pairs are generated by photoirradiation [Eq. (4)]. Taking into account that the chalcogenide glass is a p-type semiconductor, the holes migrate toward the interface between the silver and the glass phases, while the electrons stay at trapping sites in the glass [Eq. (5)]. The flow of holes induces the counter flow of Ag+ ions to achieve electric balance.
 $${\rm{Glass}}\buildrel {h\nu } \over \longrightarrow {{\rm{h}}^ + } + {{\rm{e}}^ - }\quad ,$$
 $${\rm{Ag}} + {{\rm{h}}^ + } \to {\rm{A}}{{\rm{g}}^ + }\buildrel {{\rm{Diffusion}}} \over \hscale 200%\longrightarrow {\rm{A}}{{\rm{g}}^ + }\left( {{\rm{inside}}\;{\rm{glass}}} \right)\quad .$$
In the experiments of this work, the Ag-deposited glasses were exposed to the 365-nm radiation (3.40 eV) from the deposited Ag side. When the radiation energy is higher than that of the work function of silver [Reference Tanaka35], an alternative process could be considered in which the radiation first excites the silver and injects the released electrons into the glasses. Then, the electrons are captured at trapping sites in the glasses. Subsequently, Ag+ ions migrate into the glasses. This model has been proposed for photoinduced dissolution in Ag/TiO2 systems [Reference Ohko, Tatsuma, Fujii, Naoi, Niwa, Kubota and Fujishima37, Reference Kawahara, Suzuki, Ohko and Tatsuma38, Reference Qiao, Zhang, Lu, Wang, Liu, Zhu and Li39, Reference Han, Zhan, Wang, Dai and Liu40]. However, in both the models, the photodoping phenomenon is divided into two processes: one is the electronic process and the other is the Ag+ diffusion process, and the latter process is the same for both the models. As mentioned later in this section, the latter process predominantly determines the photodoping rate and affects the photodoping behaviors. Then, we discuss the results based on the first model in this study.
Kitagawa et al. studied the photodoping of various types of bulk sulfide glasses based on Ge–S, Ga–S, and Ge–Sb–S [Reference Kitagawa, Takebe and Kuwabara18]. They investigated the relationship between the photodoping rate and glass composition and reported that for Ge–S- and Ge–Sb–S-based glasses with nonstoichiometric compositions that contain more amount of S–S bonds, the photodoping occurred more easily. This most likely results because the electrons that are generated by Eq. (4) are effectively trapped at the excess sulfurs by Eq. (6), without recombination with holes [reverse reaction of Eq. (4)].
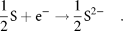 $${1 \over 2}{\rm{S}} + {{\rm{e}}^ - } \to {1 \over 2}{{\rm{S}}^{2 - }}\quad .$$
For glasses that contain excess sulfur, the photodoping reaction can be regarded as photochemical oxidation and reduction of Ag and S. The total reaction, including the diffusion of Ag+ ions, is represented by Eq. (7):
 $$2{\rm{Ag}} + {\rm{S}} \to {\rm{A}}{{\rm{g}}_2}{\rm{S}}\quad .$$
This aspect is consistent with Owen’s idea based on the thermodynamic model pointed by Tanaka et al. [Reference Owen, Firth and Ewen34, Reference Tanaka35] to explain that Ag photodoping into As–S glass occurs most easily for the AsS2 glass, and the Ag is dissolved until the composition becomes AgAsS2, which is thermodynamically most stable. In this experiment, for the glass that contains excess sulfur compared with a stoichiometric composition, photodoping occurred rapidly, as shown in Fig. 5 (compare 80Ge–20Sb and 80Ge–20Sb–40S glasses).
The photodoping phenomenon is divided into two processes: one is an electronic process that consists of electron excitation and the generation of electron–hole pairs and hole migration to the interface that results in silver oxidation, and the second is the diffusion of Ag+ inside the glass. The former process may depend strongly on the electronic structure of the glass, whereas the latter may be affected by the atomic structure of the glass.
The irradiation intensity that reaches the glasses through the Ag-deposited film increases with the progress of photodoping because the film thickness decreases. Therefore, if the total rate of the photodoping reaction depends strongly on the first process, the rate should increase with irradiation time at the initial stage of the photodoping. With photodoping progress, the thickness of the Ag-dissolved glass layer increases and the rate will gradually decrease because the total diffusion distance of Ag+ increases. Eventually, the time dependence of the amount of dissolved silver and therefore the evolution of ΔA should form a sigmoidal curve. In contrast, if the total rate of the photodoping reaction depends strongly on the second process, i.e., the diffusion rate of Ag+, the rate of the dissolution decreases gradually because of the increase in thickness of the Ag-dissolved glass layer. Then, the evolution of the ΔA become a parabolic curve. As shown in Figs. 5–7, all evolutions of ΔA are parabolic, which indicate that the second process is more predominant than the first for determining the total dissolution rate under these experimental conditions. Figures S6–S8 in the Supplementary material show that the dependences of ΔA become close to linear against the square root of the irradiation time, which indicates that the process includes diffusion as a rate-determining step. However, when the irradiation intensity decreases, the rate of the first process becomes slow and comparable with that of the second process. Then, the evolution of ΔA should become similar to the sigmoidal curve. In fact, such variation in ΔA curve with the radiation intensity can be seen in Fig. S9 in the Supplementary material.
In addition to the discussion from the thermodynamic aspect mentioned above, we discuss the variation in photodoping behavior with the glass components and compositions from the viewpoint of the glass structure and the ionic mobility in the glass. At first, the effect of CsCl incorporation is considered. The glass network is terminated by the incorporated CsCl, as shown schematically in Eq. (8):
 $$- {\rm{M}} - {\rm{S}} - {\rm{M'}} - + {\rm{CsCl}} \to - {\rm{M}} - {{\rm{S}}^ - }{\rm{C}}{{\rm{s}}^ + }{\rm{Cl}} - {\rm{M'}} - \quad ,$$
where M and M′ represent the metal cations in the glasses and the S− and Cl on the right-hand side represent the non-bridging anions that terminate the network connection. When Ag+ ions migrate through the glass network with CsCl, the ion movement may be prevented because of the negative localized charge and the large Cs+ cations, which leads to a suppression of the photodoping process. This is shown in Figs. 5 and 6. When the glass components, GeS2 or Sb2S3, were replaced by Ga2S3, the photodoping was also suppressed, as shown in Figs. 6 and 7. This result may be explained in a similar way to the case of the CsCl incorporation. Because the Ga3+ ions are coordinated on average by four sulfide ions in the glasses, the negative charge is localized on the Ga3+ ions. The mobility of Ag+ ions through the glass network may be reduced by the localized negative charge.
Conclusions
Glasses were prepared in the systems based on the two sulfides selected from Ga2S3, GeS2, and Sb2S3, and excess amount of sulfur and CsCl as an additive halide. The incorporation of excess sulfur and CsCl into the pseudo two-component sulfide glasses decreased the glass transition temperature. The additivity of density held for the GeS2–Sb2S3 glasses with CsCl and excess sulfur, which means that the molar volumes of the individual components of the glass were kept constant over the compositional range. In addition to the fundamental properties of the glasses, we investigated the variation in color of the glass and the compositional dependence of the absorption edge at the short-wavelength side. By replacing Sb2S3 with Ga2S3 for the GeS2–Sb2S3-based glasses, the absorption edge was shifted significantly to the short-wavelength direction, whereas GeS2 replacement with Ga2S3 resulted in a shift of the absorption edge to the long-wavelength direction. The absorption edges shifted mostly to the long-wavelength direction in the order of Ga2S3–GeS2-based, GeS2–Sb2S3-based, and Ga2S3–Sb2S3-based glasses. The incorporation of excess sulfur and CsCl shifted the absorption edges to the short- or long-wavelength directions depending on the glass components and compositions.
The Ag photodoping phenomenon was also investigated for the prepared glasses. For GeS2 or Sb2S3 replaced with Ga2S3 for the GeS2–Sb2S3-based glasses, photodoping was suppressed. Excess sulfur enhanced the photodoping, whereas the incorporation of CsCl suppressed. These dependences on the glass components and compositions were discussed based on the glass structures and the mobility of the Ag+ ions.
Methods
Sulfur (3N) and metals, Ga (7N), Ge (5N), Sb (5N), and CsCl, were used for the glass preparation. The sulfur was distilled under vacuum at 130 °C to remove water impurity. The CsCl was dried under vacuum at 130 °C. Glasses were prepared by a conventional method for chalcogenide glasses using silica glass tubes sealed under vacuum. Additional preparation details are described elsewhere [Reference Ichikawa, Wakasugi and Kadono32]. Vitrification was examined by naked-eye observation and X-ray diffractometry. The as-quenched glasses were annealed at 5 K below the glass transition temperature (T g) for 4 h.
The glass transition and crystallization (T c) temperatures were determined by differential thermal analysis (Shimadzu DTG-60) with a 10 K/min heating rate under N2 gas flow. Glass densities were measured by Archimedes’ method using kerosene as an immersion liquid. Glass samples were optically polished to 1.00 ± 0.05 mm thickness for optical absorption measurements and photodoping experiments. The absorption spectra in the visible and near-infrared regions were obtained using spectrophotometer (Hitachi, Japan, U3000). The absorption edge at the short-wavelength side was determined as the wavelength, where the absorbance reaches 5. Here, the absorbance is ln(T/100), where T is the transmittance (%) of the glass sample with a 1-mm thickness. Raman spectra were measured using a spectrophotometer (Nanophoton, Japan, RAMAN-FAM VI) equipped with a 532 nm laser.
Photodoping was carried out as follows. Silver was deposited on one side of the 1.00-mm-thick glass samples, using a vacuum-deposition apparatus (ULVAC, Japan, VPC-60) at a base pressure less than 4.7 × 10⁻³ Pa. Ag deposition was carried out under similar conditions; however, the condition could not be controlled precisely, and the thickness of the deposited Ag varied approximately from 20 to 30 nm with the respective depositions. Therefore, the photodoping behaviors were compared only with other glasses on which the Ag deposition was carried out simultaneously. The glasses were irradiated from the Ag-deposited side by a high-pressure Hg lamp through a 365-nm band pass filter and an infrared-absorbing filter. The glasses were placed on a cooling plate at 20 °C.
Supplementary material
To view supplementary material for this article, please visit https://doi.org/10.1557/jmr.2019.209.
Acknowledgments
This work was supported by JSPS KAKENHI Grant No. 25410239. The authors also thank Mr. Shigeru Yamamoto, a Research Scientist at Kyoto Institute of Technology, for the valuable discussion and comments on this manuscript.