I. INTRODUCTION
Nanocrystalline (nc)- and ultrafine-grained (ufg)-metals show exceptional mechanical behavior especially regarding their enhanced strength paired with sufficient ductility.Reference Höppel, May, Eisenlohr and Göken1,Reference May, Höppel and Göken2 The increased strength is caused by the small grain size and thus the Hall-Petch strengthening, whereas the sufficient level of ductility is explained by the enhanced strain-rate sensitivity of ufg face-centered cubic (fcc) metals like aluminum (Al) and nickel (Ni). The enhanced number of grain boundaries directly influences the time-dependent material behavior by either grain boundary sliding and grain boundary migration processes,Reference Chinh, Szommer, Horita and Langdon3 or the evolution of a dislocation structure and thermally activated processes.Reference May, Höppel and Göken2,Reference Li, Mueller, Höppel, Göken and Blum4 However, the specific deformation process that dominates at different deformation conditions is not fully understood.
With conventional uniaxial macroscopic testing, these processes can only be studied on a macroscopic scale,Reference May, Höppel and Göken2,Reference Wei, Cheng, Ramesh and Ma5,Reference Höppel, May and Göken6 averaging over many grains. However, nanoindentation testing is a useful tool for studying these effects on a local scale, allowing a detailed localized analysis of the deformation processes.Reference Mayo and Nix7
Besides focusing on the local determination of the strain-rate sensitivity,Reference Schwaiger, Moser, Dao, Chollacoop and Suresh8–Reference Maier, Durst, Mueller, Backes, Höppel and Göken11 the development of reliable nanoindentation creep experiments has gained much attention over the last decades. In literature, references can be found relating to studies of different indentation procedures concerning the relationship between indentation strain-rate and hardness.Reference Mayo and Nix7,Reference Bower, Fleck, Needleman and Ogbonna12 The most common experiments are constant-load indentation creep tests at room temperature (RT), where the maximum load is held constant for a preset time between 1 min and 1 h, while the indentation depth is monitored as a function of time.Reference Poisl, Oliver and Fabes13–Reference Choi, Yoo, Kim and Jang16 The apparent change in displacement is used to evaluate the time-dependent deformation behavior. However, thermal drift influences are found to be strongly affecting the displacement measurements, explaining the huge variations within the data previously reported in literature.Reference Goodall and Clyne17 To avoid these thermal drift influences, Weihs and PethicaReference Weihs, Pethica, Nix, Bravman, Arzt and Freund18 first used an alternating force techniqueReference Pethica and Oliver19 for measuring the creep rates in tin (Sn) and tungsten (W). Comparable techniques were also used by Syed Asif and PethicaReference Syed Asif and Pethica20 to investigate the creep properties of single-crystalline tungsten and gallium arsenide (GaAs) as well as Goldsby et al.,Reference Goldsby, Rar, Pharr and Tullis21 who investigated the creep behavior of quartz.
New testing techniques are now also being developed for high-temperature indentations. However, nanoindentation testing at elevated temperatures is hampered by several critical issues, such as heat management and thermal drift influences, which limit the reproducibility of the experiments. Currently only two state-of-the art techniques appear to overcome those issues: a heated tip indentation systemReference Beake and Smith22–Reference Wheeler, Raghavan and Michler24 and a nanoindentation system with an insulated tip.Reference Schuh, Lund and Nieh25,Reference Duan and Hodge26
Most indentation creep experiments referred to in literature have been performed for relatively short periods of time and close to room temperature.Reference Lucas, Oliver, Baker, Ross, Townsend, Volkert and Børgesen27–Reference Wang, Zhang and Nieh30 As especially thermal drift influences become more pronounced during high-temperature and long-time indentation testing, such experiments have to be analyzed carefully.
In this work, long-term indentation creep experiments with up to 10 h dwell time at constant load were performed using a dynamic nanoindentation technique. A nanoindentation creep method was developed to conduct reliable creep testing at ambient and nonambient temperatures. In addition to the new methodology an insulated custom-made tip is helpful, as it reduces the heat loss at the contact. The new method was applied to study the influence of the microstructure on the creep properties of nc-Ni and ufg-Al at RT and at 200 °C. The study is complemented by scanning electron microscopy (SEM) investigations on the evolution of the deformed volumes around the indentations in ufg-Al.
II. MATERIALS AND EXPERIMENTAL TECHNIQUES
The materials used in this study were Fused Silica, nc- and cg-Ni as well as ufg- and cg-Al. Fused Silica is the most commonly used reference material for indentation experiments, because it exhibits a large elastic recovery without any pile-up. The nc-Ni was produced by pulsed electrodeposition,Reference Li, Mueller, Höppel, Göken and Blum4,Reference Maier, Durst, Mueller, Backes, Höppel and Göken11,Reference Natter and Hempelmann31 whereas the ufg-AlReference May, Höppel and Göken2 samples were obtained by means of equal channel angular pressing (ECAP) up to 8 passes of commercially pure aluminum (AA1050A). For the cg-counterparts as received Al and conventionally coarsened grained cg-Ni both with a grain-size larger than 50 μm were used.
Cross-sections were prepared for metallographic examinations and nanoindentation testing. The specimens were mounted in Technovit 4071 (Technovit, Heraeus-Kulzer, Hanau, Germany), ground, polished with diamond down to 1 μm, and electrolytically polished (Al: Struers A2; 20–30 V for 20–25 s; Ni: 46% sulfuric acid, 8% acetic acid, 46% H20; 15 V for 10 s).
For ufg-Al, examinations of the grain structure were performed using electron-channeling contrast in a scanning electron microscope (SEM/FIB; Crossbeam 1540 EsB, Zeiss, Oberkochen, Germany). The grain size was evaluated by the line intersection method on SEM micrographs, while a distinction between high-angle and low-angle boundaries was not made. The median grain size is around 370 nm. The microstructure of nc-Ni was characterized by Li et al.Reference Li, Mueller, Höppel, Göken and Blum4 using x-ray diffraction (XRD) (x-ray peaks) and grain sizes between 20–40 nm were determined.
Nanoindentation creep experiments were performed with a Nanoindenter G200 (Agilent Technologies, Chandler, AZ) equipped with a continuous stiffness measurement (CSM) unit and a three-sided Berkovich pyramid. Enhanced testing temperatures were realized using a commercial heating stage (MTS Nanoinstruments, Oak Ridge, TN) and a customized, insulated Berkovich tip with a macor shaft (Synton, Switzerland). Machine stiffness and tip shape calibrations were performed according to the Oliver-Pharr methodReference Oliver and Pharr32 and nanoindentation testing was carried out at RT (22 °C) as well as at 200 °C. The CSM frequency was set to 40 Hz and harmonic amplitude of 3 nm was superimposed, as these optimized parameters showed the lowest scatter in the resultant stiffness data.
The local strain-rate sensitivity was investigated using nanoindentation strain-rate jump tests according to Maier et al.Reference Maier, Durst, Mueller, Backes, Höppel and Göken11 The indentation strain-rate  $\dot P/P$ was initially held constant (0.05/s) until a depth of 500 nm was reached, ensuring that a constant microstructure was present underneath the indenter tip. Afterward reversible strain-rate jumps to 0.01/s and 0.005/s, respectively, were applied every 250 nm up to a maximum indentation depth of 2000 nm. The hardness and the Young's modulus were determined as an average value over an indentation depth of 100 nm in each constant strain-rate section. The local strain-rate sensitivity
 $m = \partial \ln H/\partial \ln {{\dot \varepsilon }}$ was obtained from the slope of the logarithmic plot of indentation strain-rate versus hardness.
III. NANOINDENTATION LONG-TERM CREEP TESTS—AN IMPROVED METHOD FOR CORRECTING THERMAL DRIFT INFLUENCES AT ROOM AND ELEVATED TEMPERATURES
A. Dynamic stiffness testing and indentation creep—theoretical background
Weihs and PethicaReference Weihs, Pethica, Nix, Bravman, Arzt and Freund18 introduced a dynamic nanoindentation technique for conducting local long-term creep experiments. Using an alternating force signal,Reference Pethica and Oliver19 the contact stiffness S is continuously recorded during the indentation test. Whereas the indentation depth h recorded by the system is highly influenced by thermal drift, the contact stiffness is not, so the true contact area Ac can reliably be determined using Sneddon’s equation,Reference Oliver and Pharr32,Reference Sneddon33 provided the reduced modulus ER of the material is known:
 $$S = {{2{\rm{\beta }}} \over {\sqrt {\rm{\pi }} }} \cdot E_{\rm{R}} \cdot \sqrt {A_{\rm{c}} } = S_{{\rm{CSM}}}\quad ,$$
which leads to
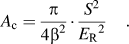 $$A_{\rm{c}} = {{\rm{\pi }} \over {4{\rm{\beta }}^2 }} \cdot {{S^2 } \over {E_{\rm{R}} }^2 }}\quad.$$
Knowing the contact area A c, the contact depth h c is determined by solving the equation A c= f(h c), where f is the known tip area function:
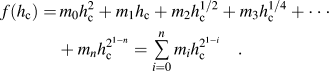 $$f(h_{\rm{c}} ) = \,m_0 h_{\rm{c}}^2 + m_1 h_{\rm{c}} + m_2 h_{\rm{c}}^{{1 \mathord{\left/ {\vphantom {1 2}} \right. \kern-\nulldelimiterspace} 2}} + m_3 h_{\rm{c}}^{{1 \mathord{\left/ {\vphantom {1 4}} \right. \kern-\nulldelimiterspace} 4}} + \cdot \cdot \cdot + m_n h_{\rm{c}}^{2^{1 - n} } = \mathop\sum\limits_{i = 0}^n {m_i h_{\rm{c}}^{2^{1 - i} } }\quad .$$
After appropriate substitution ( $h_{\rm{c}}^* = h_{\rm{c}}^{2^{1 - n} }$) this amounts to solving a polynomial equation, which can be performed by a standard computational algorithm (for instance calculating the eigenvalues of the companion matrix).
Finally, it is possible to calculate the indentation depth h from the contact depth h c accounting for the magnitude of the elastic sink-in around the indenter:
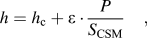 $$h = h_{\rm{c}} + {\rm{\varepsilon }} \cdot {P \over {S_{{\rm{CSM}}} }}\quad,$$
where ε is a geometrical constant which depends on the shape of the indenter and which was determined for a Berkovich-pyramid as 0.75.Reference Merle, Maier, Göken and Durst34 The time derivatives of indentation depth  $\dot h = {\textstyle{{\partial h} \over {\partial t}}}$ and contact depth
 $\dot h_{\rm{c}} = {{\partial h_{\rm{c}} } \over {\partial t}}$ are used to calculate the corresponding indentation creep ratesReference Bower, Fleck, Needleman and Ogbonna12,Reference Mulhearn and Tabor35,Reference Cheng and Cheng36 :
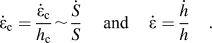 $${{\dot \varepsilon }}_{\rm{c}} = {{{{\dot \varepsilon }}_{\rm{c}} }\over {h_{\rm{c}} }} \sim{{\dot S} \over S}\quad \,{\rm{and}}\quad \,{{\dot \varepsilon }} = {{\dot h} \over h}\quad.$$
It should be noted that these evaluated creep rates are generally independent of the reduced modulus and therefore the final results are unaffected by some over- or underestimation of the referenced modulus due to pile-up or sink-in influences.
Furthermore, the true hardness, based on the contact stiffness, is given asReference Joslin and Oliver37:
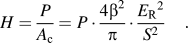 $$H = {P \over {A_{\rm{c}} }} = P \cdot {{4{\rm{\beta }}^2 } \over {\rm{\pi }}} \cdot {{E_{\rm{R}}}{ ^2 } \over {S^2 }}\quad.$$
As this hardness value is also directly derived from the stiffness data and thus the true contact area is taken into account, pile-up or sink-in effects are considered.Reference Hay, Oliver, Bolshakov, Pharr, Moody, Gerberich, Burnham and Baker38
To allow a quantitative comparison with uniaxial creep tests, the actual hardness, which represents the mean contact pressure, is transformed into a flow stress. It has been well-establishedReference Atkins and Tabor39 that the hardness H is directly related to the flow stress σf at a so-called representative strain using the constraint factor c*. Depending on its tip geometry different values for representative strains are discussed in literature in detail, e.g., for Berkovich  ${\rm{\varepsilon }}_{{\rm{rep - Berko}}} = 8\%$, and Cube Corner
 ${\rm{\varepsilon }}_{{\rm{rep - CC}}} = 20\%$.Reference Maier, Durst, Mueller, Backes, Höppel and Göken11 The flow stress at the representative strain, further on called equivalent stress, will be used for comparing the indentation data to stresses from macroscopic compression experiments.
 $$H = {\rm{c}}^* \cdot {\rm{\sigma }}_f ({\rm{\varepsilon }}_{{\rm{rep - Berko}}} = 8\% )\quad.$$
Su et al.Reference Su, LaManna, Gao, Oliver and Pharr40 suggested that the constraint factor could depend on the strain-rate. This would lead to a different behavior of strain-rate sensitive materials in indentation testing when compared with uniaxial testing. However, it was shown by finite elements method (FEM) simulations that the apparent constraint factor for nc-Ni depends on the indenter opening angle but is independent of the applied strain-rate,Reference Maier, Durst, Mueller, Backes, Höppel and Göken11 therefore a constant constraint factor of 2.8 was used in this study (see also Table I).
Constraint factors c* for all tested materials.

Comparing indentation creep experiments with uniaxial tests, it should be considered that during indentation with a pyramidal indenter, the material undergoes a large amount of plastic deformation, with large strain gradients in the deformed volume. The assumption of a steady-state microstructure for the evaluation of creep properties from continuous indentation experiments is therefore not valid. The data from pyramidal indentation creep is therefore always a mixture of the different creep stages, depending on the localized stress and strain states. However, nanoindentation creep data are commonly analyzed making the assumption of steady-state creep,Reference Li, Henshall, Hooper and Easterling41 which is a good approximation that greatly simplifies the analysis. Indeed, the steady-state creep-rate is strongly dependent on the applied stress and can be well described by the simplified expression:
 $${{\dot \varepsilon }} = K \cdot {\rm{\sigma }}^n = K \cdot {\rm{\sigma }}^{{{\rm{1}} \mathord{\left/ {\vphantom {{\rm{1}} m}} \right. \kern-\nulldelimiterspace} m}} \quad.$$
Where n is the stress exponent, m the strain-rate sensitivity and K a constant.
Substituting the flow stress (equivalent stress) with the hardness [Eq. (7)], it follows that the local strain-rate sensitivity m and stress exponent n, respectively, can be determined from the slope of the logarithmic plot of the hardness versus the strain-rate.
 $$m = {{\partial \ln {\rm{\sigma }}} \over {\partial \ln {{\dot \varepsilon }}}}\sim{{\partial \ln H} \over {\partial \ln {{\dot \varepsilon }}}} = {1 \over n}\quad.$$
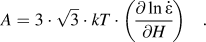 $$A = 3 \cdot \sqrt 3 \cdot kT \cdot \left( {{{\partial \ln {{\dot \varepsilon }}} \over {\partial H}}} \right)\quad.$$
In literature, an activation volume A is often calculated from the stress exponent and this volume is being associated with the thermally activated glide of dislocations.
B. Nanoindentation long-term creep tests
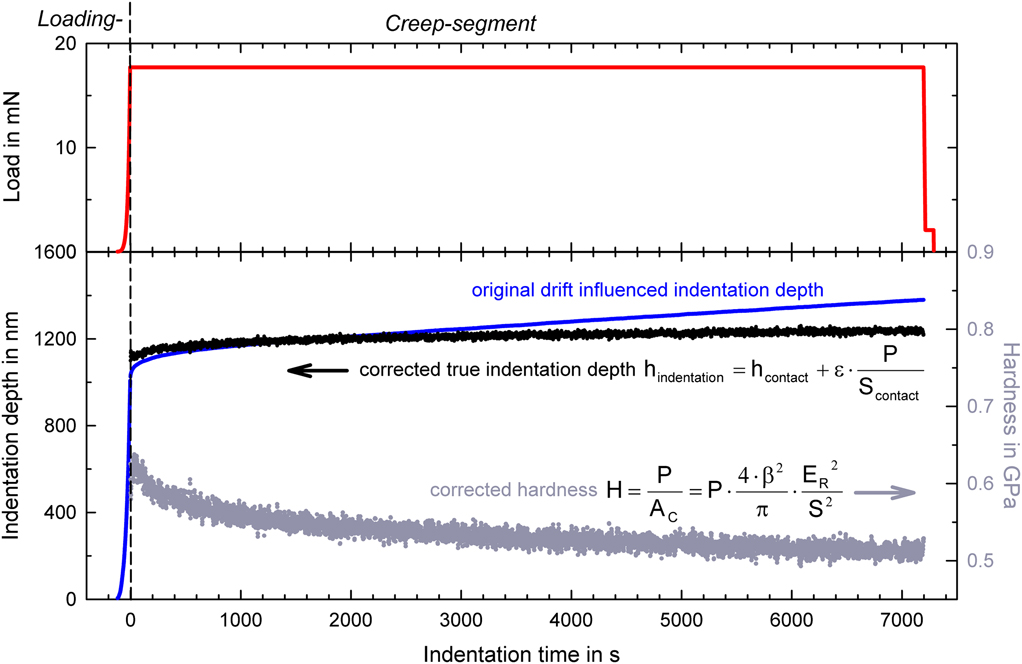
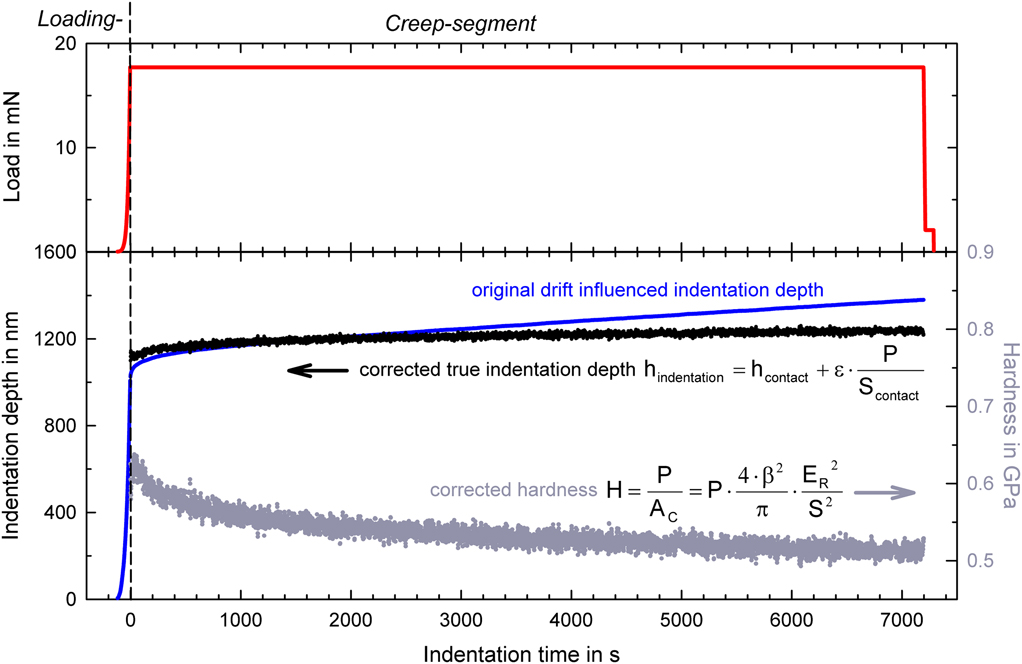
For the indentation creep experiments, an initial loading segment with a conventional strain-rate controlled loading scheme ( ${{\dot P} \mathord{\left/ {\vphantom {{\dot P} P}} \right. \kern-\nulldelimiterspace} P}$=0.05/s) was used, and the load was increased until a preset maximum indentation depth was reached (e.g., 1000 nm) (Fig. 1 upper section). In the following creep segment, the raw load was kept constant and the changes in the displacement were recorded. The hold time was varied between 1, 2, 5, and 10 h and the change in the displacement was both conventionally recorded by the indentation system and additionally calculated by using the continuously determined contact stiffness and the described dynamic correction procedure (see also Appendix). For this purpose, the thermal drift-corrected contact area Ac was evaluated by Eq. (2), where the knowledge of the reduced modulus Er is absolutely essential. For RT tests the averaged Er was directly taken from the initial loading segment [see Table II(a)]. At higher temperatures, where thermal drift plays a more pronounced role and the determination of the Young's modulus from the indentation data is not as reliable, the evaluation is based on literature data of the reduced modulusReference Simmons and Wang42 [see Table II(b)]. Afterward, the corrected true contact depth hc and the maximum indentation depth h were directly derived from the corrected contact area by solving the tip area equation numerically using linear interpolations [Eq. (3)].
ufg-Al—Illustration of the indentation method used for long-term nanoindentation creep experiments. The upper curve represents the raw load (with reference to the surface), which is kept constant during the creep segment. The large effect of the thermal drift on the measured displacement of the indenter can be corrected by the proposed analysis. For room temperature (RT), the required value of the reduced modulus Er is measured during the loading segment as the hardness and modulus data carried out continuously during the loading segment).
(a) Young's modulus, reduced modulus, and hardness determined in the loading segment during indentation creep testing at RT, and (b) Young's modulus, reduced modulus (literature values) for nanoindentation creep testing at elevated temperatures.Reference Simmons and Wang42

As shown in Fig. 1 (lower section), the displacement data recorded by the nanoindenter (blue curve) significantly differs from the one calculated from the contact stiffness data (black curve). As the displacement is not measured directly at the sample level but rather at the capacity gauge, it is indeed a combination of actual creep behavior and other environmental influences like thermal drift during the test. The dynamically corrected data is however based on the contact stiffness and shows directly the true change in indentation depth. The analysis of the original, uncorrected indentation data would lead to a strong misinterpretation of the creep behavior of the tested material. The corrected, true hardness (gray curve) was derived from Eq. (6). The corresponding stresses were determined using Eq. (7) with the material-dependent constraint factors given in Table I. Finally, the resulting true contact and true indentation depth [Eq. (4)] as well as true hardness were fitted with a three-parameter power-law function (SigmaPlot, Systat Software Inc., San Jose, CA) to smoothen the original CSM signal.
The local creep rates  ${{\dot \varepsilon }}$ and
 ${{\dot \varepsilon }}_{\rm{c}}$ were evaluated according to Eq. (5). As both rates are quite similar, only the creep-rate from the corrected maximum indentation depth h is discussed in the following. By plotting the hardness over the creep rate, the time- and rate-dependent deformation behavior of the investigated materials can be directly analyzed. Finally, the strain-rate sensitivity m and stress exponent n, respectively, were evaluated according to Eq. (9). (For further information on this method and the data processing, please see the Appendix)
C. Nanoindentation creep tests at elevated temperatures
The previously described nanoindentation creep method was also used for high-temperature nanoindentation creep experiments at a constant load. For this purpose, an additional tip heating segment was implemented prior to the indentation test. After the tip approach and detection of the first contact, the tip was heated for 120 s by holding the tip in contact with the surface at a load of 10 μN. This segment allows adapting the temperature of the insulated (but not heated) Berkovich tip to that of the sample and stabilizing the contact temperature, which leads to a reduction of further drift problems.Reference Schuh, Lund and Nieh25 However, an exact determination of the real contact temperature is not possible with the indentation setup that is being used. Immediately afterward, the previously described indentation scheme was applied at the same area (Fig. 1).
IV. RESULTS
A. Indentation strain-rate jump and long-term RT creep testing
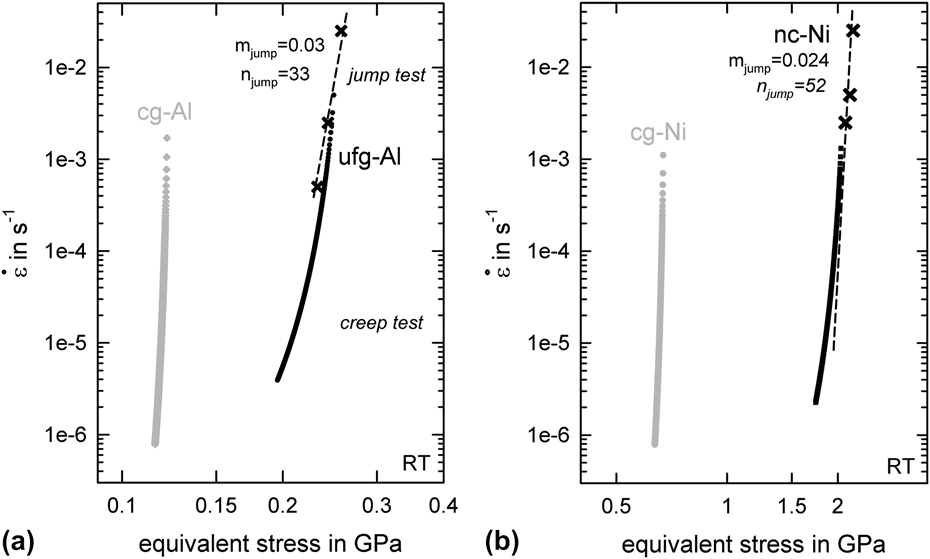
Figure 2 shows a comparison between the long-term creep data and the strain-rate jump data of Al and Ni in an ufg- and cg-state at RT. Generally, the results obtained from the nanoindentation creep tests are in good accordance with the strain-rate jump tests (shown with crossed symbols). It is obvious that the resultant creep-rates are by three orders of magnitudes lower than the strain-rates applied during nanoindentation strain-rate jump tests. This clearly illustrates the possibility to investigate the time-dependent materials behavior over a wide range of strain-rates by combining different testing methods.
Nanoindentation creep tests results in a Norton-Plot of (a) Al in an ufg- and cg-state, and (b) Ni in a nc- and cg-state. The results from some nanoindentation strain-rate jump tests are shown (crossed symbols) in comparison.
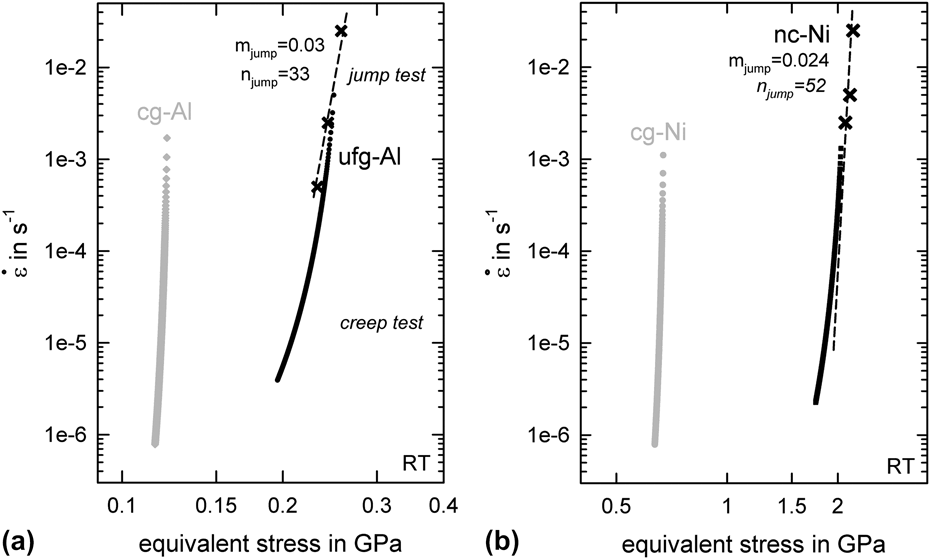
Whereas the reduced modulus obtained from the loading segment is almost the same (Table II), the hardness and thus the equivalent stress are strongly enhanced in the ufg-material due to the Hall-Petch strengtheningReference Hall43,Reference Petch44 associated with the finer grain structure. The hardness of ufg- and cg-Al are in good accordance with the literature, where May et al.Reference May, Höppel and Göken2 had previously found ultimate compression strength of around 191 MPa after eight ECAP passes and of around 80 MPa for a cold rolled sample with a coarse-grained microstructure. For both microstructures, the resultant creep-rate decreases with testing time, but the strain-rate sensitivity m, which is represented by the slope of the curve, is consistently higher for the ufg-Al state. Similar findings are reported by Sklenicka et al.,Reference Sklenicka, Dvorak and Svoboda45 who found a decrease in the creep resistance for pure Al, with increasing number of ECAP passes. This was attributed to the evolution and homogenization of the ufg microstructure by the ECAP process.Reference Blum and Li46
For the Ni-samples [Fig. 2(b)], the general behavior is similar. The sample with the nc microstructure shows higher hardness and equivalent stress when compared with the cg sample, whereas the modulus stays constant. The rate-dependent results carried out during nanoindentation strain-rate jump tests are in a good agreement with the long-term creep experiments and with literature data.Reference Li, Mueller, Höppel, Göken and Blum4,Reference Maier, Durst, Mueller, Backes, Höppel and Göken11,Reference Blum and Li47
B. Temperature-dependent local creep behavior
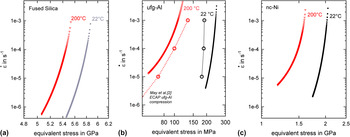
Figure 3 displays the time- as well as the temperature-dependent behavior of fused silica, ufg-Al and nc-Ni at RT and 200 °C. Focusing first on the reference material fused silica [Fig. 3(a)], the RT creep behavior is in good accordance with literature data.Reference Goldsby, Rar, Pharr and Tullis21 With increasing time, the resultant creep-rate and equivalent stress record a decrease, whereas the slope of the curve which represents the strain-rate sensitivity changes only slightly. At higher temperatures, the curve is shifted to slightly lower stress values, with little change in the curvature. The creep behavior is therefore nearly unaffected by increasing the temperature up to 200 °C.
Time- and temperature-dependent deformation behavior—results of nanoindentation creep tests for 2 h at RT and 200 °C; equivalent stresses are directly derived from the hardness according to Eq. (7), (a) Fused Silica, (b) ufg-Al, and (c) nc-Ni.

In contrast, the overall microscopic mechanical behavior of ufg-Al is strongly influenced by the testing temperature [Fig. 3(b)]. With increasing testing temperature up to 200 °C (homologous testing temperature T/TM = 0.5), the hardness decreases from 0.72 GPa to 0.40 GPa and a strong increase in the strain-rate sensitivity is found. At 200 °C, ufg-Al is even softer than cg-Al at RT (see also Fig. 4). A similar behavior has also been found by macroscopic compression tests on ECAP-processed ufg-Al by May et al.Reference May, Höppel and Göken2 as included in Fig. 3(b). The absolute stresses in macroscopic compression and local nanoindentation tests are slightly different probably due to some minor different chemical element concentrations present in the investigated AA 1050A. However, the general trend of both testing methods is the same.
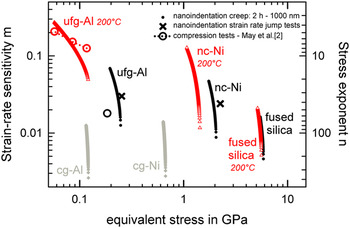
All investigated materials—evaluation of strain-rate sensitivity m and stress exponent n regarding the equivalent stress for RT experiments (small, filled symbols), nonambient temperatures (200 °C) (red, open symbols), nanoindentation strain-rate jump tests (black crosses), and macroscopic compression testsReference May, Höppel and Göken2 (big circles).

Although the homologous temperature of Ni (T/TM = 0.27) is significantly lower for experiments at 200 °C, nc-Ni also exhibits a time-dependent deformation behavior, with higher creep-rates at increasing testing temperature [Fig. 3(c)]. The initial part of the creep curves for the samples tested at RT and 200 °C run parallel, with a strongly reduced hardness at 200 °C. At longer testing time intervals, the slope of the 200 °C curve strongly decreases, indicating that the strain-rate sensitivity increases.Reference Li, Mueller, Höppel, Göken and Blum4,Reference Blum and Li47 These findings are in good agreement with the work of Blum et al.,Reference Blum and Li47 who also found enhanced strain-rate sensitivity during compression and constant stress creep testing of nc-Ni at RT as well as at higher temperatures.
V. DISCUSSION
A. Deformation mechanism in ufg-Al and nc-Ni during nanoindentation creep experiments
Before analyzing and discussing the obtained stress versus strain-rate data, we want to highlight again that during constant load creep experiments, the assumption of a fixed microstructure is not always valid, especially for higher temperatures, where grain coarsening might take place. During constant load indentation creep testing, the indenter is continuously sinking into the material. Since the load is constant and the contact area is increasing during this process, the mean pressure acting on the material is being reduced as creep continuous. This process is accompanied by dislocation rearrangements and annihilation within the plastically deformed volume. Moreover stress-assisted grain coarsening might take place.
These processes lead us to scrutinize the shape of the equivalent stress versus strain-rate curves (Figs. 2 and 3), which resemble a power-law breakdown behavior.Reference Meyers, Misha and Benson48,Reference Kassner and Pérez-Prado49 For steady-state creep, such behavior is well described and related to a change in deformation mechanism from dislocation glide and climb mechanism to a morepronounced diffusive creep mechanism such as Coble creep.
The indentation creep behavior can be further analyzed by evaluating the strain-rate sensitivity m and the stress exponent (Fig. 4), from the slope of the creep-rate versus stress graphs (e.g., Fig. 3). During creep testing of the cg-metals and fused silica at RT as well as 200 °C, the strain-rate sensitivity and equivalent stress are decreasing only slightly with creep time. For ufg- and nc- metals, the strain-rate sensitivity increases and the materials exhibit a stronger softening during long-term creep experiments. For all tested materials the equivalent stresses derived from strain-rate jump tests are slightly higher than that obtained during creep measurements. This difference might be related to an extensive pile-up around the indentation, which is not considered in the analysis of the strain-rate jump tests. For nc-Ni the resultant strain-rate sensitivity increases up to m = 0.07 and the stress exponent decreases down to n = 11 at RT. Similar values were also found for ufg-Al. Overall, the evaluated strain-rate sensitivities m and stress exponents n are rather high,Reference Goodall and Clyne17 but generally they are in good accordance with the values found in literature for local creep behavior at RT.Reference Choi, Yoo, Kim and Jang16 At higher temperatures, the curves for nc-Ni and even more for ufg-Al show an obvious change in the curvature. With increasing time, the resultant strain- rate sensitivity increases as expected, but the decrease of stress is more pronounced. Specifically n = 7 is found for nc-Ni at 200 °C and n = 5 for ufg-Al tested at 200 °C. The strongly reduced equivalent stress and decreased stress exponent might be related to microstructural instabilities due to a stress-assisted grain coarsening together with an enhanced diffusivity at elevated temperatures.
B. Microstructural investigation of the residual impressions
It should be pointed out that the absolute values of the stress exponent on both local and macroscopic length scale are nearly identical (see Fig. 4). This indicates that similar mechanisms are acting on both, the local scale and on the macroscopic length scale.
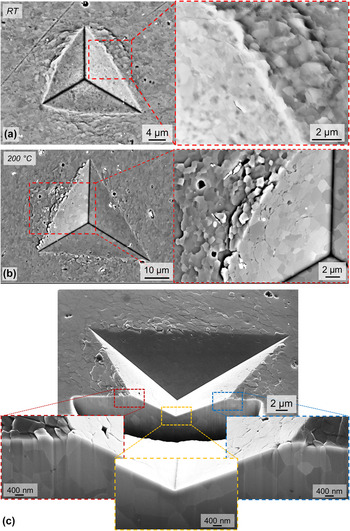
Figure 5(a) shows an indentation after a conventional constant strain-rate experiment at RT. Close to each edge of the indentation, grain boundary sliding (GBS) within the pile-up formation is seen, where some grains have slided out of the flat surface and the free surface around the indentation strongly roughens. Generally, the grain size itself shown in the SEM images (see also Fig. A2) seems to be quite stable during the long-term indentation experiments and a strong stress-driven grain coarsening as observed in CuReference Zhang, Weertman and Eastman50, thin nc-Al-filmsReference Jin, Minor, Stach and Morris51,Reference Gianola, Van Petergem, Legros, Brandstetter, Van Swygenhoven and Hemker52 and nc-NiReference Pan, Nieh and Chen53 could not be found for indentations performed at RT.
SEM-micrographs of ufg-Al—(a) resultant impression of a room temperature (RT) constant strain-rate experiment with magnification of GBS close to the indenter edge, (b) Postimpression of a high-temperature (200 °C) long-term (2 h) experiment with obvious grain-boundary sliding behavior close to the surface but less pile-up formation, and (c) corresponding FIB-cross-section with special magnifications of the areas showing near-surface GBS, but homogeneously deformed areas in the deeper regions of the indentation.

Figure 5(b) shows the corresponding SEM images of the resultant impression in ufg-Al after 2 h creep at 200 °C. As expected, the microstructure is homogeneously coarsened (median grain size: ∼520 nm) within and around the residual impression. Further, strong grain boundary sliding (GBS) is seen along the indenter edges, where single grains individually have sheared out of the surface.
However, the shape of the residual pile-up in the plastic zone clearly differs between RT [Fig. 5(a)] and 200 °C [Fig. 5(b)] indentations. Whereas the RT impression in ufg-Al clearly shows pile-up formation along the indenter edges with ∼22% increase of the contact area, at 200 °C the pile-up leads only to an increase of 2% of the contact area. Macroscopic compression tests provide an explanation for thisReference May, Höppel and Göken2: During macroscopic plastic deformation ufg-Al does not show any strain-hardening behavior at RT. However, at 200 °C the strain-hardening behavior increases. This correspondingly results in a decreasing pile-up formation during indentation similar to that found for materials with a cg-grain structure.Reference Bolshakov and Pharr54
For ufg-Al tested at 200 °C, two deformation regions can be separated: close to the surface, a network of small crack-like features appears, whereas in the deeper regions of the indented material deformation is homogeneous without any feature formation. These deeper regions however are decisive for the bulk deformation and the overall dominant deformation mechanism. In this context, the free surface plays a minor role and grain boundary sliding is not found. Focused ion beam (FIB)-cross sections were prepared across the indentation for further analyzing the deformed regions underneath the impression [Fig. 5(b)]. The crack-like features are only found at the free surface, whereas the grain boundaries within the bulk do not show any sign of cracking or pore formation at triple junctions. Moreover the grains in the deeper region of the impression (bulk material) are significantly deformed and show a more elongated structure. Thus, the observed grain boundary sliding at the surface is therefore not related to the bulk deformation, but caused by the sliding of unconstrained surface grains. The crack-like features at the grain boundaries inside the impression stem therefore from the evolving surface morphology produced already at lower indentation depths: during the entire indentation process at 200 °C, grains are heterogeneously gliding out of the surface close to the indentation edges and with increasing indentation depth these slipped grains are being punched by the indenter. This results in a folding of the slipped surface grains and the subsequent appearance of the crack-like features, which are therefore thought to be an effect of the heterogeneous, roughened surface due to the GBS of the unconstrained surface grains at the surface.
In literature, Chinh et al.Reference Chinh, Szommer, Horita and Langdon3 also found grain boundary sliding around microindentations and used this as a proof for grain boundary sliding as being the dominating deformation mechanism. However, Nix and Mayo,Reference Mayo and Nix7 who also found some grain boundary motion in superplastic lead along the indenter tip edges suggested that this behavior is not the dominating mechanism for superplastic deformation, as GBS is a function of the degree of spatial freedom available to the grains. This fact was inter alia confirmed by Böhner et al.,Reference Böhner, Maier, Durst, Höppel and Göken55 who investigated the local and global deformation behavior especially in terms of strain-rate sensitivity for ufg-Al. They found for elongated and globular microstructures strongly different shapes and occurrence of outlined grains around the single impressions; however the resultant strain-rate sensitivities were the same. Furthermore they found comparable m-values in macroscopic testing, although the free surface plays there a much less pronounced role. Accordingly they eliminated GBS as the dominating deformation mechanism for strain- rate sensitivity. The same argument is also applicable in our context: As the GBS is clearly due to the unconstrained movement of surface grains and the macroscopic and local values for the stress exponent have the same magnitude,Reference May, Höppel and Göken2 grain boundary sliding can be ruled out as the dominating deformation mechanism.
These fundamental findings relating the dominant deformation mechanism at RT are also corresponding well with the ones by Wang et al.,Reference Wang, Hamza and Ma56 who proposed that grain boundary sliding could be ruled out due to the reduced activation volume in the nc-state in comparison to their cg counterparts.
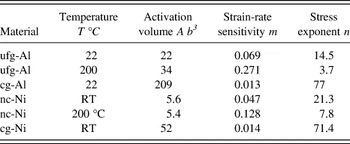
In Table III the evaluated activation volumes for all tested metals at the very end of a long-term indentation creep experiment are shown. Comparing these values it was found for RT experiments, that the ufg- and nc-states exhibit much smaller activation volumes than their cg-counterparts. By increasing the temperatures, for nc-Ni the resultant activation volumes remain almost unchanged around 5.5 b3, whereas for ufg-Al a slight increase from 22 to 34 b3 is found. Generally, the activation volume is considered useful in the indication of the dominant dislocation glide mechanisms. However it should be noted that during indentation creep local relaxation mechanism will lead to a dislocation rearrangement accompanied by dislocation annihilation near the grain boundaries. Care must therefore be taken in the analysis of the activation volumes, as several processes, not related to dislocation glide, might take place.
Activation volume A and strain-rate sensitivity m; values taken at the very end of a 2 h nanoindentation creep experiment (basic data also see Figs. 2 and 3). It should be noted that the interpretation and the meaning of the values for the activation volume is questionable, since dislocation glide is not the rate controlling mechanism.

VI. CONCLUSION
Using a new dynamic nanoindentation method, where the contact stiffness and thus the true contact area are recorded continuously allows measuring the indentation creep rate at RT and 200 °C. FCC Al and Ni with ufg- and nc-microstructure, respectively, were investigated regarding their time- and temperature-dependent behavior.
The strain-rates from the nanoindentation creep experiments are several orders of magnitude lower than that from the strain-rate jump tests. Using both methods allows testing the material behavior over a wide range of strain-rates. Whereas in the initial part of a creep experiment the resultant rate sensitivity is similar to that in strain-rate jump experiments, with increasing testing time an increasing strain-rate sensitivity was found. At RT, the ufg- and nc-materials showed the well-known enhanced strain-rate sensitivity as compared with the cg-states, as well as more pronounced softening during creep deformation. These effects are strongly increased at 200 °C for nc-Ni and ufg-Al, whereas the reference material Fused Silica is almost unaffected. The behavior of the strain-rate sensitivity regarding equivalent stress follows literature data from macroscopic testing techniques.
Around the indentations in ufg-Al at RT, extensive grain boundary sliding and pile-up is observed. With increasing test temperature, a reduction in pile-up followed by an increased GBS is found. Moreover a network of crack-like features appears within the residual indentation, close to the free surface. However, FIB cross-sections showed that these crack-like features are only found at the surface and are related to the subsequent deformation of the roughened surface during the continuing indentation. In the bulk, underneath the indentation, no cracks could be observed. Generally, grain boundary sliding is directly correlated in this study to the movement of unconstrained free surface grains.
ACKNOWLEDGMENTS
The authors gratefully acknowledge the kind support of Dr. Holger Pfaff, Agilent Technologies, and the very helpful discussions with Dr. H.W. Höppel. Financial support was provided by the German Research Council (DFG), which, within the framework of its “Excellence Initiative” supports the Cluster of Excellence “Engineering of Advanced Materials” at the University of Erlangen-Nürnberg and by the Bayerische Forschungsstiftung (BFS) within the project “Galvano 21”.
Appendix Experimental details for the nanoindentation long-term creep testing
Figure A1 shows the results of long-term creep tests at RT on ufg-Al with an initial indentation depth of 1000 nm and various creep durations up to 10 h. Included in the plot is also the temperature variation within the indenter chamber. The temperature fluctuates between 23.2 and 23.6 °C within a 10 h test segment. The displacements recorded by the nanoindenter are nonreproducible and unsteady as it directly reflects the slight changes in the chamber temperature. The temperature fluctuation causes therefore thermal drift effects, which can be easily corrected by using the dynamic stiffness signal [Fig. A1(a)]. The corrected data based on the contact stiffness measurements show for all measurements a small but steady increase in the displacement with time and a better reproducibility [Fig. A1(b)].
ufg-Al—Creep data carried out during nanoindentation long-term creep tests at 1000 nm indentation depth and tested at room temperature (RT) with variation of the applied creep time (1 h, 2 h, 5 h, and 10 h); (a) Indentation depth data from the indentation system and exemplarily corresponding ambient temperature during 10 h experiment, (b) corrected indentation depth data according to Eqs. (2) and (4), (c) resultant  $\dot h$. over creep time (with fused silica as a reference material), and (d) hardness over resulting creep-rate.

A good agreement between the different measurements of  $\dot h$ over the applied creep time performed for ufg-Al is shown in Fig. A1(c). This demonstrates the consistency of the long-term nanoindentation data and it also confirms that the evaluation based on the contact stiffness is more or less not affected by thermal drift. More generally, the changes in the indentation depth
 $\dot h$ as well as the resultant creep-rates
 ${{\dot \varepsilon }}$ clearly decrease with increasing creep time, but never run in a plateau. Accordingly, indentation creep tests were also carried out for 2 h on fused silica. In comparison with ufg-Al, fused silica shows a significantly lower change in indentation depth [Fig. A1(c)] and thus a lower creep rate [Fig. A1(d)]. Generally, the increasing indentation depth is mainly caused by plastic deformation processes due to the applied constant load during the creep experiment. However, a pile-up formation or grain coarsening during creep might also lead to an increasing contact area and thus to an increasing creep rate or to a reduced hardness.
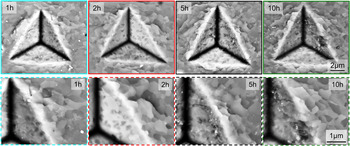
The resultant impressions from the long-term nanoindentation were intensively studied using SEM and FIB (Fig. A2). Magnifying the grains along the indenter edges show no significant grain coarsening during the long-term indentation experiments. By evaluating the projected contact areas (Ac−SEM) from these SEM images, a good agreement between the contact areas, determined from the dynamic CSM method and Ac−SEM was found. Therefore, additional pile-up effects or grain coarsening can be neglected here for the evaluation of the nanoindentation creep data.
SEM images of different indentations in ufg-Al varying the applied creep time (according to Fig. A1).