Implications
An experimental model for studying dairy cows that differ in the extent of peripartal mobilization of body reserves was successfully established. The model’s key elements comprise preselecting cows for normal v. high body condition by 8 weeks before dry-off, and differential feeding of the two groups until dry-off to further increase or to maintain the body condition score (BCS). The targeted difference in mobilization of body reserves was sustained during the dry period and the subsequent 12 weeks of lactation. Concordant differences in blood metabolites and in two out of six metabolic hormones investigated were observed.
Introduction
Overconditionend cows loose relatively more of their body condition in early lactation and have reduced dry matter intake (DMI) and, due to increased lipolysis, greater circulating concentrations of non-esterified fatty acids (NEFA) than thinner cows (Drackley et al., Reference Drackley, Overton and Douglas2001). The NEFA and ketone bodies produced therefrom can be oxidized in several peripheral tissues in the body for generating energy and also serve as substrate for mammary fatty acid synthesis. When the liver’s capacity for oxidation and export of NEFA is exceeded, NEFA are re-esterified to triglycerides and can thus lead to a fatty liver syndrome, while hyperketonaemia may result in ketosis (Drackley et al., Reference Drackley, Overton and Douglas2001). Precalving BCS and precalving feeding level have been demonstrated to exert both interdependent and independent effects on production and health characteristics of transition dairy cows (Roche et al., Reference Roche, Meier, Heiser, Mitchell, Walker, Crookenden, Riboni, Loor and Kay2015). We are particularly interested in studying cows that differ in the extent of mobilizing body reserves and thus our main objective was to elaborate an animal model to obtain cows differing in BCS already at dry-off. For achieving this goal, we pre-selected cows based on their history of body condition 15 weeks before calving, to form two groups, one with normal body condition score (NBCS) and one with high body condition score (HBCS). Until drying-off, the two groups were fed with diets differing in energy content for promoting the difference in BCS until dry-off. Thereafter all cows were fed the same diets. Using this experimental approach, we hypothesized that (a) the differences in body condition will be maintained between the groups during the transition into the next lactation, (b) HBCS would mobilize more lipid reserves than NBCS cows and have greater milk fat contents. Besides expecting elevated concentrations of NEFA, β-hydroxybutyrate (BHB) and leptin in serum of HBCS cows, we also hypothesized that (c) HBCS cows would have lower concentrations of insulin, IGF-1 and adiponectin, and also experience more oxidative stress than NBCS cows during early lactation. Moreover, based on reports about leptin-linked increased levels of thyroid hormones in obese as compared with normal-weight human patients (Reinehr, Reference Reinehr2010), we hypothesized that (d) HBCS cows might have elevated thyroid hormone concentrations around parturition.
Material and methods
The described animal experiment was conducted at the experimental station of the Educational and Research Centre for Animal Husbandry, Hofgut Neumuehle, Muenchweiler a. d. Alsenz, Germany. The study covered a period over 29 weeks, starting 15 weeks before the anticipated calving date and ending 14 weeks thereafter. Blood sampling was limited to 7 weeks antepartum (a.p.) until 12 weeks postpartum (p.p.).
Animals and feeding regimen
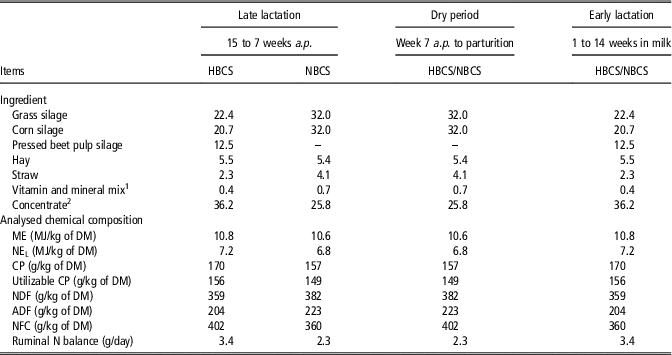
Thirty-eight pregnant multiparous German Holstein dairy cows (average parity: 2.9±0.3, mean±SEM) were allocated 15 weeks before their expected calving date to either the HBCS (n=19) or the NBCS (n=19) group. These two groups were fed differently during late lactation as detailed below to reach different targets for BCS and back fat thickness (BFT) at dry-off (HBCS: >3.75 and >1.4 cm; NBCS: <3.5 and <1.2 cm). The BCS was estimated on a 5-point scale, whereas BFT was assessed in the sacral region using ultra-sonography (AGROSCAN L, ALR 500, 5 MHz, linear-array transducer; Echo Control Medical, Angoulême, France). Both BCS and BFT were continuously monitored biweekly (week 15 a.p. to week 15 p.p.) by one person. The two groups were initially pre-selected from the entire herd (150 lactating cows) by their history of body condition, that is, using BCS and BFT records from the preceding lactation. For this, the BCS and BFT records from all cows at the experimental farm during the year preceding the trial were considered to find cows divergent in both variables for forming two groups with equal numbers. The cows were classified as HBCS cows when mean BFT around the preceding calving was >1.2 cm or maximal BFT during lactation was ⩾1.9 cm and mean BCS >3.2 or maximum BCS ⩾3.75, respectively. The BFT and BCS values for the pre-selection of NBCS cows were below these limits. The cows were also stratified for comparable 305-days milk yields from previous lactations (NBCS: 10 361 kg±302 kg; HBCS: 10 315±437 kg, means±SEM). After pre-selection, cows were allocated 15 weeks a.p. to two feeding groups (for the diets see Table 1) to accentuate the differences in body condition: NBCS animals were fed a low-energy ration [6.8 NEL (MJ/kg of dry matter (DM)], whereas HBCS animals were fed the fresh cow ration with higher energy content [7.2 NEL (MJ/kg of DM)], from weeks 15 to 7 before the anticipated calving date. During the subsequent dry-off period, both groups received the same ration, followed by the same fresh-cow ration in lactation. All diets were fed as total mixed ration (TMR) consisting of 63% roughage and 37% concentrate in the high-energy ration, or 74% roughage and 26% concentrate in the low-energy ration. Samples of all individual components of the TMR as well as the concentrate feed were collected biweekly and stored at −20°C until analysis. To determine the DM content, feed samples were dried at 60°C for 24 h and then at 105°C for 3 h. The nutrient composition of the feed samples was analysed according to the official recommendations of the Association of German Agricultural Analytic and Research Institutes (Naumann and Bassler, Reference Naumann and Bassler2004). Samples were analysed for DM, crude ash, CP, utilizable CP, crude fat, crude fibre, ADF, NDF and non-fibre carbohydrytes, whereas the minerals calcium, phosphorus, magnesium, sodium and potassium were analysed by X-ray fluorescence analysis. The energy content of the diet (ME and NEL) was calculated according to the German Society of Nutrition Physiology (GfE, 2009). Ingredients and nutrient composition are shown in Table 1. The rations were balanced to meet the nutritional requirements of cows according to the recommendations of the GfE (2001). Animals were housed in an open barn, with permanent free access to feed and water. The diet was provided twice daily while cows had access to several feeders. Individual daily feed intake was recorded from week 3 a.p. until week 14 p.p. using an electronic feeding system (Roughage Intake Control System; Insentec B.V., Marknesse, The Netherlands); due to the conditions at the research farm, earlier prepartum intake could not be recorded. From all cows BW was determined by an electric scale on a weekly basis a.p., and twice daily p.p. after each milking. Cows were milked twice daily at 0500 and 1530 h in a milking parlour (GEA Farm Technologies GmbH, Boenen, Germany).
Ingredient composition and chemical composition (% of dry matter (DM), unless otherwise noted) of rations during the observation period for cows of the high body condition score (HBCS) and normal body condition score (NBCS) group

a.p.=Antepartum; ME=metabolizable energy; NEL=net energy for lactation; NFC=non-fibre carbohydrate.
1 Provided per kilogram total mixed ration (on DM basis): calcium, 0.36 g; phosphorus, 0.36 g; sodium, 0.36 g; magnesium, 0.40 g; zinc, 28 mg; manganese, 17 mg; copper, 6.0 mg; cobalt, 0.24 mg; iodine, 0.80 mg; selenium, 0.21 mg; vitamin A, 4.000 IU, vitamin D, 600 IU, vitamin E, 20 mg (RINDAMIN K11 ATG; Schaumann, Pinneberg, Germany).
2 Concentrate portion consisted of barley (25% of DM), corn grain (31% of DM), soya bean meal (18% of DM) and canola meal (26% of DM).
The calculations for the net energy requirement for maintenance (NEM), pregnanacy and those for lactation (NEL), as well as the milk energy concentrations were made according to the guidelines of the GfE (2001) as follows:
NEM (MJ NEL/day)=0.293 × BW0.75;
Maintenance and pregnancy (6 to 4 weeks a.p.; MJ NEL/day): NEM+13;
Maintenance and pregnancy (3 weeks a.p. until calving; MJ NEL/day): NEM+18;
Milk energy concentration (MJ NEL/kg)=0.38 × milk fat (%)+0.21 × milk protein (%)+0.95;
Energy requirement for lactation NEL (MJ NEL/day)=[milk energy concentration (MJ NEL/kg)+0.086] × milk yield (kg/day);
Net energy balance (EB, MJ NEL/day)=energy intake (MJ NEL/day)−NEM (MJ NEL/day) −NEL (MJ NEL/day);
Energy intake=daily DMI × energy content of the TMR (NEL/kg DM).
Energy-corrected milk (ECM) was calculated based on the equation of the German Agricultural Society (Deutsche Landwirtschaftsgesellschaft, 2000):
ECM (kg/day)=milk yield (kg/day) × [1.05+(milk fat (%) × 0.38+milk protein (%) × 0.21)]/3.28.
Analyses in milk and blood samples
Proportional milk samples were collected weekly until 14 weeks p.p. and pooled from two consecutive milkings (0500 and 1530 h; 50 : 50 vol/vol). Milk fat, protein, lactose, urea and somatic cell counts were assessed using a milk analyser based on Fourier transform IR spectroscopy (Bentley FTS; Bentley Instruments Inc., Chaska, MN, USA) at the laboratory of the milk recording organization, Milchprüfring Baden-Württemberg e.V., Kirchheim, Germany. In addition, from week 7 a.p. until week 12 p.p., blood was collected weekly from the V. coccygea with S-Monovettes® (Sarstedt, Nümbrecht, Germany), after the morning milking but before providing fresh feed. Blood samples were kept at room temperature until coagulated (max. 60 min), centrifuged for 10 min at 2000×g and subsequently stored at −20°C until analysis. Serum concentrations of NEFA, BHB, glucose, leptin, haptoglobin, adiponectin, derivatives of reactive oxygen metabolites (dROM) and total ferric reducing antioxidant power (FRAP) were analysed weekly, whereby leptin measurements were limited to the time from week 7 a.p. until week 5 p.p., and to week 12 p.p. Serum BHB, glucose and NEFA were measured at the Institute of Animal Nutrition, Friedrich-Loeffler-Institute (FLI) in Braunschweig, Germany, using an automatic photometric analysing system (Eurolyser; Type VET CCA, Salzburg, Austria). Leptin, haptoglobin and adiponectin were measured by in-house developed ELISAs (Sauerwein et al., Reference Sauerwein, Heintges, Hennies, Selhorst and Daxenberger2004; Hiss et al., Reference Hiss, Weinkauf, Hachenberg and Sauerwein2009; Mielenz et al., Reference Mielenz, Mielenz, Singh, Kopp, Heinz, Häussler and Sauerwein2013). For the leptin ELISA, the intra- and inter-assay CV were 6.3% and 13.9%, the standard curve reached from 0.11 to 27 ng/ml, and the measuring range was 0.3 to 7 ng/ml. The corresponding numbers for haptoglobin were 3.9% and 12.2%, the range of the standard curve was 0.012 to 9 µg/ml with a measuring range of 0.1 to 2 µg/ml, and for adiponectin 4.5% and 5.6%, with a standard curve ranging from 0.019 to 20 ng/ml, and a measuring range of 0.3 to 7 ng/ml, respectively. Serum dROM were measured using N,N-diethyl-para-phenylendiamine as chromogene with the modifications of Regenhard et al. (Reference Regenhard, Nakov and Sauerwein2014); results are given as H2O2 equivalents; the intra- and inter-assay CV were 6.3% and 10.0%, respectively. Total FRAP was measured according to Benzie and Strain (Reference Benzie and Strain1996), as the ability of serum to reduce Fe3+ (FeCl3∙6 H2O) to Fe2+; values are given as µmol Fe2+/l. The intra- and inter-assay CV were 2.7% and 2.6%. Thyroid hormone concentrations, free 3-3′-5-triiodothyronine (fT3) and free thyroxine (fT4), were analysed in weeks 7, 3 and 1 a.p. as well as in weeks 1, 2, 3, 5, 7, 9 and 12 p.p. at the Central Laboratory of the University Hospital in Bonn, Institute of Clinical Chemistry and Clinical Pharmacology, by electro-chemiluminescent immunoassay (ELICA; Roche Diagnosis GmbH, Mannheim, Germany). Circulating insulin and IGF-1 were analysed in weeks 7 and 2 a.p. and in weeks 1 and 4 p.p. at the clinic for cattle, University of Veterinary Medicine (TiHo) Hannover. For IGF-1, a radioimmunoassay (RIA) was used (A15729, IGF-I IRMA; Immunotech, Beckman Coulter, Brea, CA, USA). The intra- and inter-assay CV were 5.1% and 9.3%, respectively, the limit of detection (LOD) was 33 ng/ml. Insulin concentrations were determined via RIA (IM3210, Insulin IRMA KIT; Immunotech, Beckman Coulter). The intra- and inter-assay CV were 7.6% and 10.7%, respectively, the LOD was 3 µU/ml.
The threshold concentrations of BHB in serum used for defining hyperketonaemia or subclinical ketosis were >1.2 and >2.5 mM for clinical ketosis, respectively (Schulz et al., Reference Schulz, Frahm, Meyer, Kersten, Reiche, Rehage and Dänicke2014).
Statistical analyses
Statistical analysis of the data was carried out using SPSS software (IBM® SPSS® Statistics 24.0). Data were analysed using the mixed model ANOVA with repeated measurements. The Bonferroni correction method was used for correction of multiple comparisons. The mixed models used contained the fixed effects of treatment (group), time (weeks relative to calving), and the interaction between treatment and time, while the individual ‘cow’ was considered as a random factor. Lactation number was considered as a covariate. When insignificant it was excluded from the model. The level of significance was set at P⩽0.05 and a trend was defined at 0.05<P⩽0.10.
The residuals of each variable were tested for normal distribution. For mixed model analyses, data were transformed by a two-step approach to become normally distributed as described by Templeton (Reference Templeton2011). In step 1, variables were transformed into a percentile rank, resulting in uniformly distributed probabilities. In step 2, results from the first step were inverse-normal transformed, creating variables consisting of normally distributed z-scores.
For all graphs, non-transformed data (means±SEM) were used.
Relationships between variables were tested by Spearman correlation. Potential associations were tested for the periods before and after parturition, as well as for the whole experimental period. Only correlations with r>0.4 and P<0.05 are reported.
Results and discussion
The general relationship between overcondition and risk for metabolic diseases, in particular ketosis, is known from both retrospective analyses of spontaneously developed overcondition (e.g. Smith et al., Reference Smith, Friggens, Ashworth and Chagunda2017) and experimental overconditioning of cows by feeding more energy-dense diets during either the entire dry period, or the far-off or the close-up phase of the dry period (e.g. Dann et al., Reference Dann, Litherland, Underwood, Bionaz, D’Angelo, McFadden and Drackley2006). In some studies, in which different energy levels were tested during the dry period, cows were preselected based on their spontaneously developed BCS (e.g. Schulz et al., Reference Schulz, Frahm, Meyer, Kersten, Reiche, Rehage and Dänicke2014), or were target-fed before drying off to achieve groups differing in BSC (Roche et al., Reference Roche, Macdonald, Schütz, Matthews, Verkerk, Meier, Loor, Rogers, McGowan, Morgan, Taukiri and Webster2013 and Reference Roche, Meier, Heiser, Mitchell, Walker, Crookenden, Riboni, Loor and Kay2015). The latter approach is similar to the one taken herein, except that we did a preselection of the pluriparous cows according to their spontaneously developed BCS well before dry-off, and limited the time of differential feeding to 8 weeks before drying off.
Performance in high- and normal-conditioned cows
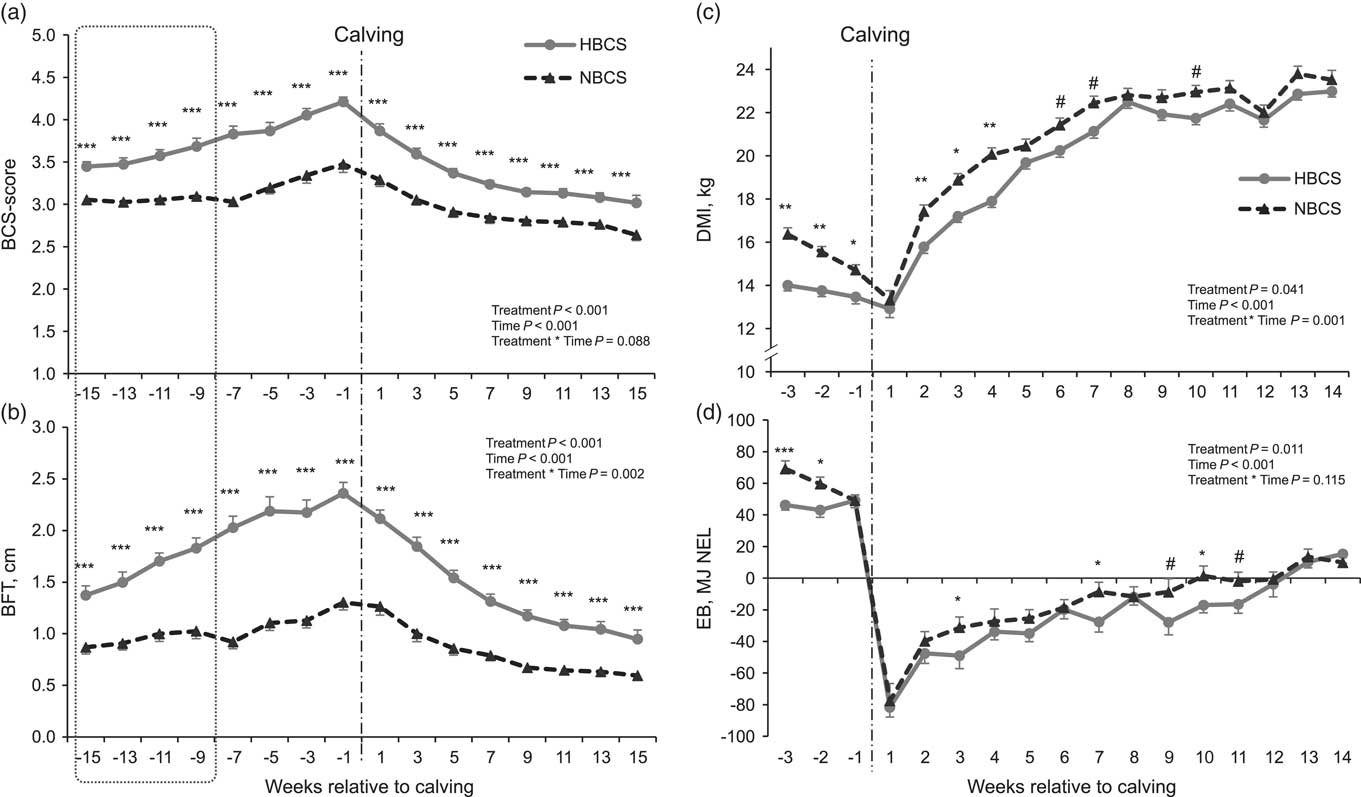
The variables describing body condition and energy status (BCS, BFT, DMI and EB) in HBCS and NBCS cows are presented in Figures 1a to d. The classification according to BCS and BFT 15 weeks a.p. yielded initial differences of about 0.4 BCS points and 0.5 cm BFT. Feeding different energy levels from 15 weeks a.p. until dry-off augmented the differences to 0.8 BCS units and 1.1 cm BFT in week 7 a.p. The targeted BCS and BFT at dry-off (HBCS: >3.75 and >1.4 cm; NBCS: <3.5 and <1.2 cm) were thus achieved. During the dry period, when both groups received the same diets, they increased their body condition whereby the previously established differences were largely maintained until the week before calving (Δ=0.7 BCS points and 1.1 cm BFT). Body condition declined during lactation in both groups, but the losses were bigger in the HBCS than in the NBCS cows. At the end of the observation period in week 15, the difference between the groups was about the same as at the initial grouping in the preceding lactation. For explaining the divergent development of body condition in individual cows kept under the same management and feeding conditions, genetic predisposition as well as feed intake, milk yield and feed conversion ratio likely play a role (Rocco and McNamara, Reference Rocco and McNamara2013). Feed intake data recorded a.p. in our study were limited to the last 3 weeks before calving; intake was greater in NBCS than in HBCS cows until calving when both groups reached the same nadir 1 week p.p. During the subsequent weeks NBCS cows had a faster increase in feed intake; the difference between groups levelled off in week 11 p.p.
Changes of (a) body condition score (BCS) and (b) back fat thickness (BFT) from 15 weeks antepartum (a.p.) to 15 weeks postpartum (p.p.) as well as (c) dry matter intake (DMI) and (d) energy balance (EB) from 3 weeks a.p. until 14 weeks p.p. (time=weeks relative to calving) in high BCS (HBSC) or normal BCS (NBCS) cows. The area framed by dotted lines indicates the time of differential feeding of HBCS and NBCS cows. The vertical dashed line illustrates calving. Results are presented as means±SEM. Significant differences between the groups are indicated with asterisks (*) when P⩽0.05, or (**) when P⩽0.01, or (***) when P⩽0.001 at a given time point, respectively. Trends (P⩽0.10) for differences between the groups at a given time point are indicated by (#).

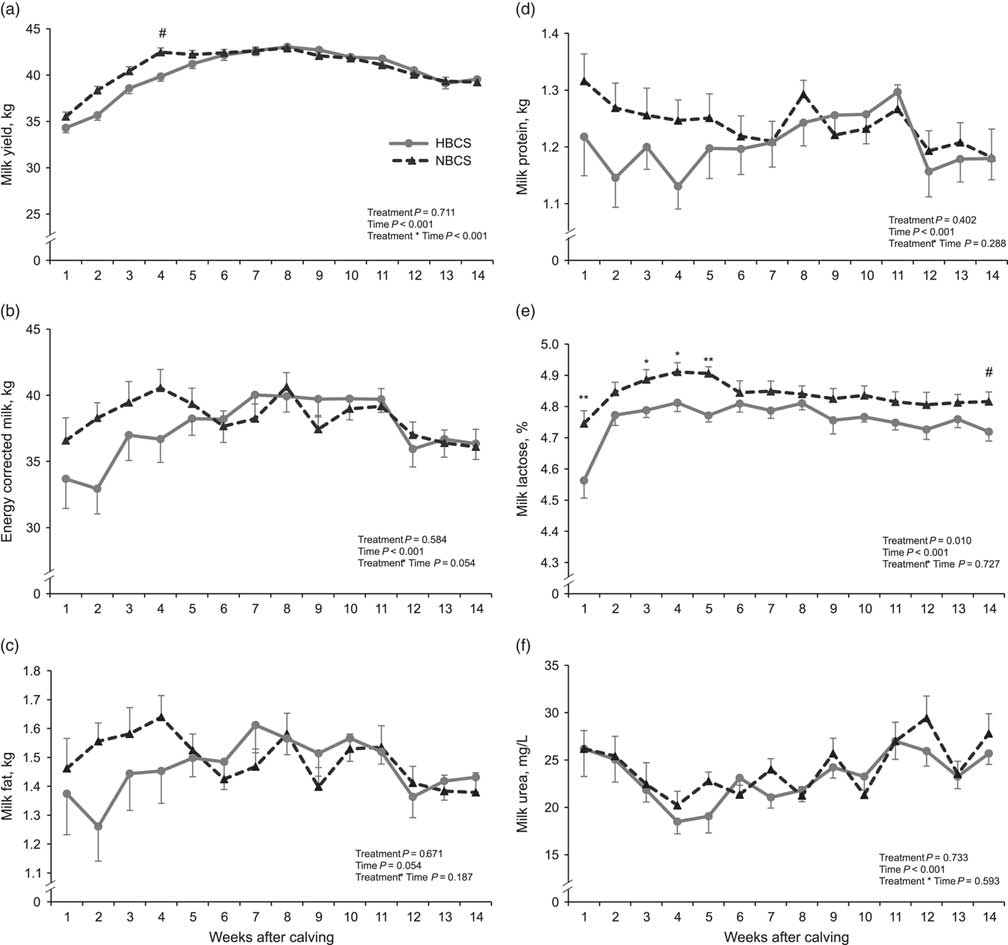
The calculated EB was higher in NBCS than in HBCS cows a.p. and also reached positive values about 2 weeks earlier than in the HBCS group. These differences were rather attributable to feed intake than milk yield since neither milk nor ECM yield differed between the groups. However, there was a group by time interaction for milk yield and a trend for such an interaction for ECM. The NBCS tended to have greater yields during the first 4 weeks of lactation; thereafter the yield curves were approximately at the same level (Figure 2a and b). The 100-day milk yield (weeks 1 to 14) was also the same in both groups (HBCS: 3816±114 kg; NBCS: 3875±93 kg). With the exception of lactose, milk composition including urea, and also protein and fat yield were not different between the groups in general (Figure 2c, d and f); for lactose the concentrations tended to be greater in NBCS cows as well, in particular during the first 5 weeks p.p. (Figure 2e). These results are contrary to several reports in the literature showing that milk yield, partly including also protein, fat and lactose yields, increased with BCS (e.g. Roche et al., Reference Roche, Friggens, Kay, Fischer, Stafford and Berry2009, Reference Roche, Macdonald, Schütz, Matthews, Verkerk, Meier, Loor, Rogers, McGowan, Morgan, Taukiri and Webster2013 and Reference Roche, Meier, Heiser, Mitchell, Walker, Crookenden, Riboni, Loor and Kay2015). The reason for the contradicting results might be attributable to different feeding and management conditions (e.g. many of the aforementioned studies were done in pasture-based systems), and also to the absolute range of BCS achieved in our HBCS animals: Roche et al. (Reference Roche, Lee, Macdonald and Berry2007) pointed out that the increase in milk yield and in fat-corrected milk was getting smaller with BCS ⩾3.0 at calving. However, elevated BCS was also reported to result in reduced milk production (Roche et al., Reference Roche, Friggens, Kay, Fischer, Stafford and Berry2009). Taking together, the mostly insignificant results for yields, the HBCS cows albeit eating less than NBSC cows, were able to maintain milk performance at a similar level as the NBCS cows, likely by the greater mobilization of body reserves compared to NBCS cows.
Yields of (a) milk, (b) energy-corrected milk, (c) milk fat and (d) milk protein, and concentrations of (e) lactose and (f) urea in milk in high body condition score (HBCS) or normal body condition score (NBCS) cows from 1 to 14 weeks postpartum (time=weeks relative to calving). Results are presented as means±SEM. Significant differences between the groups are indicated with asterisks (*) when P⩽0.05 or (**) when P⩽0.01 at a given time point, respectively. Trends (P⩽0.10) for differences between the groups at a given time point are indicated by (#).

Serum metabolites
Concentrations of non-esterified fatty acids, β-hydroxybutyrate and glucose
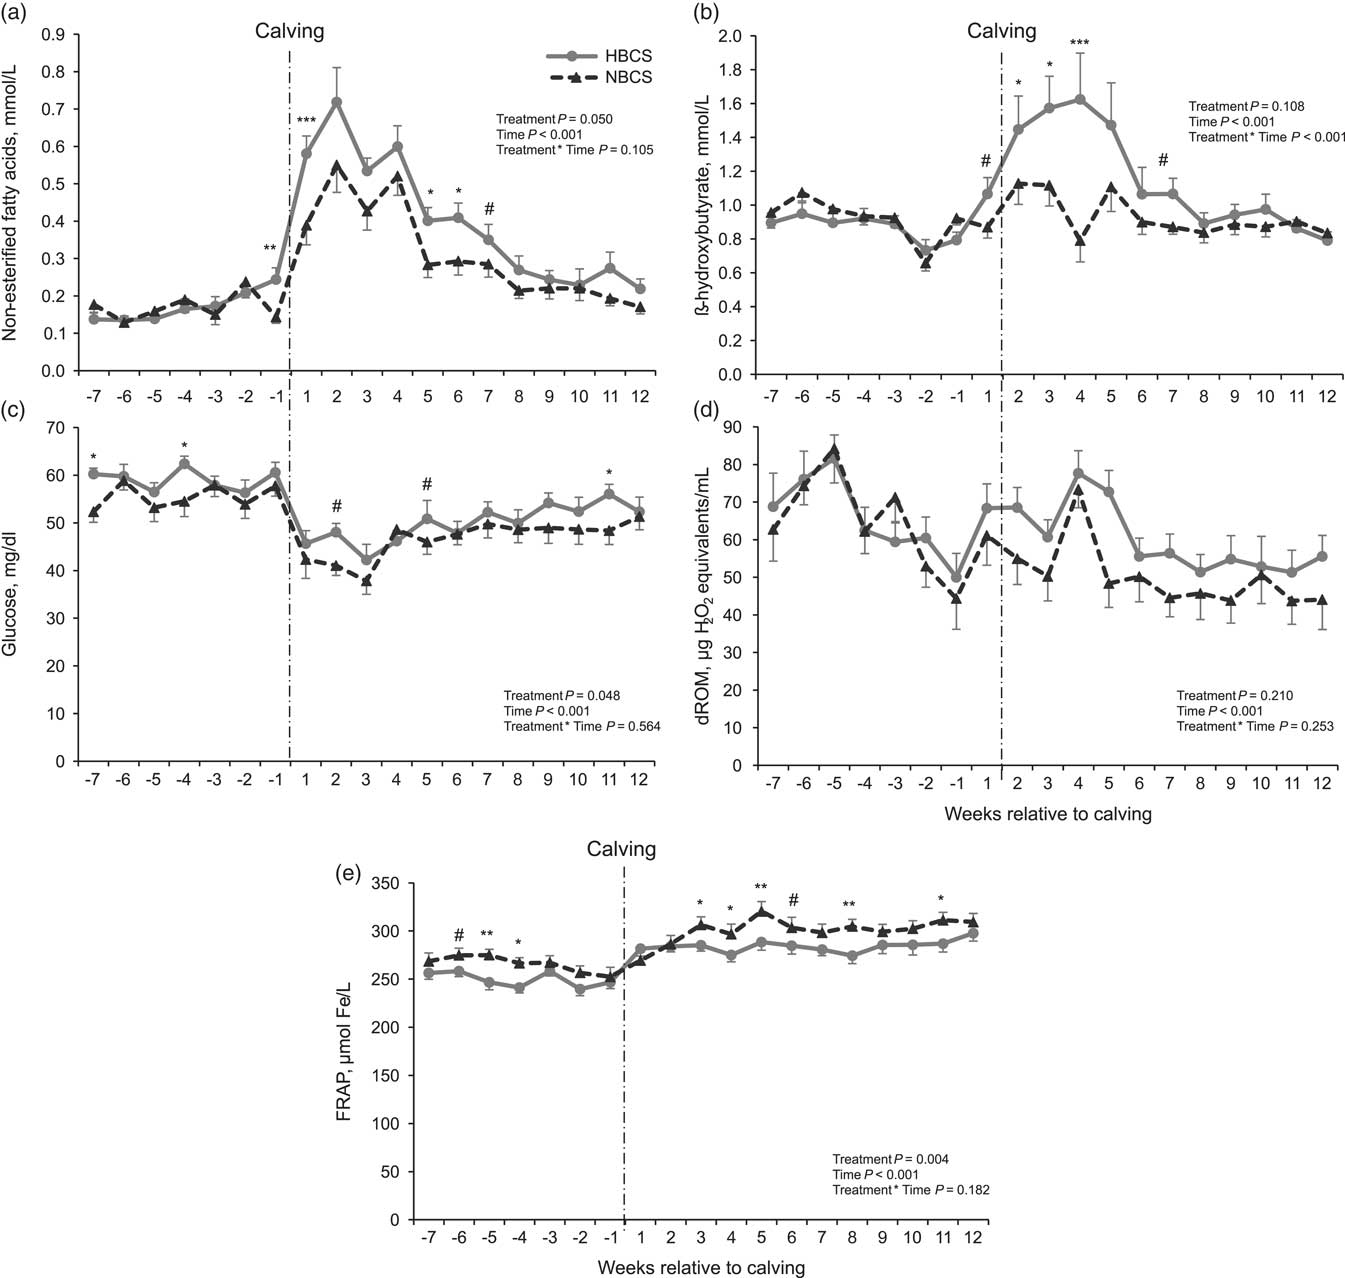
The NEFA concentrations tend to increase during late gestation due to reduced feed intake (Bell, Reference Bell1995) at a time when foetal growth reaches its exponential phase. Moreover, when nutrient intake cannot meet the requirements for the increasing demands also for the mammary gland, body reserves, mainly from adipose tissue, are mobilized to compensate the lack of energy intake. Expectedly, the circulating NEFA concentrations increased towards calving and were further elevated during lactation (Figure 3a). The concentrations in the HBCS group increased earlier and to greater levels than in the NBCS group indicating that lipolysis was more pronounced than in NBCS cows. Positive correlations between the NEFA concentrations and BFT p.p. (r=0.456; P<0.001) and negative ones with DMI and EB (r=−0.491 and r=−0.469, respectively; P<0.001) were observed. The uptake of NEFA by the mammary gland for milk fat synthesis is greatest at the onset of lactation; in later stages de novo synthesis of fatty acids increases (Bell, Reference Bell1995). However, as pointed out above, the greater NEFA circulating concentrations in HBCS cows did not result in significant quantitative changes of milk fat content or yield. In phases of energy deficit, NEFA are only incompletely oxidized to acetyl-CoA and serve ketogenesis including the production of BHB. However, NEFA as well as ketone bodies may also provide energy for tissues, other than the mammary gland (Drackley et al., Reference Drackley, Overton and Douglas2001). As indicated by the group × time interaction, the time course of the BHB concentrations in HBCS cows was different from the one in NBCS cows: the postpartal increase was largely limited to HBCS cows (Figure 3b). In addition, hyperketonaemia (BHB >1.2 mmol/l) was more frequent in HBCS cows (HBCS cows: 83% v. NBCS cows: 61%) and also lasted longer compared to NBCS cows. These observations seem to be in line with the lesser DMI in HBCS cows, since it is probable that increased hepatic fatty acid oxidation, as a consequence of plasma NEFA and hepatic fatty acid uptake, created a satiety signal in these cows according to hepatic oxidation theory (Allen et al., Reference Allen, Bradford and Oba2009).
Serum concentrations of (a) non-esterified fatty acids, (b) β-hydroxybutyrate, (c) glucose, (d) derivatives of reactive oxygen metabolites (dROM) and (e) ferric reducing ability of plasma (FRAP) in high body condition score (HBCS) or normal body condition score (NBCS) cows from 7 weeks antepartum to 12 weeks postpartum (time=weeks relative to calving). Results are presented as means±SEM. Significant differences between the groups are indicated with asterisks (*) when P⩽0.05, or (**) when P⩽0.01, or (***) when P⩽0.001 at a given time point, respectively. Trends (P⩽0.10) for differences between the groups at a given time point are indicated by (#).

For glucose, slightly greater (~15%) circulating concentrations were observed in HBCS cows compared to the NBCS group both a.p. and p.p. (Figure 3c). With the onset of lactation, the requirements for glucose rapidly increase to serve lactose production (Bell, Reference Bell1995). The use of glucose in other peripheral tissues is concomitantly decreased (Bell, Reference Bell1995). Increased body condition before calving was reported to be associated with greater blood glucose concentrations, suggesting that less glucose was used for milk production in cows with higher BCS (Dechow et al., Reference Dechow, Baumrucker, Bruckmaier and Blum2017). The mammary uptake of glucose was shown to be independent of the arterial concentrations (Nielsen et al., Reference Nielsen, Madsen and Hedeboe2001) and greater circulating glucose but lower milk lactose concentrations in HBCS cows in our study are in line with this. Both ketones and NEFA can be used as energy source by various tissues in the body including the mammary gland in favour of milk production (Drackley et al., Reference Drackley, Overton and Douglas2001) and thus may explain why milk yield was not compromised in HBCS cows.
Variables indicative for the oxidative status
Reactive oxygen metabolites in serum indicate elevated production of free radicals or a decreased antioxidant protection. The values of dROM changed with time, but were not different between the two BCS groups (Figure 3d). Numerically higher values were observed for HBCS cows after calving compared to NBCS cows and may thus considered to be in line with earlier findings that cows with greater BCS and pronounced BCS losses around calving had also greater dROM values (Bernabucci et al., Reference Bernabucci, Ronchi, Lacetera and Nardone2005). When comparing the FRAP values, reflecting the antioxidative capacity, changes with time were similar in both groups with lowest values before calving, but the HBCS cows had lower values (Figure 3e). The increasing output of antioxidants via colostrum together with the decreasing input with feed likely explains for the time course. The more pronounced depression in DMI of the HBCS might account, at least partly, for the difference between the two BCS groups.
Metabolic hormones assessed in serum
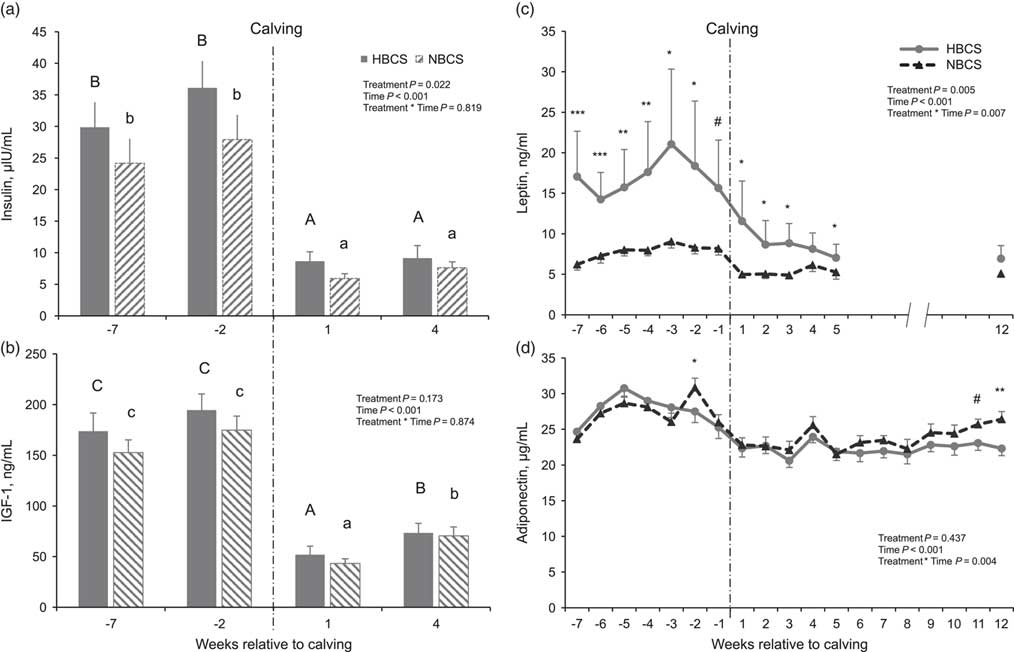
In both groups, insulin and IGF-1 had lower concentrations in lactation than in pregnancy (Figure 4a and b). This is in line with the typical hypoinsulinaemia in early lactation which decreases lipogenesis, promotes lipolysis and reduces glucose uptake by peripheral tissues thus facilitating the insulin-independent mammary glucose uptake (Bell, Reference Bell1995). Hypoinsuliaemia is also related to the uncoupling of the somatotropic axis which in turn leads to decreased secretion of IGF-1 (Butler et al., Reference Butler, Marr, Pelton, Radcliff, Lucy and Butler2003). When considering all time points, HBCS cows had greater insulin concentrations than NBCS cows, but differences could not be assigned to individual time points when doing Bonferroni-corrected multiple comparisons. Greater insulin but also glucose concentrations in HBCS cows indicate decreased insulin sensitivity (IS). The notion that IS decreases with BCS is quite common, but largely relies on surrogate indices for IS and not on clamp studies considered as ‘gold standard’ for assessing IS. However, the latter, performed in dry or late lactating cows are in support of decreasing IS with increased BCS (e.g. de Koster et al., Reference de Koster, Hostens, van Eetvelde, Hermans, Moerman, Bogaert, Depreester, van den Broeck and Opsomer2015). In our study, the insulin concentrations were correlated with glucose (r=0.464; P<0.001), IGF-1 (r=0.658; P<0.001), NEFA (r=−0.579; P<0.001) and with leptin (r=0.517; P<0.001). The IGF-1 concentrations in serum were correlated to the EB (r=0.721; P<0.001), NEFA (r=−0.612; P<0.001) and also with leptin (r=0.435; P<0.001).
Serum concentrations of (a) insulin, (b) IGF-1, (c) leptin and (d) adiponectin in high body condition score (HBCS) or normal body condition score (NBCS) cows (time=weeks relative to calving). Results are presented as means±SEM. Significant differences between the groups are indicated with asterisks (*) when P⩽0.05, or (**) when P⩽0.01, or (***) when P⩽0.001 at a given time point, respectively. Trends (P⩽0.10) for differences between the groups at a given time point are indicated by (#). A,BDifferent capital letters indicate differences between the time points in the HBCS cows. a,bDifferent lowercase letters stand for differences between the time points in the NBCS cows.

Leptin is involved in controlling energy homeostasis as well as feed intake and is positively associated with BCS, BW and adipocyte size (Locher et al., Reference Locher, Häussler, Laubenthal, Singh, Winkler, Kinoshita, Kenéz, Rehage, Huber, Sauerwein and Dänicke2015). During the dry period, HBCS cows had up to 2.8-fold greater leptin concentrations than the NBCS cows (Figure 4c). The antepartal decrease of leptin started also about 2 weeks earlier in the HBCS than in the NBCS cows. Comparable results were reported by Kokkonen et al. (Reference Kokkonen, Taponen, Anttila, Syrjälä-Qvist, Delavaud, Chilliard, Tuori and Tesfa2005) with a more pronounced decrease of circulating leptin in high-mobilizing cows from the last week a.p. until the 1st week in milk; the leptin concentrations in the latter study also remained higher p.p. in fatter compared with thinner cows. As expected, circulating leptin was also correlated with BW and BCS (r=0.482 and r=0.493, respectively; P<0.001).
Adiponectin is known for its insulin sensitizing effects and in line with this, its circulating concentrations during the transition phase of dairy cows decrease towards calving and reach lowest values during the 1st weeks of lactation (Sauerwein and Häußler, Reference Sauerwein and Häußler2016). This time course was also observed in the present study (Figure 4d). As indicated by the time by group interaction, the curves of HBCS and NBCS curves were not parallel but crossed: a.p. the greater values were mostly observed in HBCS values but p.p., the values of the NBCS group exceeded those of the HBCS cows. The potential underlying mechanisms for the time course in general and the interaction in particular are largely unknown. A comprehensive study testing different potential effectors of circulating adiponectin in dairy cows, yielded EB as a regulator, but neither lipid mobilization nor sustained changes in insulin, growth hormone, leptin or fatty acids affecting adiponectin (Krumm et al., Reference Krumm, Giesy, Caixeta, Butler, Sauerwein, Kim and Boisclair2017).
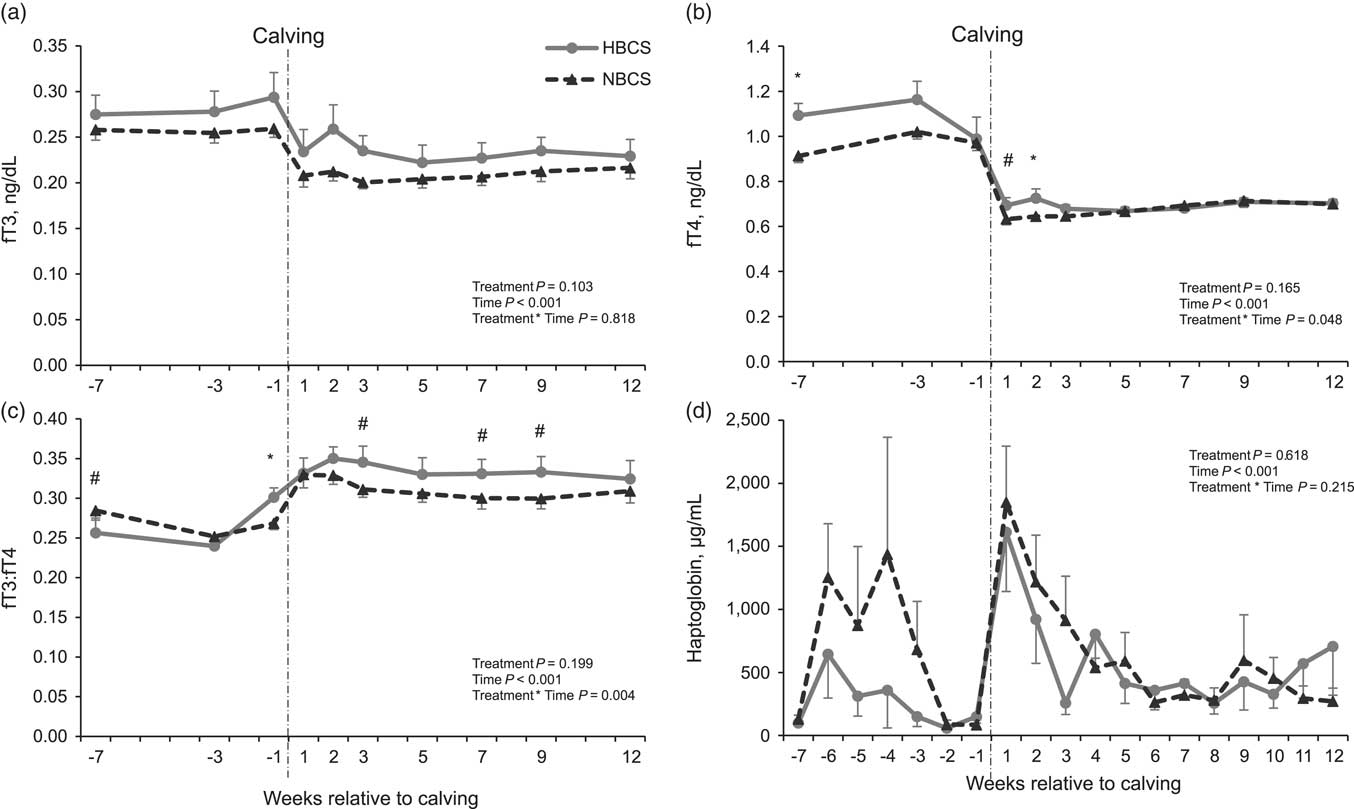
It is well established that thyroid hormone status correlates with BW and basal metabolic rate. The thyroid hormones T4 and T3 are secreted by the thyroid gland; T3 is also peripherally generated by deiodination of T4. Body fat content and thyroid status could be linked via leptin, since leptin concentrations are related to the release of thyroid-stimulating hormone (TSH) (Reinehr, Reference Reinehr2010). In our study, the fT4 concentrations in serum were indeed positively correlated with circulating leptin (r=0.547; P<0.001) providing some support for a relationship between leptin and thyroid status. However, we did not assess TSH in our study. The changes we observed with time for T3 and T4 largely correspond to previous reports (Nowroozi-Asl et al., Reference Nowroozi-Asl, Aarabi and Rowshan-Ghasrodashti2016); for T4, the peripartal decrease was more pronounced in our study than in the one from Nowroozi-Asl et al. (Reference Nowroozi-Asl, Aarabi and Rowshan-Ghasrodashti2016). The fT3 concentrations were not different between the groups (Figure 5a). For fT4 as well as for ratio fT3/fT4 time by group interactions were observed: HBCS cows had greater fT4 concentrations and a lower fT3/fT4 ratio than NBCS cows a.p., whereas p.p. the difference in fT4 had disappeared and the ratio fT3/fT4 was greater in the HBCS than in the NBCS cows. Albeit we observed no group effect for fT4, we found positive correlations between fT4 and BW (r=0.448; P<0.001), and EB (r=0.479; P<0.001). An increased fT3/fT4 ratio was shown to be associated with an increased risk of metabolic syndrome and insulin resistance in humans (Park et al., Reference Park, Park, Jung, Jin, Park, Ahn and Lee2017). However, taken together the data obtained for fT3, fT4 or fT3/fT4 in our study do not allow for a conclusive interpretation since the differences between groups were only small and mostly insignificant.
Serum concentrations of (a) free triiodothyronine (fT3), (b) free thyroxine (fT4), (c) the ratio fT3/fT4 and of (d) haptoglobin in high body condition score (HBCS) or normal body condition score (NBCS) cows (time=weeks relative to calving). Results are presented as means±SEM. Significant differences between the groups are indicated with asterisks (*) when P⩽0.05 at a given time point. Trends (P⩽0.10) for differences between the groups at a given time point are indicated by (#).

Haptoglobin
Parturition is related to inflammatory processes and acute phase proteins like Haptoglobin (Hp) are increased in the circulation around calving (Hachenberg et al., Reference Hachenberg, Weinkauf, Hiss and Sauerwein2007). Haptoglobin is mainly produced by the liver, but is also expressed in adipose tissue, undergoing similar changes as hepatic messenger RNA abundance and the circulating concentrations (Saremi et al., Reference Saremi, Al-Dawood, Winand, Müller, Pappritz, Soosten, von, Rehage, Dänicke, Häussler, Mielenz and Sauerwein2012). This time course was also observed in our study and without group differences (Figure 5d). The potential contribution of visceral and subcutaneous fat to the circulating concentration was estimated to amount to only 0.02% of the hepatic one (Saremi et al., Reference Saremi, Al-Dawood, Winand, Müller, Pappritz, Soosten, von, Rehage, Dänicke, Häussler, Mielenz and Sauerwein2012). Indeed, when grouping cows according to their BSC, or the extent of the BCS loss from 2 weeks a.p. to 4 weeks p.p., Hachenberg et al. (Reference Hachenberg, Weinkauf, Hiss and Sauerwein2007) found no differences in circulating Hp. Reports about associations of Hp with NEFA or BHB are inconsistent: some studies showed positive correlations (e.g. Hiss et al., Reference Hiss, Weinkauf, Hachenberg and Sauerwein2009), others did not (e.g. Hachenberg et al., Reference Hachenberg, Weinkauf, Hiss and Sauerwein2007). In the present study Hp was not correlated with BHB and only weakly with NEFA (r=0.24; P⩽0.05). Negative correlations were observed with insulin (r=−0.486; P<0.001) and IGF-1 (r=−0.712; P<0.001), respectively. However, the individual Hp concentrations showed considerable variation, in particular 6 to 3 weeks a.p. in our study, with numerically higher concentrations in NBCS cows compared to HBCS cows. There were no clinical signs recorded in the animals with elevated Hp and thus the reasons for the variation remain unexplained.
Conclusion
The experimental approach taken yielded cows differing in BCS at dry-off and maintaining this difference until calving and over 14 weeks of lactation. Cows calving with HBCS were metabolically challenged during early lactation due to a more sever negative EB and intense mobilization of body fat, associated with reduced early lactation DMI. In addition, HBCS at calving was associated with compromised antioxidative capacity, reflected by lower values of FRAP. In contrast to our hypothesis, HBCS cows had greater insulin concentrations than NBCS cows, accompanied by greater glucose concentrations which may indicate reduced IS in HBCS cows. The serum concentrations of IGF-1 were not affected by overconditioning, but were lower in lactation than in pregnancy in both groups. The HBCS cows had greater concentrations of leptin than NBCS cows. Cows calving with HBCS had elevated serum fT4 concentrations and a lower fT3/fT4 ratio than NBCS cow a.p., whereas p.p. ratio of fT3/fT4 followed a reverse pattern as that of a.p. Together, the differences in BCS were accompanied with concomitant changes in blood metabolites and hormones thus confirming the adequacy of the animal model for studying different intensities of mobilization.
Acknowledgements
K. S. is recipient of a scholarship from the H. Wilhelm Schaumann Foundation (Hamburg, Germany). The authors thank M. Schmicke, University of Veterinary Medicine in Hannover, for providing the results of insulin and IGF-1 concentrations, assessed in the frame of the nation-wide German project ‘Opti-Kuh’ financed through the Innovation Fund of the Federal Ministry for Nutrition and Agriculture (BMEL). For their excellent technical assistance and support the authors also thank B. Heitkönig, T. Blees and K. Strack. The study would not have been possible without the Educational and Research Centre for Animal Husbandry, Hofgut Neumuehle since they made the cows available and also supported the animal trial by their staff.
Declaration of interest
The authors declare that they have no conflicts of interest.
Ethics statement
The animal trial was approved by the local authority for animal welfare affairs (Landesuntersuchungsamt Rheinland-Pfalz, Koblenz, Germany [G 14-20-071]).
Software and data repository resources
None of the data were deposited in an official repository.