Implications
It is difficult and expensive to estimate the nitrogen-corrected metabolisable energy (AMEn) values of the feedstuffs used for broilers. The results of this study demonstrate that the implementation of multilayer perceptron networks (MLP) in a meta-analysis is suitable to estimate these energy values. Furthermore, a calculator was created on the basis of the results of the MLP, which allows an efficient way of predicting the AMEn values.
Introduction
Knowledge of the chemical composition and metabolisable energy (ME) of feedstuffs is necessary to provide an adequate supply of nutrients and energy for animals. A variety of feedstuffs and their by-products are used in diets, and it is important to know accurately the dietary nutrients that each contains. The energy content of feedstuffs may be determined using metabolic bioassays (Rodrigues et al., Reference Rodrigues, Rostagno, Albino, Gomes, Barboza and Santana2001; Zhao et al., Reference Zhao, Zhang, Hou and Zhang2008; Wan et al., Reference Wan, Chen, Qi, Peng and Peng2009), which are onerous and time-consuming. Alternative ways to obtain these values include using the composition of feedstuffs and nutritional composition tables, and prediction equations based on the chemical composition of the feedstuffs.
Several studies have developed prediction equations to estimate the ME using regression methods. However, the results obtained using traditional regression methods have been inconsistent (Alvarenga et al., Reference Alvarenga, Rodrigues, Zangeronimo, Freitas, Lima, Bertechini and Fassani2011). An interesting way to obtain prediction equations that yield more consistent results is to combine information derived from data collected under different but related conditions. This method uses regression theory by considering the meta-analysis principle.
Meta-analysis is a relevant method for summarising and quantifying knowledge acquired through previously published research (Sauvant et al., Reference Sauvant, Schmidely, Daudin and St-Pierre2008). Although the papers involve the same subject, in meta-analyses it is important that homogeneous groups of papers are formed. This is one of the greatest difficulties in the development of meta-analysis (Fagard et al., Reference Fagard, Staessen and Thijs1996; Lovatto et al., Reference Lovatto, Lehnen, Andretta, Carvalho and Hauschild2007). In some studies, homogeneous groups of papers used to develop prediction equations for the AMEn of broiler feedstuffs were obtained by combining levels of different factors (Nascimento et al., Reference Nascimento, Rodrigues, Freitas, Bertechini, Lima and Pucci2009 and Reference Nascimento, Rodrigues, Freitas, Allaman, Lima and Reis Neto2011) or by using the multivariate technique of principal components (Mariano et al., Reference Mariano, Lima, Rodrigues, Alvarenga and Nascimento2012).
Neural Networks is a term that denotes sets of connectionist models inspired by the neurological structures and processing function of the central nervous system of living beings, being an adaptive system that changes its structure based on external or internal information that flows through the network (Bishop, Reference Bishop1995; Haykin, Reference Haykin2007). In an artificial neural network (ANN), a neuron processes the weighted inputs and computes a single output by using an activation function. As an ANN consists of an interconnected group of artificial neurons, a neuron processes the received information from other neurons, which are called inputs. Although the neuron is a computational unit, neurons may be combined into layers to create an efficient network that can learn to distinguish behavioural patterns (Haider and Hanif, Reference Haider and Hanif2009).
The ANN has some advantages. The ANN does not need restrictive assumptions and it has the ability to learn general solutions on the basis of the data given for training (adaptive learning), to create its own organisation or representation of the information received during learning time and to analyse complex patterns. Although ANN is considered robust and flexible, there are some drawbacks in its use: it requires a large and high-quality training dataset; it is necessary to compare different architectures to select the best; the variables used in an ANN must be carefully selected a priori; and there is risk of overfitting (Balcean and Ooghe, Reference Balcean and Ooghe2004).
Artificial neural network can be applied with different objectives, such as pattern recognition systems, data processing, function approximation and clustering. The ANN has also been used as a form of prediction. Gheyas and Smith (Reference Gheyas and Smith2011) proposed an ANN for time series forecasting. Okut et al. (Reference Okut, Gianola, Rosa and Weigel2011) predicted body mass index using a regularised neural network. ANN has also been used to predict ME (Ahmadi et al., Reference Ahmadi, Mottaghitalab and Nariman-Zadeh2007 and Reference Ahmadi, Golian, Mottaghitalab and Nariman-Zadeh2008; Perai et al., Reference Perai, Moghaddam, Asadpour, Bahrampour and Mansoori2010). The multilayer perceptron neural network (MLP) has been successfully applied to predict the true metabolisable energy (TMEn) values of meat and bone meal samples (Perai et al., Reference Perai, Moghaddam, Asadpour, Bahrampour and Mansoori2010).
An MLP consists of a set of source nodes, which form the input layer of the network. All others layers are composed of neurons that present computational capacity, as shown in Figure 1. This type of neural network is a progressive network in which the outputs of the neurons are connected only to the inputs of neurons of the next layer, without connections within the layers. Consequently, the input signal propagates through the network, layer by layer, in a progressive direction (Bishop, Reference Bishop1995; Haykin, Reference Haykin2007).
Structure of a multilayer perceptron with two hidden layers.

The objective of this study was to estimate the AMEn values of the energetic and protein concentrate feeds of plant origin used for broilers by using an MLP in a meta-analysis study. It will be created an Excel® AMEn calculator, which can be used by the animal nutritionists to predict AMEn for feedstuff samples.
Material and methods
Data source
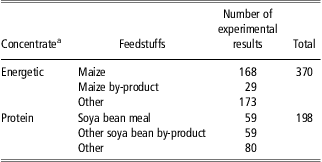
The database used for the meta-analysis has been catalogued and described previously by Nascimento et al. (Reference Nascimento, Rodrigues, Freitas, Bertechini, Lima and Pucci2009 and Reference Nascimento, Rodrigues, Freitas, Allaman, Lima and Reis Neto2011). A bibliographical review of studies carried out in Brazil was performed to collect information concerning the AMEn values and chemical composition of feedstuffs for broilers. All feedstuffs were of plant origin. The database included a total of 568 experimental results corresponding to 370 energetic concentrate and 198 protein concentrate samples evaluated in experiments executed from 1967 to 2007 (Table 1).
Number of experimental results considered in this study grouped by concentrate and feedstuff types
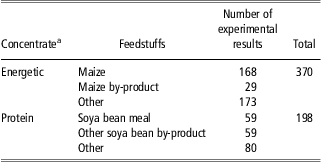
aConcentrate of plant origin commonly used in poultry diet.
The AMEn, the chemical composition values (CP; ether extract without acid hydrolysis – EE; ash; crude fibre – CF), the classification of the feedstuff category (1 – energetic concentrate; 2 – protein concentrate), the specification of the ingredient (1 – maize or soya bean meal; 2 – maize by-product or other soya bean by-product; 3 – other feedstuff) and the type of animal used in the bioassay (1 – chick; 2 – rooster) were defined for each feeds. The AMEn was determined on the basis of a bioassay. The NDF and ADF values were not considered because this information was not available in the vast majority of experimental results. The list of references used for the meta-analysis is provided in the Supplementary Material; references for the energetic concentrates are provided in Supplementary Material 1; and references for the protein concentrates are provided in Supplementary Material 2.
Model development
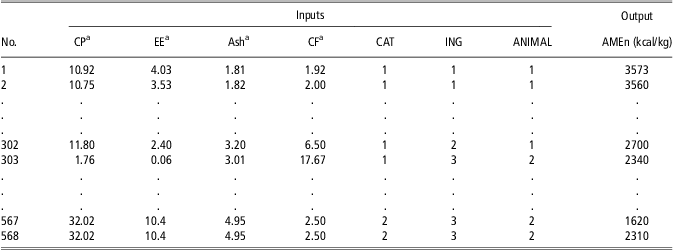
The AMEn values of concentrate feedstuffs were predicted from an MLP using the meta-analysis principle. The dataset, part of which is presented in Table 2, was randomly partitioned into two separate subsets: one, comprising 80% (454 studies) of the data, was used as training set in the development of the network; the second one, comprising 20% (114 studies) of the data, was used as test set. The training data should not be used to test the network because the network can memorise the data pattern and the test procedure would not be reliable.
Data sample lines used to develop the multilayer perceptron network model to predict the AMEn values (on dry matter basis) of feedstuffs for broilers
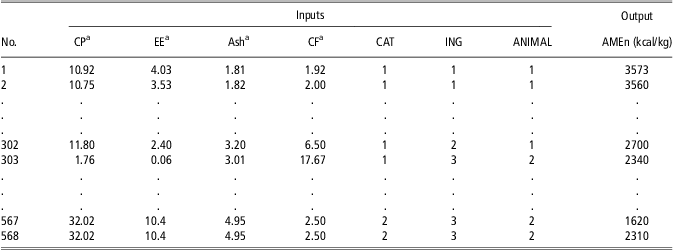
AMEn = nitrogen-corrected metabolisable energy; EE = ether extract; CF = crude fibre; n = number of data; CAT = classification of the feedstuff category: 1 – energetic concentrate; 2 – protein concentrate; ING = specification of the ingredient: 1 – maize or soya bean meal; 2 – maize by-product or other soya bean by-product; 3 – other feedstuff; ANIMAL = type of animal used in the bioassay: 1 – chick; 2 – rooster.
aValues expressed on dry matter basis.
The input parameters of the implemented MLP were feedstuff categories (CAT), concentrate ingredients (ING), type of animals used in the bioassay (ANIMAL), CP, EE, MM and CF. The AMEn column (Table 2) was the values of desired output.
Different structures were implemented with the objective of selecting the best one. In the general way, the structured was defined as 7-p-q-1, which represents: seven inputs, p neurons in the first hidden layer, q neurons in the second hidden layer and one output. Values from 1 to 10 were considered for both p and q. The MLP proposed contains two hidden layers because this structure allows any function approximation (Cybenko, Reference Cybenko1988).
A backpropagation algorithm was used to train the network. This algorithm is based on the error-correction learning rule, which is propagated backward from the output layer to hidden layers of the ANN (Rumelhart et al., Reference Rumelhart, Hinton and Williams1986). Basically, this algorithm iteratively adjusts the weights to the network randomly, presenting examples to the neural network as an input signal (Albuquerque et al., Reference Albuquerque, Alexandria, Cortez and Tavares2009). The algorithm minimises the mean square error (m.s.e.) of prediction, whose error is the difference between the desired outcome from the data input and the predicted response from the output neuron.
The software FANN TOOL 1.2 (http://code.google.com/p/fanntool/) was used to implement the networks. The selected training algorithm was the iRPROP, which was described by Igel and Husken (Reference Igel and Hüsken2000). The initial weights were randomly defined by the software, and the network was trained up to 500 000 epochs. The activation function for the hidden neurons was the fast ‘sigmoid-like’ function and for the output neuron was the periodical cosinus function. The learning rate and momentum for network training were set, respectively, at 0.7 and 0. The goodness of fit of the model and the accuracy of the predicted AMEn were evaluated using the training and testing data. The measures used in this process were as follows: Coefficient of determination (R 2), m.s.e., mean absolute deviation (MAD), mean absolute percentage error (MAPE) and bias, as defined in Bolzan et al. (Reference Bolzan, Machado and Piaia2008) and Perai et al. (Reference Perai, Moghaddam, Asadpour, Bahrampour and Mansoori2010).
Results and discussion
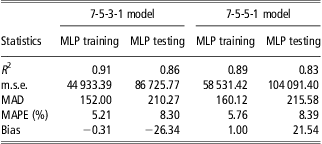
Two MLP models, which presented the best accuracy in the prediction of the AMEn values, were selected. A summary of statistical results associated with these two MLP models is shown in Table 3. These statistics indicate forecasting error measurements based on the difference between observed and predicted values. The closer to one the R 2 value, the closer to zero the bias value, and the lower m.s.e., MAPE and MADE values, the more accurate is the model.
Statistics used to check the goodness-of-fit and the accuracy of the two best multilayer perceptron network models
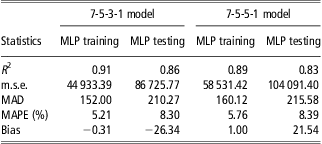
R 2 = coefficient of determination; MAD = mean absolute deviation; MAPE = mean absolute percentage error; m.s.e. = mean square error.
The 7-5-3-1 model had lower values of m.s.e., MAD and MAPE than the 7-5-5-1 model, both training and test dataset. Furthermore, the first model presented values of R 2 closer to one, and the MLP training bias closer to zero, than the second one. Thus, the 7-5-3-1 model was considered more suitable to predict the AMEn for both the energetic and protein feedstuffs for broilers.
The selected MLP model has higher prediction accuracy (higher R 2 values) than the models obtained by Nascimento et al. (Reference Nascimento, Rodrigues, Freitas, Bertechini, Lima and Pucci2009) and Mariano et al. (Reference Mariano, Lima, Rodrigues, Alvarenga and Nascimento2012). These authors had obtained equations to predict the AMEn for both the energetic and protein feedstuffs for broilers, by using meta-analysis and regression methods. Their models presented R 2 values approximately equal to 0.83 and 0.74, respectively.
In general, there was better prediction of AMEn using the training dataset than testing dataset (Table 3). Ahmadi et al. (Reference Ahmadi, Mottaghitalab and Nariman-Zadeh2007) had also found these same differences between the two datasets. The values for the m.s.e. are into the interval presented by Perai et al. (Reference Perai, Moghaddam, Asadpour, Bahrampour and Mansoori2010). These authors found m.s.e. values between 2338.1875 and 91 335.17. Perai et al. (Reference Perai, Moghaddam, Asadpour, Bahrampour and Mansoori2010) obtained m.s.e. values for the ANN model lower than the m.s.e. values presented in the Table 3. However, they used a specific protein feedstuff. In this paper, 568 AMEn values of energetic and protein feedstuffs were used. These feedstuffs have a higher variability in the AMEn values, and this leads to an increase in the m.s.e.
It is important to note that a larger dataset was used in the ANN procedure because this improves the chance of obtaining better adjustments (Bishop, Reference Bishop1995). This is important because the statistics used to check for ANN convergence are usually better estimated when the dataset is larger. Ahmadi et al. (Reference Ahmadi, Golian, Mottaghitalab and Nariman-Zadeh2008) used just 30 raw data lines consisting of 12 feather meal (FM) and 18 poultry offal meal (POM) samples to train a group method of data handling-type neural network (GMDH-type NN). Another group with seven data lines (three FM and four POM) were used as validation set of the ANN. Perai et al. (Reference Perai, Moghaddam, Asadpour, Bahrampour and Mansoori2010) used 34 raw lines and only one feedstuff (meat and bone meal-MBM). Although Ahmadi et al. (Reference Ahmadi, Golian, Mottaghitalab and Nariman-Zadeh2008) and Perai et al. (Reference Perai, Moghaddam, Asadpour, Bahrampour and Mansoori2010) used a small dataset, their prediction was accurate. This most likely occurred because they used specific feedstuffs. In this study, an ANN was developed to predict the AMEn for energetic and protein concentrates, though it is important to emphasise that the implemented MLP is more suitable to predict the AMEn of the feedstuffs commonly used in poultry feeds, such as maize, sorghum, soya bean, soya bean meal, wheat and wheat meal.
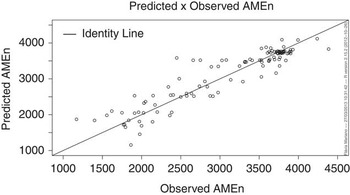
The predicted v. observed values of the test data are presented in Figure 2. Points closer to the identity line indicate that the predicted values are similar to the observed data. Therefore, the predicted values obtained using MLP tend to follow the same patterns as the observed data. These results indicate that the AMEn values were accurately predicted.
Predicted v. observed AMEn values obtained from the test dataset for concentrate feedstuffs for broilers.

It can be observed in the Figure 2 that there are few points that the predictions are quite off the mark. Some points indicate that the difference between the observed and the predicted AMEn values (error) is equal to plus or minus 1000 kcal. These points refer to the feedstuffs that are not commonly used in poultry feeds. Moreover, there is a small number of these feedstuffs in the dataset, which affect the accuracy of prediction. For these feedstuffs, there is no processing pattern, resulting in a considerable variation in their chemical composition and, consequently, in their energy value (Rodrigues et al., Reference Rodrigues, Rostagno, Albino, Gomes, Barboza and Santana2001; Moreira et al., Reference Moreira, Ribeiro, Furlan, Scapinello and Kutschenko2002; Brunelli et al., Reference Brunelli, Pinheiro, Silva, Fonseca, Oliveira, Cunha and Souza2006).
No general criterion exists to define the number of neurons in the hidden layer. In general, neural networks with few hidden neurons are preferred because they tend to have better generalisation power, thereby reducing the problem of overfitting. However, networks with few hidden neurons may not be able to model and learn the data in complex problems, and this can result in underfitting, that is, the network does not converge during training (Pereira, Reference Pereira1999; Calôba et al., Reference Clôba, Clôba and Saliby2002).
In some of the cases where the number of neurons in the single hidden layer becomes high, the use of two or three layers may sometimes allow the number of neurons in the hidden layer to be reduced (Santos et al., Reference Santos, Seixas, Pereira and Medronho2005). According to Wijayasekara et al. (Reference Wijayasekara, Manic, Sabharwall and Utgikar2011), the chance of over-training a network increases with the number of neurons and the number of training epochs. Thus, as the number of neurons increases, the possibility of the network describing the training data pattern exactly also increases. This is an undesirable ANN behaviour because the objective is to obtain an MLP that accurately predicts the AMEn values.
The prediction of energy values by using regression models considers just chemical composition variables (Zhao et al., Reference Zhao, Zhang, Hou and Zhang2008; Wan et al., Reference Wan, Chen, Qi, Peng and Peng2009; Mariano et al., Reference Mariano, Lima, Rodrigues, Alvarenga and Nascimento2012). The MLP can be fit by using other factors in addition to chemical composition, which is a great advantage. These factors can influence the AMEn and can improve its prediction. The type of the feedstuffs (energetic or protein concentrate), the specification of the ingredient (maize, soya bean meal and their similar products or others feedstuffs) and the type of animal used in the bioassay (chick or rooster) were considered to fit the MLP model, as these variables affect the AMEn variability.
The results obtained in this study support the findings of previous studies, in that the use of ANN has demonstrated promising results regarding predictions in the science poultry field, including the evaluation of broiler diets. Perai et al. (Reference Perai, Moghaddam, Asadpour, Bahrampour and Mansoori2010) compared the performance of three-layer feedforward ANN, partial least squares (PLS) and multiple linear regression (MLR) methods to predict the TMEn values of meat and bone meat samples based on their chemical composition. The results demonstrated that the ANN model outperformed the PLS and MLR models. A GMDH-type NN accurately predicted broiler performance on the basis of dietary metabolisable energy, methionine and lysine (Ahmadi et al., Reference Ahmadi, Mottaghitalab and Nariman-Zadeh2007) and predicted the TMEn values of feather and POMs on the basis of their chemical composition (Ahmadi et al., Reference Ahmadi, Golian, Mottaghitalab and Nariman-Zadeh2008).
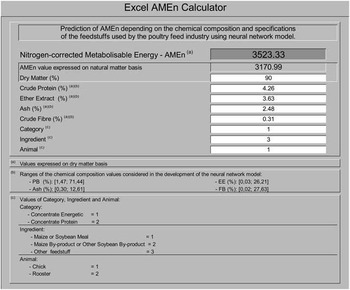
Once selected the best MLP model, an Excel® AMEn Calculator was created (Figure 3). This AMEn Calculator enables the animal nutritionists to use this tool to predict AMEn for feedstuff samples. It is provided in Supplementary Material 3. Furthermore, it is intended to leave it available in conjunction with the nutritional composition tables. Although only Brazilian data (preliminary study) were used in the development of the MLP, this calculator could be used with data from international origin.
Excel® calculator to predict the AMEn values of concentrate feedstuffs for broilers.

In future studies, the dataset including other experimental results from Brazilian and other countries studies will be updated. The objective will be to improve the accuracy of the AMEn prediction for broilers by using the ANN model. Other types of ANN and additional techniques will be explored in order to optimise generalisation of the networks (e.g. cross-validation, early stopping and identification of important input parameters in building a MLP).
Conclusion
The MLP with the best performance has a structure of seven inputs, five neurons in the first hidden layer, three neurons in the second hidden layer and one neuron as output. This result revealed that use of MLP method is a promising approach for the accurate prediction of AMEn values of energetic and protein concentrate feeds used in broiler diets. The Excel® AMEn calculator developed in this study is an efficient and easy way to predict the AMEn values by using ANN.
Acknowledgements
The authors gratefully acknowledge financial supports provided by the Coordination Improvement of Higher Education Students (CAPES) and by the National Council for Scientific and Technological Development – Brazil (CNPq). The authors would also like to thank the editor Jaap van Milgen and the anonymous reviewers for their valuable comments and suggestions to improve the quality of this paper.