INTRODUCTION
Milk represents an easy-to-take sample that is frequently used in dairy farms to monitor specific traits (e.g. fat, acetone) as biomarkers to assess nutritional and health status of dairy cattle. In the context of environmental emissions, biomarkers such as urea in milk not only indicate excess protein intake by an animal, but also give an indication of the nitrogen excretion by production animals (Jonker et al. Reference Jonker, Kohn and Erdman1999). Similarly, given the major emphasis on greenhouse gas emissions in recent years, efforts have been made towards the development of simple techniques to estimate methane (CH4) emissions under practical conditions, with major attention paid to milk and its components, specifically milk fatty acids (MFA) (e.g. Chilliard et al. Reference Chilliard, Martin, Rouel and Doreau2009; Dijkstra et al. Reference Dijkstra, van Zijderveld, Apajalahti, Bannink, Gerrits, Newbold, Perdok and Berends2011; Mohammed et al. Reference Mohammed, McGinn and Beauchemin2011). Although several studies reported changes in MFA along with changes in CH4 production (e.g. Sauer et al. Reference Sauer, Fellner, Kinsman, Kramer, Jackson, Lee and Chen1998; Hristov et al. Reference Hristov, van der Pol, Agle, Zaman, Schneider, Ndegwa, Vaddella, Johnson, Shingfield and Karnati2009; Van Zijderveld et al. Reference Van Zijderveld, Fonken, Dijkstra, Gerrits, Perdok, Fokkink and Newbold2011), variations in MFA profiles and CH4 were not consistent across studies, which makes it difficult to draw conclusions from individual experiments on the relationships between MFA and CH4 and more generally, on the ability of MFA to predict CH4. In the same sense, models aiming at the prediction of CH4 (Chilliard et al. Reference Chilliard, Martin, Rouel and Doreau2009; Dijkstra et al. Reference Dijkstra, van Zijderveld, Apajalahti, Bannink, Gerrits, Newbold, Perdok and Berends2011; Mohammed et al. Reference Mohammed, McGinn and Beauchemin2011) have few MFA in common. This general lack of concurrence may originate mainly, but not only, from the diverse conditions of the studies (e.g. basal diet, type of animal, dietary treatments), which limits their generalization capacity.
Therefore, in the current multi-study, survey data were gathered from multiple studies that reported both MFA profiles and CH4 emissions to identify robust relationships between MFA and CH4 emissions in an attempt to highlight individual or groups of MFA predominantly linked with CH4 and to develop a more general predictive equation from a multi-study database.
MATERIALS AND METHODS
Database development
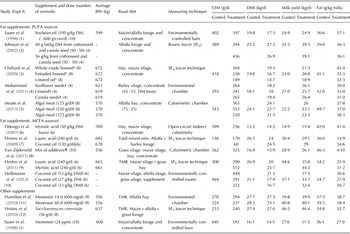
Publications were obtained from the ISI Web of Science and from Pubmed databases using ‘in vivo’, ‘methane’ and/or ‘milk fatty acids’ as keywords. Table 1 presents an overview of published studies reporting both CH4 production and MFA profiles from dairy cattle. Twelve studies comprising 39 treatments (14 controls and 25 supplements) were included.
Summary of studies reporting methane output and milk fatty acid profiles. Variables highlighted in grey fields were reported to be statistically different from the corresponding control

BW, body weight; DMI, dry matter intake; MCFA, medium chain fatty acid; PUFA, poly-unsaturated fatty acids.
* Proportions of whole crude and extruded linseed and linseed oil were added to achieve a dietary fatty acid content of 57 g/kg on DM basis.
† Crushed. Added to the diet to deliver 33 g fat/kg DM.
‡ Algal meal DM (DHA-Gold) containing 20 g of n-3 C22 : 6/100 g fat.
§ Coconut oil containing 46 g lauric acid/100 and 20 g myristic acid/100 g.
¶ Lauric acid, myristic acid, linseed oil and calcium fumarate were added at 4, 12, 15 and 7 g/kg DM, respectively.
ǁ Coconut oil containing 41 g lauric acid/100 g and 20 g myristic acid/100 g.
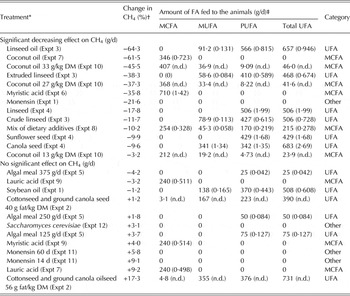
It is known that the concentration of certain FA in milk will be influenced by the addition of fats in the diet. Therefore, all treatments found in the studies in Table 1 were classified into three categories according to the major source and the amount of supplementary FA intake: supplementary medium chain FA (MCFA), supplementary unsaturated FA (UFA, including mono- and poly-unsaturated FA (MUFA and PUFA)), and no supplementary FA (Other). Supplementary intake refers to the extra amount of FA consumed by the animal within a certain treatment compared with the corresponding control treatment. These amounts (g FA/d and g FA/kg BW) and the category of each treatment are shown in Table 2. All of the controls were included in the category Other, along with those treatments not containing any FA source (e.g. monensin, bromochloromethane). The study of Van Zijderveld et al. (Reference Van Zijderveld, Fonken, Dijkstra, Gerrits, Perdok, Fokkink and Newbold2011), supplementing the cows with a mix of dietary additives containing lauric acid, myristic acid, linseed oil and calcium fumarate, was included in the MCFA group, because the addition of these FA exceeded that of UFA (254 and 216 g/d of MCFA and UFA, respectively).
Amount and source of fatty acids added to the diet from the respective control for each treatment (ordered by the relative change in daily CH4 production) and its classification into one of the categories MCFA, UFA and Other

BW, body weight, DM, dry matter; MCFA, medium chain fatty acid; PUFA, poly-unsaturated fatty acids; UFA, unsaturated fatty acids; n.d., not determined by lack of information on BW.
* Experiment number as presented in Table 1.
† Change relative to the corresponding control.
‡ Values in brackets are the amount of FA as g/kg BW.
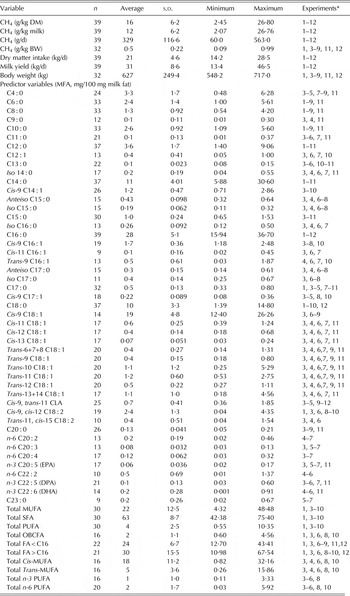
A total of 126 MFA were found across the studies, of which 51 were selected for statistical analysis (with an average concentration higher than 0·05/100 g MFA, reported in at least three studies and being represented in each of the three categories previously described) as continuous predictor variables (Table 3). Additionally, ten sums of MFA (e.g. total saturated FA (SFA), total n-3 PUFA) were included in the analysis. Methane was expressed as daily emissions (g/d), daily emissions relative to body weight (g/kg BW), emissions relative to dry matter intake (g/kg DMI) and emissions relative to milk yield (g/kg milk).
Summary statistics of the variables selected for the analysis

BW, body weight; EPA, eicosapentanoic acid; DHA, docosahexanoic acid; DM, dry matter; DPA, docosapentanoic acid; MFA, milk fatty acid; MCFA, medium chain fatty acid; OBCFA, odd- and branched-chain fatty acid; PUFA, poly-unsaturated fatty acid; SFA, saturated fatty acids; UFA, unsaturated fatty acid .
* Experiment number as presented in Table 1.
Statistical analysis
Two approaches were used for the univariate analysis. Firstly, absolute means of CH4 production were regressed on absolute means of MFA proportions (g/100 milk fat) to determine the relationship between individual MFA and CH4 production. In a second approach, relative changes of each variable (changes proportional to the corresponding control) were used for the analysis. Therefore, relative changes in CH4 were regressed on relative changes in MFA proportions. Both approaches were applied for the regression of CH4 in each of the four units of expression on MFA. The analysis of data was done following a statistical meta-analysis approach (Sauvant et al. Reference Sauvant, Schmidely, Daudin and St-Pierre2008). Using the MIXED procedure of SAS (version 9.3), the following model was applied:
 $${Y_{ijk}} = {\rm \mu} + {\rm \beta} {X_{ij}} + {\rm} {S_i} + {{\rm \tau} _j} + {{\rm \beta} _{ij}}(X \times {\rm \tau} ){\rm} + {\rm} {e_{ijk}}$$
where Y ijk = dependent variable; μ = overall intercept across all experiments; β = linear regression coefficient of Y on X (fixed effect); X ij = value of the continuous predictor variable (i.e. MFA proportion); S i = the random effect of the ith study; τ j = the fixed effect of the jth level of factor τ (discrete variable, i.e. UFA, MCFA, Other); β ij = the linear regression coefficient of Y on the interaction of (X and τ j ) and e ijk = the unexplained residual error.
After running the univariate analysis, the interaction effect was not significant for any variable. Hence, this effect was removed from the model, retaining:
 $${Y_{ijk}} = {\rm \mu} + {\rm \beta} {X_{ij}} + {\rm} {S_i} + {{\rm \tau} _j} + {\rm} {e_{ijk}}$$
The Akaike information criterion for this model Eqn (2) was always lower than that of the previous model Eqn (1) across all variables. The variable ‘study’ was declared in the CLASS statement as it did not contain any quantitative information. Data were weighed by the number of observations (Jayanegara et al. Reference Jayanegara, Leiber and Kreuzer2012). In order to maintain the square root of the mean square error in the same scale as the original measurements (Y), each weight was divided by the mean of all weights and the resulting values were used as weighing factors for the analysis as suggested by St-Pierre (Reference St-Pierre2001). The normality of the distribution of the weighed data was checked by the Shapiro–Wilk test using the Univariate procedure of SAS (version 9.3). Coefficients of determination (R 2) were calculated from adjusted predicted values following the procedure suggested by St-Pierre (Reference St-Pierre2001).
RESULTS
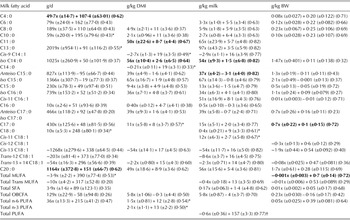
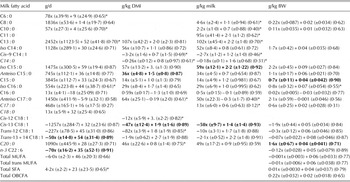
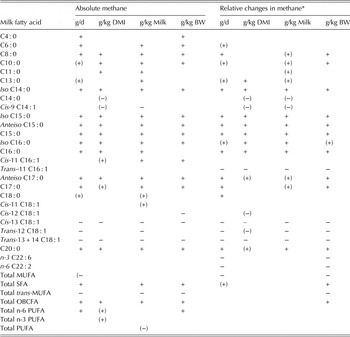
The linear regressions relating absolute CH4 emissions (g/d, g/kg DMI, g/kg milk, g/kg BW) to MFA proportions (g/100 g MFA) are presented in Table 4. Linear regressions predicting relative changes in CH4 emissions (g/d, g/kg DMI, g/kg milk, g/kg BW) from relative changes in MFA proportions are presented in Table 5. Table 6 presents a summary of MFA having an effect on absolute and relative methane emissions. Only those variables with a regression coefficient significantly different (P < 0·05) or tending to be different (P < 0·1) from 0 are presented.
Equations linearly relating milk fatty acid proportions (x) (g/100 g milk fat) to methane emissions (g/d, g/kg DMI, g/kg milk, g/kg BW)

BW, body weight, DMI, dry matter intake; MCFA, medium chain fatty acid; OBCFA, odd- and branched-chain fatty acid; PUFA, poly-unsaturated fatty acid; SFA, saturated fatty acids.
Regression coefficients ± s.e. R 2 presented in brackets at the end of each equation. Equations in bold are represented in Figs 1 and 2. The number of observations and studies used in each equation can be found in Table 3.
* Tendencies (0·05 < P < 0·1).
Equations linearly relating relative changes in milk fatty acid proportions (x) (g/100 g milk fat) to relative changes in methane emissions (g/d, g/kg DMI, g/kg milk, g/kg BW)

Summary of milk fatty acids having an effect on absolute and relative methane emissions expressed in four different units. Sign between brackets denote tendency (0·05 < P < 0·1)

BW, body weight; DMI, dry matter intake; MUFA, mono-unsaturated fatty acids; OBCFA, odd- and branched-chain fatty acids; SFA, saturated fatty acids; PUFA, poly-unsaturated fatty acids.
* Relative changes of each variable (changes proportional to its corresponding control).
Milk fatty acid proportions of C8 : 0, iso C14 : 0, iso C15 : 0, anteiso C15 : 0, C15 : 0, iso C16 : 0 and anteiso C17 : 0, C20 : 0, C22 : 0, C24 : 0 and total odd- and branched-chain FA (OBCFA) were positively associated with absolute CH4 irrespective of the functional unit for its quantification. Iso C14 : 0, iso C15 : 0, anteiso C15 : 0 and C15 : 0 were also positively related to relative changes in CH4 for all functional units; iso C16 : 0, anteiso C17 : 0 and C20 : 0 were also related to relative changes, albeit including tendencies. Furthermore, proportions of cis-13 C18 : 1 and trans-13 + 14 C18 : 1 were negatively associated with both absolute CH4 and relative differences irrespective of the functional unit for its quantification, with trans-11, cis-15 C18 : 2 (tendency with absolute g CH4/kg DMI) also relating to all expressions of CH4. Relative changes in trans-11 C16 : 1 were negatively related to relative changes in CH4 expressed in all units, but not with absolute CH4.
Whether or not MFA is associated with CH4 emissions depends partly on the functional units used to express these emissions. Absolute emissions and relative differences of CH4/kg DMI or per kg milk tended to correlate with C11 : 0, C14 : 0 and cis-9 C14 : 1, whereas daily CH4 and CH4/kg BW were not related to these MFA. Similarly, relative changes in g CH4/kg DMI and CH4 in g/kg milk were negatively correlated with relative changes in milk unsaturated C22 FA and Total MUFA, and positively related with Total SFA, but relative changes in daily CH4 and CH4/kg BW did not correlate with these MFA.
Most MFA associated with absolute CH4 are associated with relative changes in CH4. However, there are some notable exceptions, such as cis-11 C16 : 1 and C22 : 0, which are related to absolute CH4 for most functional units, but not to the relative changes; conversely, trans-11 C16 : 1, n-3 C22 : 6 and n-3 C22 : 2 were associated with relative changes in CH4, but not with the absolute emissions. Interestingly, MFA with carbon chains of 11 or lower appeared to correlate with absolute CH4 but mainly via tendencies with the relative changes. The same holds for Total OBCFA and Total n-6 PUFA.
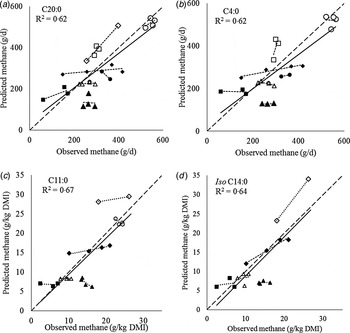
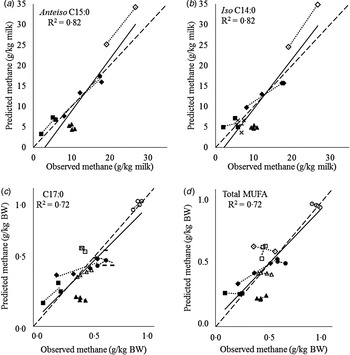
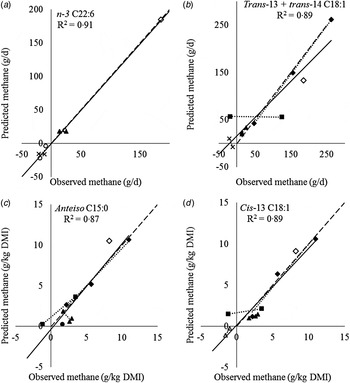
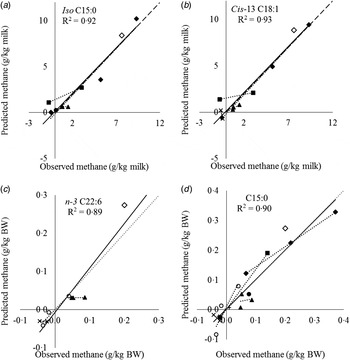
Individual MFA explained a maximum of 0·62 of the variation in absolute daily CH4 emissions, a maximum of 0·71 of the variation in g CH4/kg DMI, up to 0·82 of the variation in g CH4/kg milk and a maximum of 0·72 of the variation in daily g CH4/kg BW. On the other hand, the variation explained by relative changes in individual MFA ranged between 0·58 and 0·99 for relative changes in g CH4/d, between 0·61 and 0·96 in g CH4/kg DMI, between 0·12 and 0·98 for relative changes in g CH4/kg milk and between 0·31 and 0·98 for relative changes in daily g CH4/kg BW.
Groups of MFA (reported as ‘total’ in Table 4) only explain a low to modest amount of the variation of the absolute CH4 emissions (R 2 between 0·20 and 0·77), with the groups of FA clearly relating better to CH4 expressed relative to milk yield. It does not appear that groups of MFA are better predictors of absolute emissions than individual MFA. This was confirmed for relative changes in CH4 emissions, with R 2 ranging from 0·65 to 0·79, well below some individual MFA. Furthermore, for relative changes in g CH4/kg and g CH4/kg milk, no group of MFA was found to be related.
In the analysis of absolute means of CH4 emissions, C4 : 0 (n = 24) and C20 : 0 (n = 26) had the highest R 2 for CH4 in g/d (Fig. 1); C11 : 0 (n = 21) and iso C14 : 0 (n = 17) (Fig. 1), closely followed by anteiso C15 : 0 and cis-13 C18 : 1 had the highest R 2 for CH4 in g/kg DMI and CH4 in g/kg milk (Fig. 2). Moreover, CH4/kg BW had the highest correlation with C15 : 0 (n = 30), C17 : 0 (n = 32) and total trans-MUFA (n = 30) (Fig. 2). It has to be noted that in some cases, these correlations are somewhat affected by the leverage of a single experiment, which becomes stronger for MFA with few observations. In the analysis of relative changes of CH4 emissions, several MFA have coefficients of determination larger than 0·9 (Figs 3 and 4).
Scatter plots of predicted v. observed absolute methane emissions for (a) C20 : 0, (b) C4 : 0, (c) C11 : 0 and (d) Iso C14 : 0. Selected milk fatty acids (MFA) highly correlating with methane (g/d and g/kg dry matter intake(DMI)) are presented. Dashed line represents the line of unity, solid line represents the regression line across all observations. Data from Chilliard et al. Reference Chilliard, Martin, Rouel and Doreau2009 (♦), Hristov et al. Reference Hristov, van der Pol, Agle, Zaman, Schneider, Ndegwa, Vaddella, Johnson, Shingfield and Karnati2009 (■), Moate et al. Reference Moate, Williams, Hannah, Eckard, Auldist, Ribaux, Jacobs and Wales2013 (o), Odongo et al. Reference Odongo, Or-Rashid, Kebreab, France and McBride2007 (◊), Van Zijderveld et al. Reference Van Zijderveld, Fonken, Dijkstra, Gerrits, Perdok, Fokkink and Newbold2011 (•), Hamilton et al. Reference Hamilton, De Peters, McGarvey, Lathrop and Mitloehner2010 (∆), Hristov et al. Reference Hristov, Lee, Cassidy, Long, Heyler, Corl and Forster2011 (□), Mohammed et al. Reference Mohammed, McGinn and Beauchemin2011 (▲), Hollmann et al. Reference Hollmann, Powers, Fogiel, Liesman, Bello and Beede2012 (×), Sauer et al. Reference Sauer, Fellner, Kinsman, Kramer, Jackson, Lee and Chen1998 (−).

Scatter plots of predicted v. observed absolute methane emissions for (a) Anteiso C15 : 0, (b) Iso C14 : 0, (c) C17 : 0 and (d) total mono-unsaturated fatty acids (MUFA). Selected milk fatty acids (MFA) highly correlating with methane (g/kg milk and g/kg body weight (BW)) are presented. Dashed line represents the line of unity, solid line represents the regression line across all observations. Data from Chilliard et al. Reference Chilliard, Martin, Rouel and Doreau2009 (♦), Hristov et al. Reference Hristov, van der Pol, Agle, Zaman, Schneider, Ndegwa, Vaddella, Johnson, Shingfield and Karnati2009 (■), Moate et al. Reference Moate, Williams, Hannah, Eckard, Auldist, Ribaux, Jacobs and Wales2013 (o), Odongo et al. Reference Odongo, Or-Rashid, Kebreab, France and McBride2007 (◊), Van Zijderveld et al. Reference Van Zijderveld, Fonken, Dijkstra, Gerrits, Perdok, Fokkink and Newbold2011 (•), Hamilton et al. Reference Hamilton, De Peters, McGarvey, Lathrop and Mitloehner2010 (∆), Hristov et al. Reference Hristov, Lee, Cassidy, Long, Heyler, Corl and Forster2011 (□), Mohammed et al. Reference Mohammed, McGinn and Beauchemin2011 (▲), Hollmann et al. Reference Hollmann, Powers, Fogiel, Liesman, Bello and Beede2012 (×), Sauer et al. Reference Sauer, Fellner, Kinsman, Kramer, Jackson, Lee and Chen1998 (−).

Scatter plots of predicted v. observed relative changes in methane emissions for (a) n-3 C22 : 6, (b) Trans-13 + trans-14 C18 : 1, (c) Anteiso C15 : 0 and (d) Cis-13 C18 : 1. Selected mono-unsaturated fatty acids (MUFA) highly correlating with methane (g/day and g/kg dry mater intake (DMI)) are presented. Dashed line represents the line of unity, solid line represents the regression line across all observations. Data from Chilliard et al. Reference Chilliard, Martin, Rouel and Doreau2009 (♦), Hristov et al. Reference Hristov, van der Pol, Agle, Zaman, Schneider, Ndegwa, Vaddella, Johnson, Shingfield and Karnati2009 (■), Moate et al. Reference Moate, Williams, Hannah, Eckard, Auldist, Ribaux, Jacobs and Wales2013 (o), Odongo et al. Reference Odongo, Or-Rashid, Kebreab, France and McBride2007 (◊), Van Zijderveld et al. Reference Van Zijderveld, Fonken, Dijkstra, Gerrits, Perdok, Fokkink and Newbold2011 (•), Hamilton et al. Reference Hamilton, De Peters, McGarvey, Lathrop and Mitloehner2010 (∆), Hristov et al. Reference Hristov, Lee, Cassidy, Long, Heyler, Corl and Forster2011 (□), Mohammed et al. Reference Mohammed, McGinn and Beauchemin2011 (▲), Hollmann et al. Reference Hollmann, Powers, Fogiel, Liesman, Bello and Beede2012 (×), Sauer et al. Reference Sauer, Fellner, Kinsman, Kramer, Jackson, Lee and Chen1998 (−).

Scatter plots of predicted v. observed relative changes ine methane emissions for (a) Iso C15 : 0, (b) Cis-13 C18 : 1, (c) n-3 C22 : 6 and (d) C15 : 0. Selected milk fatty acids (MFA) highly correlating with methane (g/kg milk and g/kg body weight (BW)) are presented. Dashed line represents the line of unity, solid line represents the regression line across all observations. Data from Chilliard et al. Reference Chilliard, Martin, Rouel and Doreau2009 (♦), Hristov et al. Reference Hristov, van der Pol, Agle, Zaman, Schneider, Ndegwa, Vaddella, Johnson, Shingfield and Karnati2009 (■), Moate et al. Reference Moate, Williams, Hannah, Eckard, Auldist, Ribaux, Jacobs and Wales2013 (o), Odongo et al. Reference Odongo, Or-Rashid, Kebreab, France and McBride2007 (◊), Van Zijderveld et al. Reference Van Zijderveld, Fonken, Dijkstra, Gerrits, Perdok, Fokkink and Newbold2011 (•), Hamilton et al. Reference Hamilton, De Peters, McGarvey, Lathrop and Mitloehner2010 (∆), Hristov et al. Reference Hristov, Lee, Cassidy, Long, Heyler, Corl and Forster2011 (□), Mohammed et al. Reference Mohammed, McGinn and Beauchemin2011 (▲), Hollmann et al. Reference Hollmann, Powers, Fogiel, Liesman, Bello and Beede2012 (×), Sauer et al. Reference Sauer, Fellner, Kinsman, Kramer, Jackson, Lee and Chen1998 (−).

It is important to note that the majority of the R 2 across all MFA in the univariate analyses range from 0·2 to 0·8, which indicates that MFA could explain some variation in CH4 emissions. Furthermore, many MFA showing high correlations were reported in no more than seven out of the 15 studies included in the database (Table 3).
DISCUSSION
Most of the MFA reported in previous models to predict CH4 (e.g. Chilliard et al. Reference Chilliard, Martin, Rouel and Doreau2009 (g CH4/d); Dijkstra et al. Reference Dijkstra, van Zijderveld, Apajalahti, Bannink, Gerrits, Newbold, Perdok and Berends2011 (g CH4/kg DMI), Mohammed et al. Reference Mohammed, McGinn and Beauchemin2011 (g CH4/d)) do not coincide across the different equations, and based on the findings of the current study some of these differences could be due to differences in the units in which CH4 is expressed. Dry matter intake has an influence on the MFA by changing the availability of precursors (e.g. Propionyl CoA, Acetyl CoA): when CH4 is expressed relative to, e.g. DMI, MFA profiles also relate to the variation on that variable, which could explain the differences in the MFA associated with each unit.
It has to be noted that the data set used in the current study presented some limitations, especially related to the heterogeneity in the detail of the MFA profile reported, which created a large variation in the number of observations available for each MFA and excluded the possibility of reliably studying multivariate correlations (between CH4 and multiple MFA). Another factor playing a role in this variation is related to the dietary treatment studied, which, in 21 of the 39 cases, were fat sources that are known to directly alter the MFA profile. These considerations have to be kept in mind for the following sections.
In general, the results of the current study suggest that SFA are usually positively related to CH4. The same holds for OBCFA and long-chained PUFA, while cis-MUFA and isomers of C18 : 1 and C18 : 2 are negatively related to CH4.
Fatty acids < Cl6 are synthesized de novo in the mammary gland from acetate and 3-hydroxy-butyrate (Bernard et al. Reference Bernard, Leroux, Chilliard and Bösze2008). Lower production of CH4 is usually associated with a lower production of acetate in the rumen (Moss et al. Reference Moss, Jouany and Newbold2000). Accordingly, lower CH4 emissions would be expected to be accompanied by lower concentrations of FA with 16 C or less. Similarly, Mohammed et al. (Reference Mohammed, McGinn and Beauchemin2011) found a positive correlation (r = 0·76) between de novo FA and CH4 (g/d). In the current study C12 : 0, C13 : 0, C14 : 0 and C15 : 0 were positively related to daily CH4, similar to the findings of Chilliard et al. (Reference Chilliard, Martin, Rouel and Doreau2009). A positive correlation for C16 : 0 with CH4 was also found in studies of Chilliard et al. (Reference Chilliard, Martin, Rouel and Doreau2009) and Dijkstra et al. (Reference Dijkstra, van Zijderveld, Apajalahti, Bannink, Gerrits, Newbold, Perdok and Berends2011). Total SFA was positively associated with CH4, in agreement with the findings of Mohammed et al. (Reference Mohammed, McGinn and Beauchemin2011). Similarly, Weill et al. (Reference Weill, Chesneaue, Chilliard, Doreau and Martin2009) proposed total FA < C16 as predictor of CH4 (g/kg milk). Even though de novo synthesized FA (FA < C16) might give an indication of changes in CH4 output, findings from the current study reveal it would not be recommended to rely only on total FA < C16 to predict CH4.
Another group of MFA proposed to have potential to predict CH4 emissions, are the milk OBCFA (Vlaeminck & Fievez Reference Vlaeminck and Fievez2005). With the exception of iso C17 : 0 and cis-9 C17 : 1, these FA showed relationships with CH4, which gives an indication of their usefulness as indicators for emissions. Anteiso C15 : 0 and iso C15 : 0 were positively associated with CH4 production, which agrees with the assumption that higher numbers of cellulolytic bacteria, enriched in those branched-chain FA (Fievez et al. Reference Fievez, Colman, Castro-Montoya, Stefanov and Vlaeminck2012), are linked with higher CH4 emissions. However, C15 : 0 and C17 : 0 are usually associated with amylolytic bacteria and hence are expected to be negatively related with CH4. In their univariate analysis, Dijkstra et al. (Reference Dijkstra, van Zijderveld, Apajalahti, Bannink, Gerrits, Newbold, Perdok and Berends2011) found a positive relationship between CH4 and iso C15 : 0, C15 : 0 and C17 : 0, but not with anteiso C15 : 0. Furthermore, Chilliard et al. (Reference Chilliard, Martin, Rouel and Doreau2009) and Dijkstra et al. (Reference Dijkstra, van Zijderveld, Apajalahti, Bannink, Gerrits, Newbold, Perdok and Berends2011) found that C15 : 0 had a positive correlation with CH4 (r = 0·74), whereas Mohammed et al. (Reference Mohammed, McGinn and Beauchemin2011) found a tendency to a negative correlation (r = −0·3). Neither of them found a relationship between CH4 and iso C15 : 0, whereas the multivariate analysis of Mohammed et al. (Reference Mohammed, McGinn and Beauchemin2011) selected anteiso C15 : 0 as one of the positive predictors of CH4.
The feeding of diets rich in UFA has been accepted as an effective strategy to inhibit CH4 emissions (e.g. Patra Reference Patra2012) and generally is associated with an increase in biohydrogenation intermediates. Thus, in such cases a decrease in CH4 production would be associated with an increase in UFA in milk, particularly trans-MUFA. This assumption is supported by the findings of the current study, where total Trans-MUFA was negatively associated with absolute CH4 emissions expressed in daily emissions or relative to milk and body weight.
Furthermore, in the (single experiment) papers of Chilliard et al. (Reference Chilliard, Martin, Rouel and Doreau2009) and Mohammed et al. (Reference Mohammed, McGinn and Beauchemin2011), CH4 emissions were negatively associated with UFA. Chilliard et al. (Reference Chilliard, Martin, Rouel and Doreau2009) found that the most negative correlations (r = −0·72 to −0·90) with CH4 output were observed for several cis and trans isomers of C18 : 1 and C18 : 2. Likewise, Mohammed et al. (Reference Mohammed, McGinn and Beauchemin2011) found significant negative correlations between CH4 output and a number of MUFA, including cis-9 C17 : 1, cis-11 C18 : 1, cis-13 C18 : 1, trans-6-7-8 C18 : 1 and isomers of C18 : 2. It is likely that the associations found in the studies of Chilliard et al. (Reference Chilliard, Martin, Rouel and Doreau2009) and of Mohammed et al. (Reference Mohammed, McGinn and Beauchemin2011) are related more to the supplementation with dietary UFA sources rather than to a robust prediction of CH4, since both Chilliard et al. (Reference Chilliard, Martin, Rouel and Doreau2009) and Mohammed et al. (Reference Mohammed, McGinn and Beauchemin2011) fed the animals with sources of UFA. In the current study, where 12 out of 25 dietary treatments (excluding control diets) included sources of UFA, cis isomers of C14 : 1, C16 : 1 and C18 : 1 were found to have negative correlations with CH4. Moreover, Dijkstra et al. (Reference Dijkstra, van Zijderveld, Apajalahti, Bannink, Gerrits, Newbold, Perdok and Berends2011), whose analysis considered 50 observations with a minority originating from UFA-supplemented cows, also found that milk content of UFA, particularly MUFA, like cis-9 C18 : 1, cis-11 C18 : 1, cis-12 C18 : 1, trans-10 + 11 C18 : 1, cis-14 + trans-16 C18 : 1 and trans-11, cis-15 C18 : 2, were negatively associated with CH4 production, which is in accordance with the present findings.
Some long-chain PUFA had a positive association with CH4. Previous studies relating MFA to CH4 found no or few correlations between CH4 and individual long-chain PUFA. Chilliard et al. (Reference Chilliard, Martin, Rouel and Doreau2009) found a positive correlation (r = 0·83) between n-6 C20 : 4 and CH4, but no correlation was found for this MFA in the current study. Also, Mohammed et al. (Reference Mohammed, McGinn and Beauchemin2011) found a negative correlation (r = −0·36) of total n-6 PUFA with CH4, in contrast to the current results. The relevance of these MFA in connection with enteric CH4 is unknown.
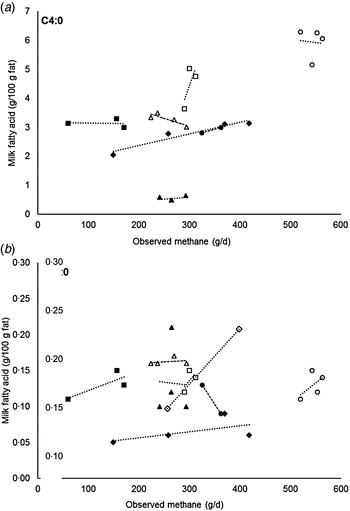
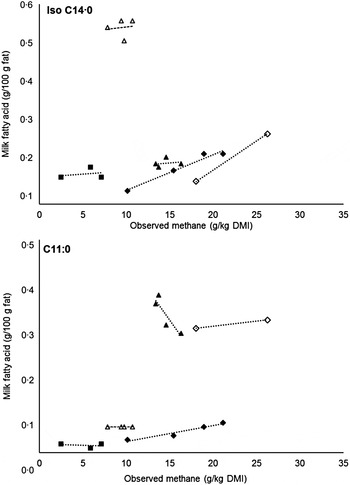
Finally, the determination coefficients (R 2) of regressions relating changes in CH4 and MFA are clearly above those of the regression between absolute CH4 emissions and MFA proportions for all four functional units, which might indicate that MFA might be better predicting changes in CH4 relative to a standard situation (e.g. a diet with additive v. diet without additive), than predicting absolute amounts of CH4 emitted. It has to be noted that MFA relating to relative CH4 emissions are not always the same MFA related to absolute CH4. Moreover, it still has to be taken into account that fewer observations were used for the analysis of relative changes (controls were excluded), therefore, the leverage of a single experiment might have been greater. Additionally, for some individual experiments the relationship between MFA and methane emissions seems to contradict the overall equation of the current study (e.g. C20 : 0 for CH4 (g/d) and Total MUFA for CH4 (g/kg BW) (Figs 5–8), which might be related to the relatively low P-value of the interaction (P = 0·06 and P = 0·12 for C20 : 0 and Total MUFA, respectively). Even though this significance is still above the threshold set for significance (P < 0·05) it might still indicate the presence of certain interaction effects depending on the type of diet fed to the animal, and is worth exploring if equations are to be developed under specific dietary conditions. The effective potential of these MFA as biomarkers for CH4 emission should be investigated (and confirmed) further. Ideally, a good predictor should be measurable through routine analysis, which is not possible for several minor MFA showing correlations with CH4.
Scatter plots of measured milk fatty acids (g/100 g fat) v. observed daily methane emissions (as reported in the corresponding study) for (a) C20 : 0, (b) C4 : 0 presented in Fig. 1. Data from Chilliard et al. Reference Chilliard, Martin, Rouel and Doreau2009 (♦), Hristov et al. Reference Hristov, van der Pol, Agle, Zaman, Schneider, Ndegwa, Vaddella, Johnson, Shingfield and Karnati2009 (■), Moate et al. Reference Moate, Williams, Hannah, Eckard, Auldist, Ribaux, Jacobs and Wales2013 (o), Odongo et al. Reference Odongo, Or-Rashid, Kebreab, France and McBride2007 (◊), Van Zijderveld et al. Reference Van Zijderveld, Fonken, Dijkstra, Gerrits, Perdok, Fokkink and Newbold2011 (•), Hamilton et al. Reference Hamilton, De Peters, McGarvey, Lathrop and Mitloehner2010 (∆), Hristov et al. Reference Hristov, Lee, Cassidy, Long, Heyler, Corl and Forster2011 (□), Mohammed et al. Reference Mohammed, McGinn and Beauchemin2011 (▲), Hollmann et al. Reference Hollmann, Powers, Fogiel, Liesman, Bello and Beede2012 (×), Sauer et al. Reference Sauer, Fellner, Kinsman, Kramer, Jackson, Lee and Chen1998 (−).

Scatter plots of measured milk fatty acids (g/100 g fat) v. observed methane emissions relative to dry matter intake (as reported in the corresponding study) for (a) Iso C14 : 0 and (b) C11 : 0 presented in Fig. 1. Data from Chilliard et al. Reference Chilliard, Martin, Rouel and Doreau2009 (♦), Hristov et al. Reference Hristov, van der Pol, Agle, Zaman, Schneider, Ndegwa, Vaddella, Johnson, Shingfield and Karnati2009 (■), Moate et al. Reference Moate, Williams, Hannah, Eckard, Auldist, Ribaux, Jacobs and Wales2013 (o), Odongo et al. Reference Odongo, Or-Rashid, Kebreab, France and McBride2007 (◊), Van Zijderveld et al. Reference Van Zijderveld, Fonken, Dijkstra, Gerrits, Perdok, Fokkink and Newbold2011 (•), Hamilton et al. Reference Hamilton, De Peters, McGarvey, Lathrop and Mitloehner2010 (∆), Hristov et al. Reference Hristov, Lee, Cassidy, Long, Heyler, Corl and Forster2011 (□), Mohammed et al. Reference Mohammed, McGinn and Beauchemin2011 (▲), Hollmann et al. Reference Hollmann, Powers, Fogiel, Liesman, Bello and Beede2012 (×), Sauer et al. Reference Sauer, Fellner, Kinsman, Kramer, Jackson, Lee and Chen1998 (−).

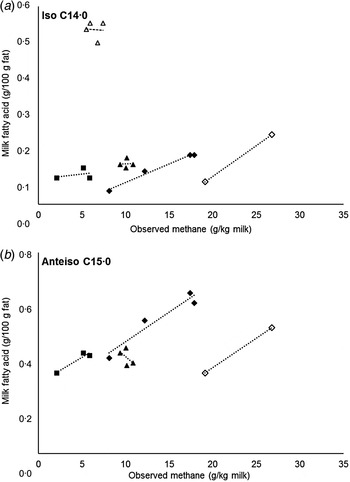
Scatter plots of measured milk fatty acids (g/100 g fat) v. observed methane emissions relative to milk yield (as reported in the corresponding study) for (a) Iso C14 : 0 and (b) Anteiso C15 : 0 presented in Fig. 2. Data from Chilliard et al. Reference Chilliard, Martin, Rouel and Doreau2009 (♦), Hristov et al. Reference Hristov, van der Pol, Agle, Zaman, Schneider, Ndegwa, Vaddella, Johnson, Shingfield and Karnati2009 (■), Moate et al. Reference Moate, Williams, Hannah, Eckard, Auldist, Ribaux, Jacobs and Wales2013 (o), Odongo et al. Reference Odongo, Or-Rashid, Kebreab, France and McBride2007 (◊), Van Zijderveld et al. Reference Van Zijderveld, Fonken, Dijkstra, Gerrits, Perdok, Fokkink and Newbold2011 (•), Hamilton et al. Reference Hamilton, De Peters, McGarvey, Lathrop and Mitloehner2010 (∆), Hristov et al. Reference Hristov, Lee, Cassidy, Long, Heyler, Corl and Forster2011 (□), Mohammed et al. Reference Mohammed, McGinn and Beauchemin2011 (▲), Hollmann et al. Reference Hollmann, Powers, Fogiel, Liesman, Bello and Beede2012 (×), Sauer et al. Reference Sauer, Fellner, Kinsman, Kramer, Jackson, Lee and Chen1998 (−).

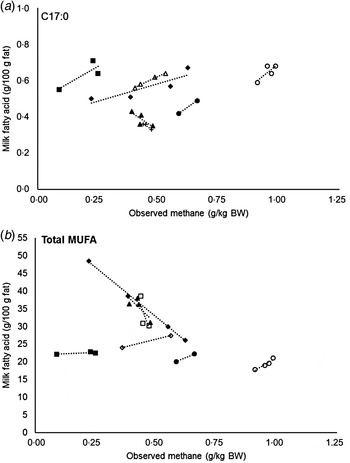
Scatter plots of measured milk fatty acids (g/100 g fat) v. observed methane emissions relative to body weight (as reported in the corresponding study) for (a) C17 : 0 and (b) total mono-unsaturated fatty acids (MUFA) presented in Fig. 2. Data from Chilliard et al. Reference Chilliard, Martin, Rouel and Doreau2009 (♦), Hristov et al. Reference Hristov, van der Pol, Agle, Zaman, Schneider, Ndegwa, Vaddella, Johnson, Shingfield and Karnati2009 (■), Moate et al. Reference Moate, Williams, Hannah, Eckard, Auldist, Ribaux, Jacobs and Wales2013 (o), Odongo et al. Reference Odongo, Or-Rashid, Kebreab, France and McBride2007 (◊), Van Zijderveld et al. Reference Van Zijderveld, Fonken, Dijkstra, Gerrits, Perdok, Fokkink and Newbold2011 (•), Hamilton et al. Reference Hamilton, De Peters, McGarvey, Lathrop and Mitloehner2010 (∆), Hristov et al. Reference Hristov, Lee, Cassidy, Long, Heyler, Corl and Forster2011 (□), Mohammed et al. Reference Mohammed, McGinn and Beauchemin2011 (▲), Hollmann et al. Reference Hollmann, Powers, Fogiel, Liesman, Bello and Beede2012 (×), Sauer et al. Reference Sauer, Fellner, Kinsman, Kramer, Jackson, Lee and Chen1998 (−).

CONCLUSIONS
Previous studies have already explored the relationships between MFA and CH4 emissions. This is the first paper to quantitatively gather these literature data. The functional unit to express CH4 might play an important role in discrepancies between models reported in the literature, but at the current state it is not possible to draw conclusions on reasons for this and more research is needed to clarify it. It must be borne in mind that the number of observations for each MFA in the current study is different, which impairs the comparison of the relations generated between MFA. Even so, MFA to some extent allow to identify both changes in CH4 compared with a standard situation as well as variation in absolute amounts of CH4. Knowing that differences and variation in a data set are key for the generalization capacity of a model, the current literature review and the univariate analyses performed contributed to explore the potential of MFA to predict CH4.
Joaquin Castro Montoya received a PhD Grant jointly funded by the Institute for Agriculture and Fisheries Research (ILVO) – Belgium and the Laboratory of Animal Nutrition and Animal Product Quality – Ghent University – Belgium.