1 Introduction
Understanding the complex flow of an impinging supersonic jet is of great interest to researchers. Studies have focused on such flows due to their application to missile and rocket launching systems, vertical take-off/landing (VTOL) aircraft and the cold spray manufacturing process. Effects of jet impingement include ground surface erosion, lift loss and fatigue damage (Henderson Reference Henderson2002). Impinging jets are often characterised by complex shock structures (Henderson Reference Henderson1966) and the production of intense discrete acoustic tones (Marsh Reference Marsh1961; Powell Reference Powell1988). The impinging jet’s structure is largely dependent on the nozzle pressure ratio (NPR), plate spacing (
 $z/D$
) (Henderson, Bridges & Wernet Reference Henderson, Bridges and Wernet2005) and the impingement surface geometry (Donaldson & Snedeker Reference Donaldson and Snedeker1971; Mason-Smith et al.
Reference Mason-Smith, Edgington-Mitchell, Buchmann, Honnery and Soria2015), where
 $D$
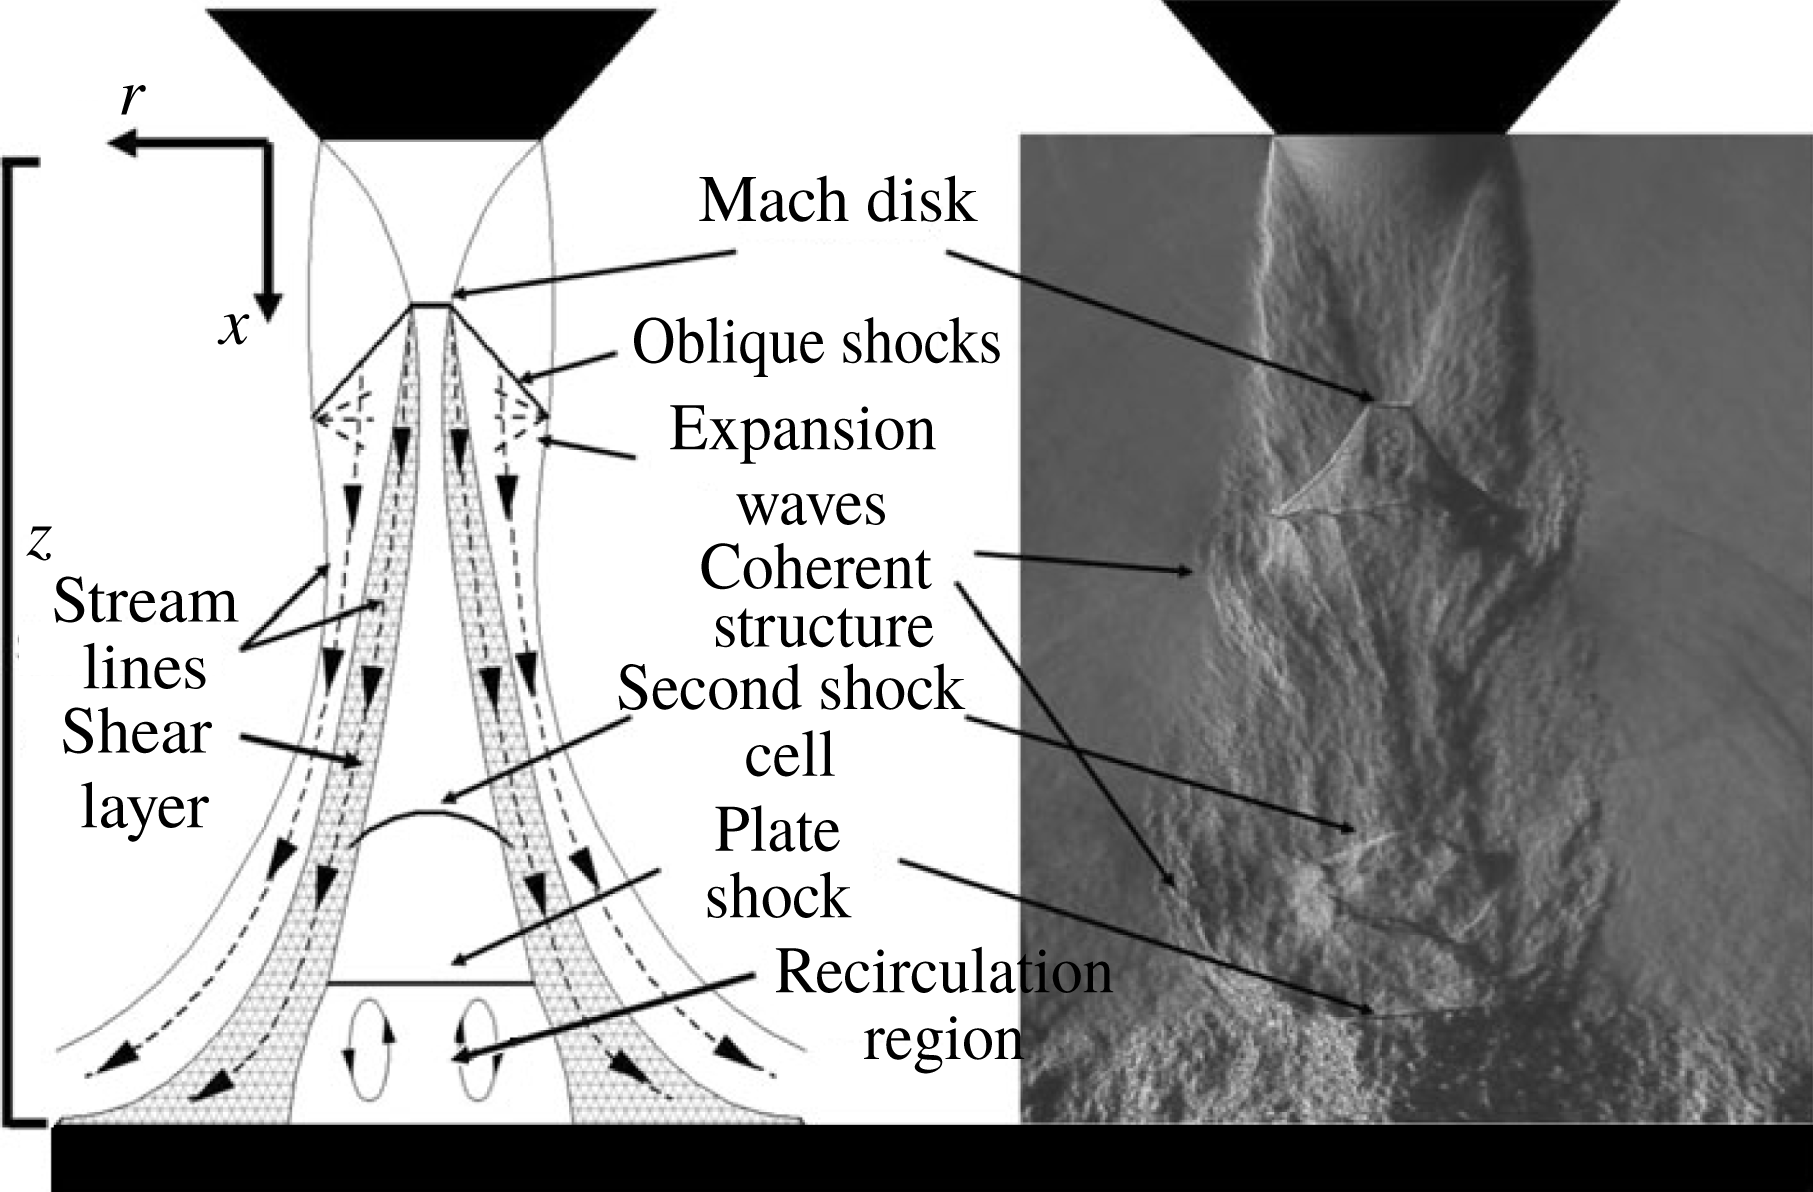
is the nozzle exit diameter. A schematic of these flow structures, along with an instantaneous schlieren image, is presented in figure 1 (Mitchell, Honnery & Soria Reference Mitchell, Honnery and Soria2012).
(a) General schematic and (b) instantaneous schlieren image of an impinging flow, with key features labelled.

The discrete tones of an impinging jet, termed impingement tones, were first noted by Marsh (Reference Marsh1961). A feedback loop was proposed as the mechanism of these intense tones (Nosseir & Ho Reference Nosseir and Ho1982). This feedback loop consisted of two components; the upstream propagating acoustic waves and the downstream travelling coherent structures (Tam & Ahuja Reference Tam and Ahuja1990). The acoustic waves propagate from the impingement surface and travel upstream to perturb the near-exit shear layer (Mitchell et al. Reference Mitchell, Honnery and Soria2012). These small perturbations coalesce and entrain fluid, growing into large-scale vortices as they travel downstream (Brown & Roshko Reference Brown and Roshko1974). The coherent structures then interact with the plate surface, creating new acoustic waves (Nosseir & Ho Reference Nosseir and Ho1982; Henderson & Powell Reference Henderson and Powell1993; Weightman et al. Reference Weightman, Amili, Honnery, Soria and Edgington-Mitchell2017b ).
The azimuthal modes can be axisymmetric (toroidal), helical or flapping (Powell Reference Powell1988), and these represent the large-scale, coherent structures of the flow. These structures are cyclic (Powell Reference Powell1988) and contribute a large fraction of the jet’s turbulent kinetic energy (Brown & Roshko Reference Brown and Roshko1974). The general flow structures of an impinging jet on a flat plate have been studied in depth (Ho & Nosseir Reference Ho and Nosseir1981; Nosseir & Ho Reference Nosseir and Ho1982; Krothapalli Reference Krothapalli1985; Henderson & Powell Reference Henderson and Powell1993; Kuo & Dowling Reference Kuo and Dowling1996; Henderson et al. Reference Henderson, Bridges and Wernet2005), but more work is required to understand the selection of a viable feedback process and the resultant dominant azimuthal mode.
Powell (Reference Powell1953a ) formulated two equations to describe the feedback process for edgetone formation, although they are equally applicable to the impinging case (Powell Reference Powell1988). The first equation describes the feedback path undertaken by the components of the feedback loop required to generate a discrete tone frequency:
 $$\begin{eqnarray}\frac{N+p}{f}=\int _{0}^{h_{c}}\frac{\text{d}h}{u_{c}}+\frac{h_{s}}{U_{s}}.\end{eqnarray}$$
Here, the number of new vortices formed at a given azimuthal location during one period of the feedback cycle defines the value of
 $N$
. The terms with a subscript
 $s$
are based on the acoustic wave characteristics. The acoustic propagation path, of length
 $h_{s}$
, is taken as a straight line from the sound source location to the nozzle lip. Along this path, the wave is assumed to propagate at a mean wave speed,
 $U_{s}$
, typically taken as the local speed of sound. The terms with subscript
 $c$
describe the convective motion of the large-scale vortices within the shear layer as they travel downstream. The line integral defines the path that these vortices follow, with varying convective velocity,
 $u_{c}$
. Lastly,
 $p$
is the phase delay between the vortical structures at the sound source location and the generated acoustic wave (Powell Reference Powell1988; Weightman et al.
Reference Weightman, Amili, Honnery, Soria and Edgington-Mitchell2017b
). For a known feedback path and propagation velocities for the given components, a single tone frequency will be predicted for a given
 $N$
value. The difficulty in evaluating this equation is in determining the path of the feedback process and the convective/acoustic velocities of each component.
The second equation, Powell’s gain criterion, is given below:
 $$\begin{eqnarray}q_{h}\unicode[STIX]{x1D702}_{r}\unicode[STIX]{x1D702}_{p}\unicode[STIX]{x1D702}_{g}\geqslant 1.\end{eqnarray}$$
Where
 $q_{h}$
is the amplification factor of shear layer disturbances along the path
 $h$
, which is a function of the disturbance frequency (Morris Reference Morris2010) and independent of the acoustic path. The
 $\unicode[STIX]{x1D702}$
are the efficiency values of the following three processes: the receptivity of the shear layer instabilities to acoustic waves,
 $r$
, the propagation of acoustic waves,
 $p$
, and the generation of acoustic waves,
 $g$
. Thus, a path will be selected that maximises the left-hand side of (1.2). Unlike (1.1), this equation does not provide a single result. Instead it describes the requirement that for an aeroacoustic feedback cycle to grow, the product of the efficiency terms and the amplification of an instability must be greater than unity. Additionally, the gain equation highlights that a feedback process which results in the largest product of these terms will form the dominant feedback cycle, regardless of the feedback path required.
The components of the gain criterion have been independently studied for both free and impinging flows. The receptivity process,
 $\unicode[STIX]{x1D702}_{r}$
, for a compressible shear layer has been investigated using a theoretical and numerical approach, expanding on the mechanism for energy transfer to the shear layer instabilities (Barone & Lele Reference Barone and Lele2005). For free jets Raman (Reference Raman1997) measured the effect on the acoustic generation due to an increase in nozzle lip thickness. Changing the lip thickness,
 $t$
, from
 $0.2D$
to
 $1.0D$
resulted in an increase in sound pressure level (SPL), which was suggested to be a result of the increase in acoustic reflection from the thicker-lip section. Similarly, Kweon et al. (Reference Kweon, Miyazato, Aoki, Kim and Setoguchi2006) noted increased fluctuations for increasing lip thickness in an underexpanded flow. In addition, Ponton & Seiner (Reference Ponton and Seiner1992) observed a change in the azimuthal mode of the flow when the lip thickness was increased. The change in azimuthal mode was attributed to a difference in initial entrainment and/or an increased amplification of the shear layer disturbances and efficiency of the receptivity process for a given azimuthal mode. The same effect was observed recently in a global stability analysis of a screeching jet (Beneddine, Mettot & Sipp Reference Beneddine, Mettot and Sipp2015). A change in mode was also observed in an impinging supersonic jet as the nozzle lip thickness increased from
 $0.1D$
to
 $7.0D$
(Weightman et al.
Reference Weightman, Amili, Honnery, Edgington-Mitchell and Soria2017a
). As free and impinging jets are driven by similar feedback processes, nozzle lip thickness can also be an important parameter for an impinging flow (Stegeman et al.
Reference Stegeman, Pérez, Soria and Theofilis2016).
The efficiency of the acoustic propagation,
 $\unicode[STIX]{x1D702}_{p}$
, is dependent not only on the length of the acoustic feedback path, but also the mechanism of the acoustic propagation. The feedback loop has been shown to be closed by both neutral acoustic modes (Bogey & Gojon Reference Bogey and Gojon2017) and externally propagating acoustic waves (Powell Reference Powell1988; Henderson et al.
Reference Henderson, Bridges and Wernet2005; Mitchell et al.
Reference Mitchell, Honnery and Soria2012). Each of these processes will likely have a different efficiency.
The efficiency of the sound generation,
 $\unicode[STIX]{x1D702}_{g}$
, is likely dependent on the mechanism by which the acoustic waves are produced. In impinging flows, Weightman et al. (Reference Weightman, Amili, Honnery, Soria and Edgington-Mitchell2017b
) recently investigated a periodic, transient shock structure located in the wall jet and linked this phenomenon with the generation of acoustic waves in a process similar to shock leakage (Manning & Lele Reference Manning and Lele2000). This aligns with previous research, where the sound source was observed to be located in the wall jet region (Henderson et al.
Reference Henderson, Bridges and Wernet2005). Using large-eddy simulation (LES) studies Gojon, Bogey & Marsden (Reference Gojon, Bogey and Marsden2016) and Bogey & Gojon (Reference Bogey and Gojon2017) proposed the combination of two models for predicting the feedback process of an impinging supersonic jet. The first is the aeroacoustic model first developed by Ho & Nosseir (Reference Ho and Nosseir1981) and Nosseir & Ho (Reference Nosseir and Ho1982), with the second being adapted from a wave analysis presented by Tam & Ahuja (Reference Tam and Ahuja1990). The combination of these models allows for the prediction of the possible tone frequency and either the axisymmetric or helical nature of the jet instability. The occurrence of a particular tone is more likely when there exists acoustic waves with group and phase velocities in the upstream direction close to the ambient speed of sound for a particular frequency.
In this paper, the role of external surface boundary conditions of the nozzle on the flow is investigated for several geometries and surface materials via acoustic measurements, high-resolution particle image velocimetry (PIV), and ultra-high-speed schlieren visualisations of impinging supersonic flows. The initial results of § 3 detail the flow emanating from the thin- and infinite-lip nozzles. Informed via proper orthogonal decomposition (POD), a difference in the dominant azimuthal instability mode is present between the two impinging flows. Two explanations for the observed instability mode change are proposed in § 4, along with a method to test these explanations. This is accomplished via acoustic and PIV measurements of different nozzle geometries and surface materials. Following interesting results of the foam-lip condition, § 5 investigates additional foam configurations to compare acoustic feedback paths based on variations in produced acoustic spectra. It is concluded that a difference in acoustic feedback path occurs between the thin- and infinite-lip boundary conditions. Lastly in § 5.3, a hypothesis is proposed involving the inferred differences in aeroacoustic feedback paths for the various nozzle configurations using Powell’s feedback equation.
2 Methodology
2.1 Experimental set-up
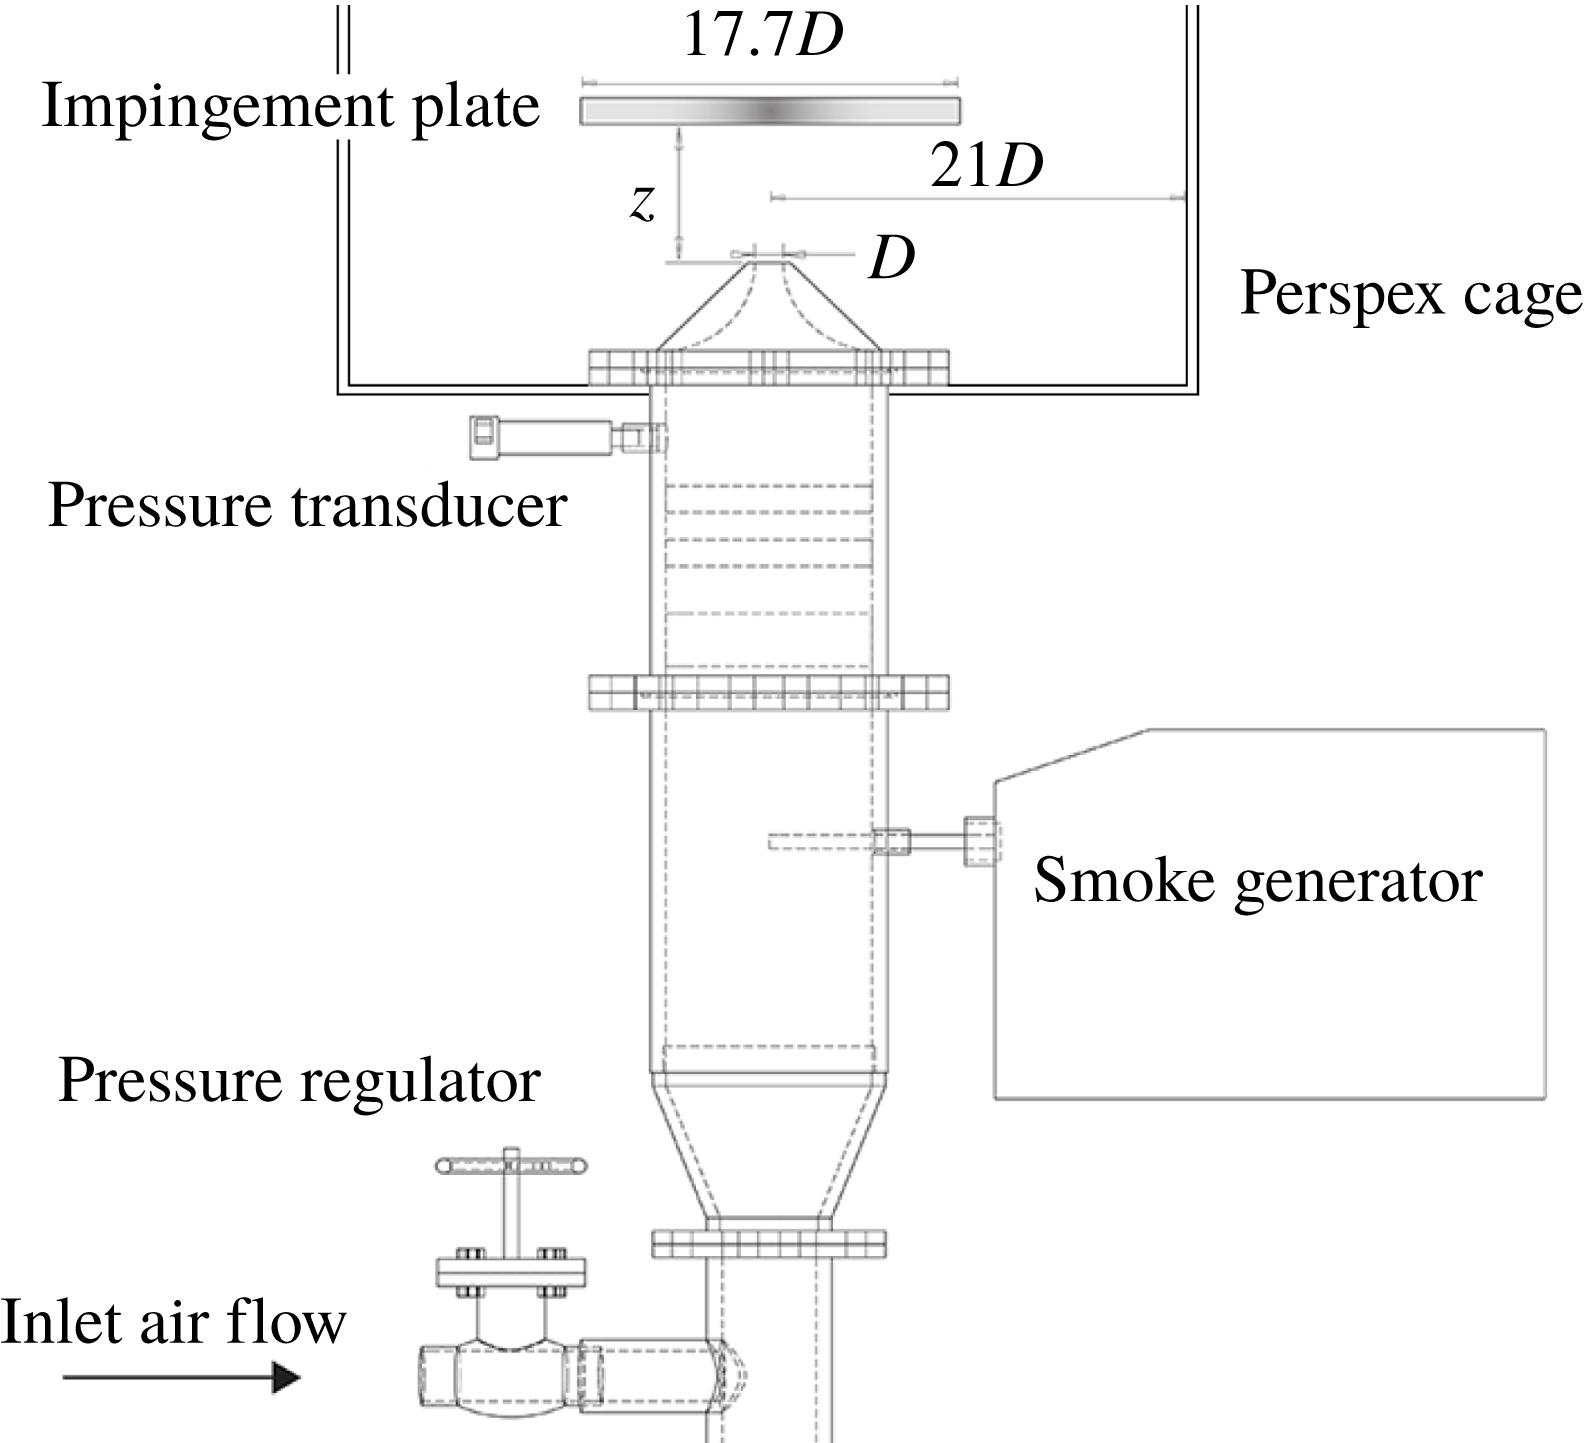
A schematic of the Laboratory for Turbulence Research in Aerospace and Combustion (LTRAC) gas jet facility is presented in figure 2. The test section is surrounded by a square cage of Perspex, with side dimensions of
 $42D$
. An air line from a compressor supplies the jet with high pressure air. The stagnation pressure was measured in the plenum chamber using an RS-461 pressure transducer to an accuracy of
 $\pm 0.25\,\%$
. The flow field was seeded using a ViCount 1300 smoke generator. The entrainment region was seeded by the bulk flow from the nozzle, which is aided by the impingement surface. Past experiments (Mitchell, Honnery & Soria Reference Mitchell, Honnery and Soria2013) using the same smoke generator found seeding particles of approximately 600 nm in diameter, given a measured relaxation time of approximately
 $2~\unicode[STIX]{x03BC}\text{s}$
(Melling Reference Melling1997). The particles are assumed to be mono-disperse and seeded both the jet and the entrainment field. The smoke particles were diffraction limited with a diameter of
 $18~\unicode[STIX]{x03BC}\text{m}$
.
Schematic of the LTRAC gas jet facility.

A 15 mm diameter converging nozzle, with a lip thickness of
 $0.1D$
was used as the base nozzle for the experiments. A large cap with a diameter of
 $15D$
was manufactured to fit atop the base nozzle to allow comparison between the different external boundary conditions of the nozzle for a thin-lip and effectively infinite-lip nozzle. This case will be referred to as the infinite-lip case. The impingement surface was a square metal plate with a side length of
 $17.7D$
located
 $5.0D$
from the nozzle exit. The plate is positioned downstream of the third shock cell of a free jet at the same flow conditions, and well before the end of the jet core (Edgington-Mitchell et al.
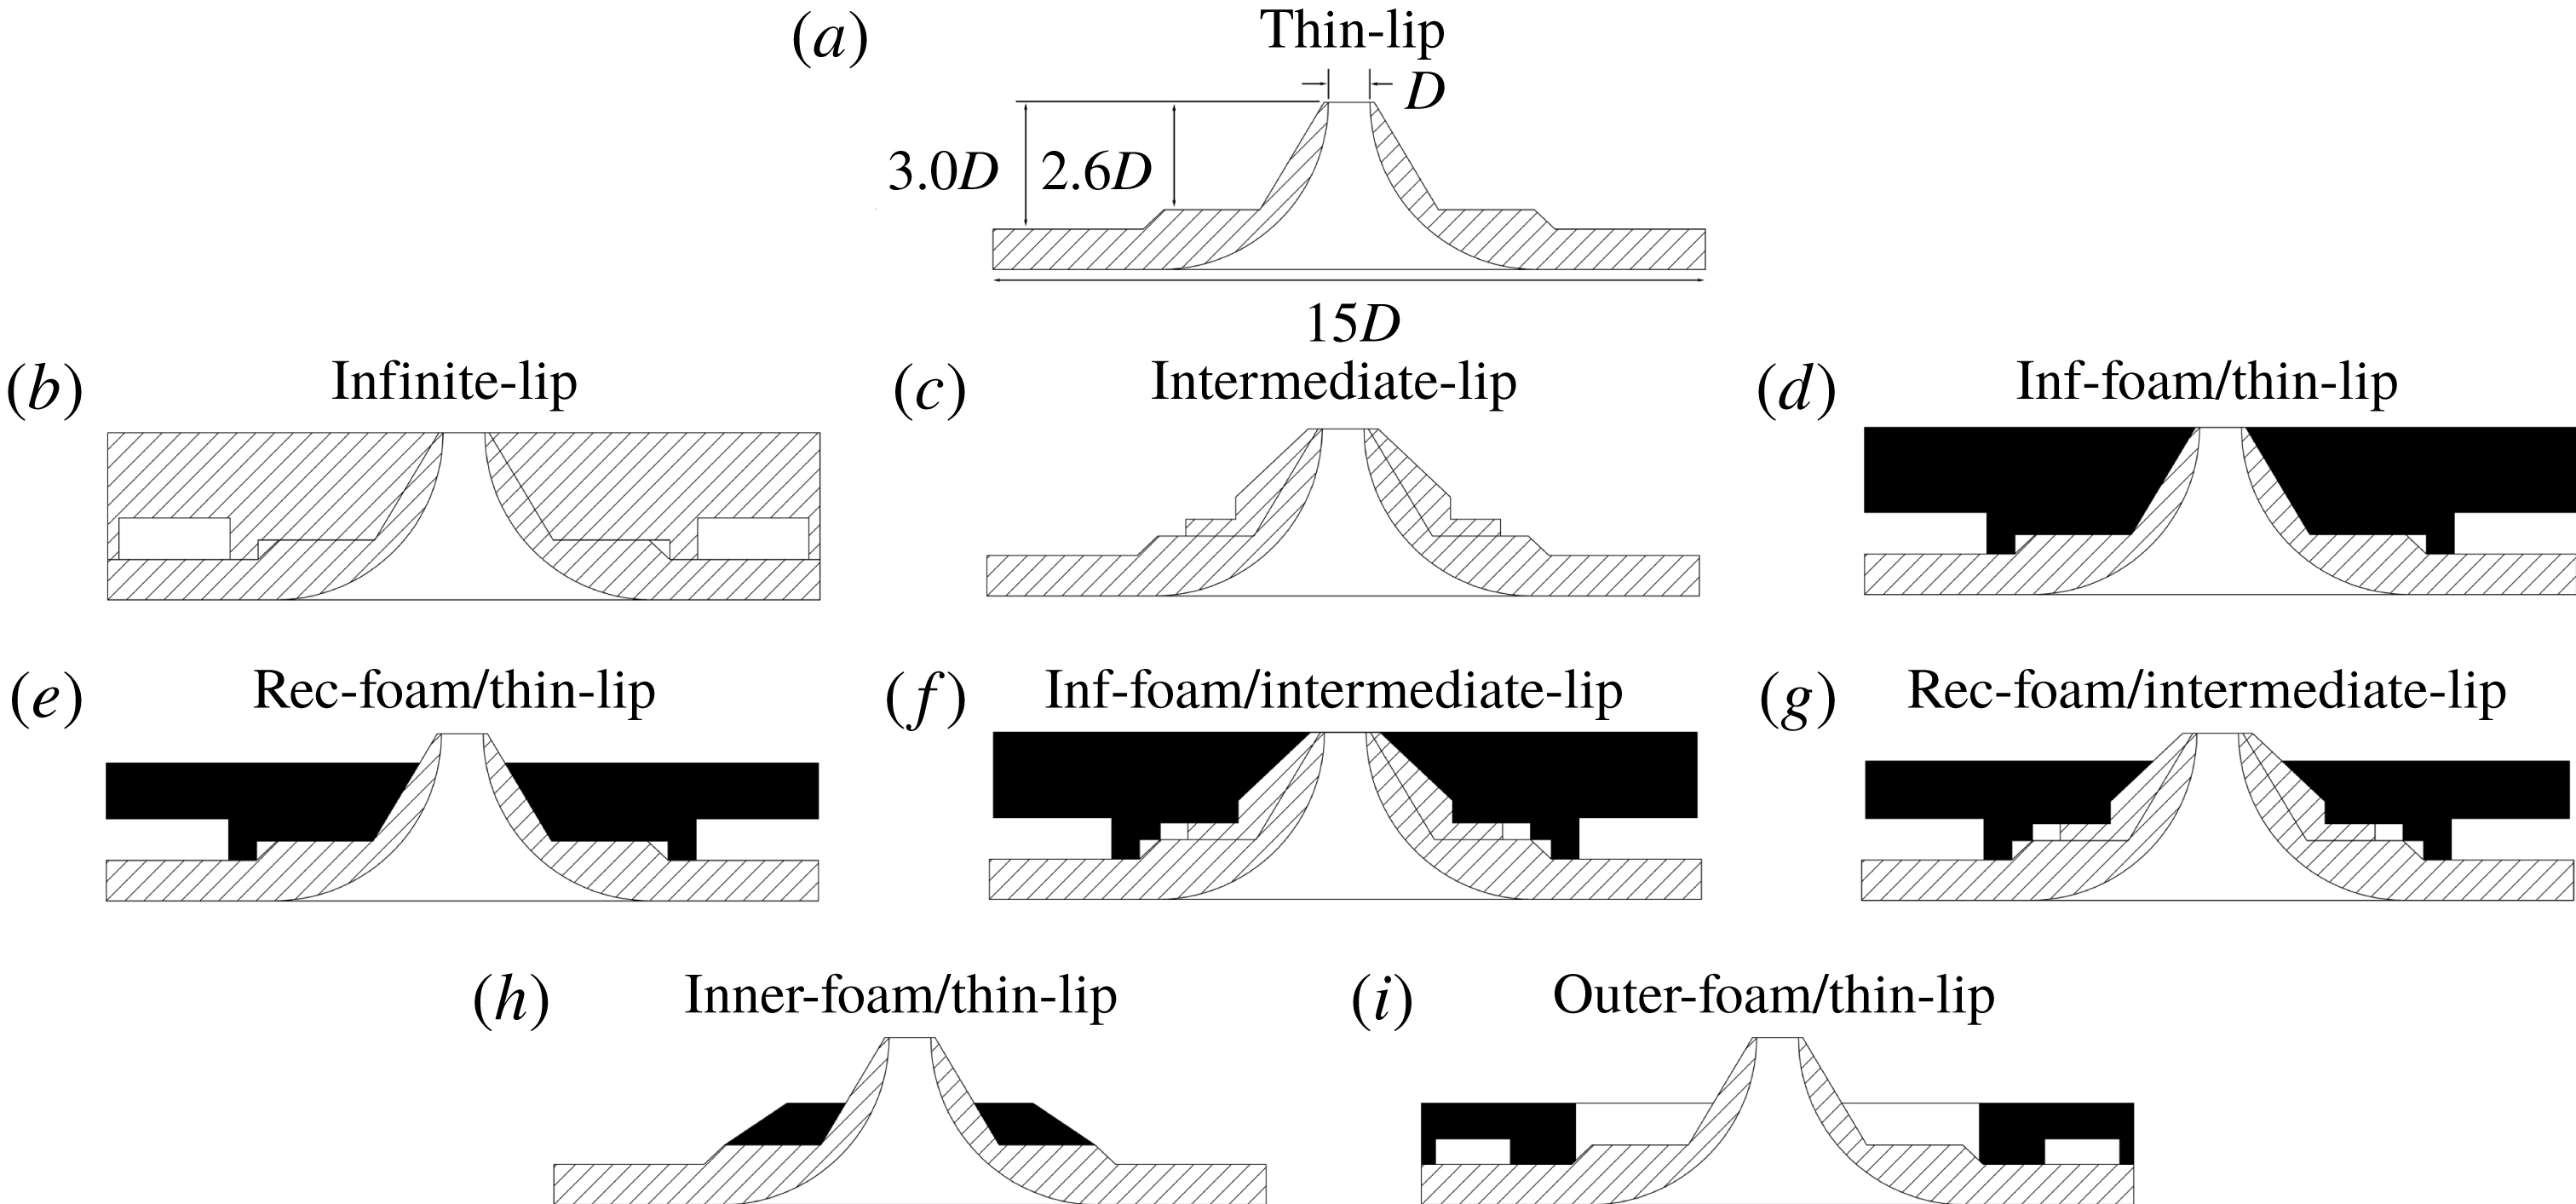
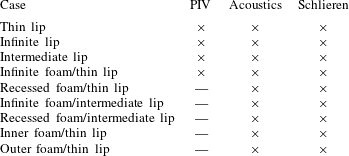
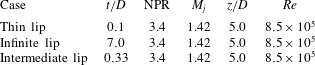
Reference Edgington-Mitchell, Oberleithner, Honnery and Soria2014). To test a hypothesis proposed later in the paper, a range of nozzles were manufactured. Schematics of the nozzles are given in figure 3, with the experimental techniques used and flow conditions presented in tables 1 and 2, respectively. These flow conditions, including the nozzle stand-off distance, were observed in preliminary schlieren visualisations to have large spatial growth rates of the vortical structures and high strength acoustic waves. These characteristics made the jet ideal for investigation of the flow dynamics of an impinging supersonic jet.
Cross-section of the nozzles used for the experiments. Single hatch is metal, solid black is acoustic dampening foam; ‘inf’ and ‘rec’ indicate infinite and recessed respectively.

Experimental techniques used to measure and visualise the various flows.

Experimental conditions of the non-foam nozzle cases.

Acoustic measurements were obtained with a G.R.A.S. type 46BE 1/4 in. pre-amplified microphone with a frequency range of 20 Hz–100 kHz. A total of 500 k samples were recorded on a National Instruments DAQ at a sample rate of 200 kHz. The microphone was directed toward the nozzle lip at a radial location
 $30D$
from the jet centreline in line with the nozzle lip, outside the PIV test chamber. Calibration was performed using a G.R.A.S. type 42AB sound calibrator and a reference pressure of
 $20\times 10^{-6}~\text{Pa}$
. This is a non-anechoic environment and thus amplitude comparisons are primarily qualitative in nature. A moving window of length
 $2^{12}$
and overlap of 50 % was used to process the pressure measurements. This resulted in a frequency resolution of 24.4 Hz.
Ultra-high-speed schlieren images were recorded from a Toepler Z-type schlieren apparatus at 500 kfps using a Shimadzu HPV-1 camera, with a resolution of
 $260\times 312~\text{px}$
and an exposure time of
 $0.5~\unicode[STIX]{x03BC}\text{s}$
. The schlieren was captured in a different jet facility, which has the same characteristics as that of figure 2, minus the smoke generator and the Perspex cage. The acoustic signatures of like conditions were compared between the two facilities to ensure the same flow phenomenon was being observed. For two of the flow conditions, the outer-foam/thin-lip nozzle case and the recessed-foam/thin-lip case, the acoustic measurements of the two facilities did not match. Thus, the schlieren was not able to be used to investigate the characteristics of these flows.
For the thin- and infinite-lip datasets; single exposed image pairs were acquired using a 12-bit Imperx B6640 camera with a CCD array of
 $6600\times 4400~\text{px}$
at a rate of 1 Hz. A magnification of 0.47 was achieved using a 200 mm Micro-Nikkor lens, with a Nikon PK-12 extension ring. For the intermediate-lip and infinite-foam/thin-lip cases, single exposed image pairs were acquired using a 12-bit Imperx B4820 camera with a CCD array of
 $4904\times 3280~\text{px}$
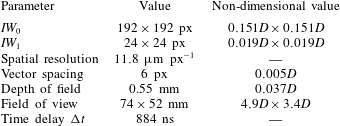
at a rate of 3 Hz. Again, a magnification of 0.47 was achieved using a 200 mm Micro-Nikkor lens, with a Nikon PK-12 extension ring. The particle field was illuminated using a diverging light sheet of approximately 1 mm thickness produced from a dual cavity pulsed Nd:YAG laser at 532 nm, with a maximum pulse energy of 200 mJ. The pulse timing,
 $\unicode[STIX]{x0394}t$
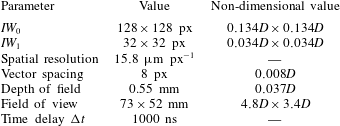
, was 884 ns. The PIV parameters are summarised in tables 3 and 4 for the higher and lower resolution cases, respectively.
The multigrid cross-correlation algorithm of Soria (Reference Soria1996) was used to analyse the particle images, allowing for a minimum resolvable displacement of 0.1 px. The multigrid algorithm is particularly useful due to the large velocity differences between the potential core and entrainment field. Thus an initial window size,
 $IW_{0}$
, of 192
 $\times$
192 px and a final window size,
 $IW_{1}$
, of 24
 $\times$
24 px was selected for the PIV processing of the higher resolution data, with an initial window size,
 $IW_{0}$
, of 128
 $\times$
128 px and a final window size,
 $IW_{1}$
, of 32
 $\times$
32 px selected for the lower resolution cases. For all datasets, a normalised median threshold of 3.0 and dynamic mean test of 1.0 with a standard deviation of 1.0 were used for validation.
PIV parameters for the thin- and infinite-lip cases.

PIV parameters for the intermediate-lip and infinite-foam/thin-lip cases.

2.2 Proper orthogonal decomposition
POD (Sirovich Reference Sirovich1987; Berkooz, Holmes & Lumley Reference Berkooz, Holmes and Lumley1993; Meyer, Pedersen & Özcan Reference Meyer, Pedersen and Özcan2007) was utilised to extract the coherent fluctuations associated with the feedback loop of the flow. POD constructs a set of basis functions that optimally represent the ensemble of fluctuating velocities, via the solution of the eigenvalue problem given by (2.1):
 $$\begin{eqnarray}\unicode[STIX]{x1D64D}\unicode[STIX]{x1D742}=\unicode[STIX]{x1D706}\unicode[STIX]{x1D742}.\end{eqnarray}$$
The autocovariance matrix,
 $\unicode[STIX]{x1D64D}$
, is constructed from the velocity snapshots such that:
 $$\begin{eqnarray}\unicode[STIX]{x1D64D}=\boldsymbol{V}^{\text{T}}\boldsymbol{V}\end{eqnarray}$$
and
 $$\begin{eqnarray}\boldsymbol{V}=[\boldsymbol{u}^{\prime 1}~\boldsymbol{u}^{\prime 2}~\cdots ~\boldsymbol{u}^{\prime N}]=\left[\begin{array}{@{}cccc@{}}u_{11}^{\prime 1} & u_{11}^{\prime 2} & \cdots \, & u_{11}^{\prime N}\\ \vdots & \vdots & \cdots \, & \vdots \\ u_{lm}^{\prime 1} & u_{lm}^{\prime 2} & \cdots \, & u_{lm}^{\prime N}\\ v_{11}^{\prime 1} & v_{11}^{\prime 2} & \cdots \, & v_{11}^{\prime N}\\ \vdots & \vdots & \cdots \, & \vdots \\ v_{lm}^{\prime 1} & v_{lm}^{\prime 2} & \cdots \, & v_{lm}^{\prime N}\end{array}\right]\end{eqnarray}$$
where each velocity snapshot,
 $u^{\prime j}$
, is an
 $l\times m$
vector.
Solving (2.1) yields the eigenvalues,
 $\unicode[STIX]{x1D706}$
, and the eigenvectors,
 $\unicode[STIX]{x1D742}$
. The eigenvalues are sorted in descending order, i.e.
 $\unicode[STIX]{x1D706}_{1}>\unicode[STIX]{x1D706}_{2}>\cdots >\unicode[STIX]{x1D706}_{N}=0$
.
From this, the
 $n$
th spatial POD mode is given by:
 $$\begin{eqnarray}\unicode[STIX]{x1D753}_{n}(\boldsymbol{x})=\frac{\boldsymbol{V}\unicode[STIX]{x1D742}_{n}(t)}{\Vert \boldsymbol{V}\unicode[STIX]{x1D742}_{n}(t)\Vert }\end{eqnarray}$$
and the coefficients for each snapshot for the
 $n$
th mode are defined as:
 $$\begin{eqnarray}\boldsymbol{a}_{n}(t)=\unicode[STIX]{x1D742}_{n}(t)\Vert \boldsymbol{V}\unicode[STIX]{x1D742}_{n}(t)\Vert .\end{eqnarray}$$
It is important to note that mathematically, POD does not suggest what the modes represent, however it is assumed that the most energetic modes are associated with the large-scale, coherent structures of the flow (Berkooz et al. Reference Berkooz, Holmes and Lumley1993).
3 Initial results
The initial results section focuses on characterising the first two nozzle external boundary conditions: the thin-lip and infinite-lip cases. This will lead to the development of a hypothesis that will be investigated in subsequent sections using the intermediate-lip and infinite-foam thin-lip nozzle cases.
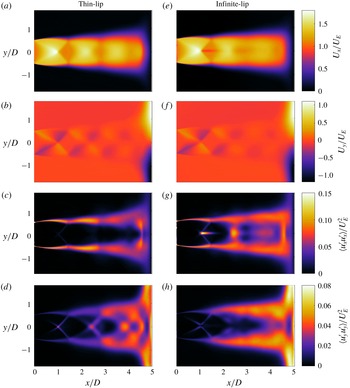
(a) Mean axial velocity, (b) mean transverse velocity, (c) variance of axial fluctuations, (d) variance of transverse fluctuations for the thin-lip jet. (e–h) The same statistics for the infinite-lip case.

3.1 Similarities and variations in the flow statistics
First- and second-order statistics for both the thin- and infinite-lip nozzles are shown in figure 4. Each statistic is calculated from over 10 000 PIV velocity vector fields and is non-dimensionalised by the choked exit velocity,
 $U_{E}=310~\text{m}~\text{s}^{-1}$
. The exit velocity was calculated by assuming isentropic expansion to the choked exit condition with a plenum chamber temperature of 287 K. Figure 4(a,e) shows the mean axial velocity for the thin- and infinite-lip cases, respectively. The global structure of the jets are similar, with both flows reaching a maximum axial velocity of approximately
 $1.8U_{E}$
prior to the first shock cell. Similarly in figure 4(b,f), both jets’ wall flows are observed to obtain a mean velocity of
 $\pm 1.1U_{E}$
in the transverse direction. The relative location of the impingement plate in the free jet, and its effect on the shock structure, can be found in Edgington-Mitchell et al. (Reference Edgington-Mitchell, Duke, Amili, Weightman, Honnery and Soria2015).
A small region of slower flow following the first shock cell is observed for the infinite-lip jet in figure 4(e). From instantaneous vector fields, this effect is correlated to an intermittent low-speed region that forms behind the first shock. This region appears to grow in size before ‘detaching’ and travelling downstream.
A large axial region of high variance for the infinite-lip case is observed around the jet centreline at the stand-off shock shown in figure 4(g). This is due to a large axial oscillation of the stand-off shock for the infinite-lip jet. The oscillation of the stand-off shock was found to be largest when the mode of the jet was axisymmetric (Powell Reference Powell1988). This region of high variance is not observed in the thin-lip case.
Additionally, small regions of high transverse variance are visible for the thin-lip case along the jet centreline shown in figure 4(d). These are not present for the infinite-lip case in figure 4(h). The regions of high variance in the thin-lip jet coincide with the jet centreline shock locations, indicating a transverse oscillation of each shock cell and the stand-off shock. This motion would be expected for flows containing a helical or flapping instability mode.
From the difference in the variance of each jet, it is proposed that the two cases are dominated by different azimuthal instability modes. It is suggested that the thin-lip jet is dominated by a non-axisymmetric mode, whereas the infinite-lip jet is dominated by an axisymmetric mode.
3.2 Acoustic analysis of the feedback cycle
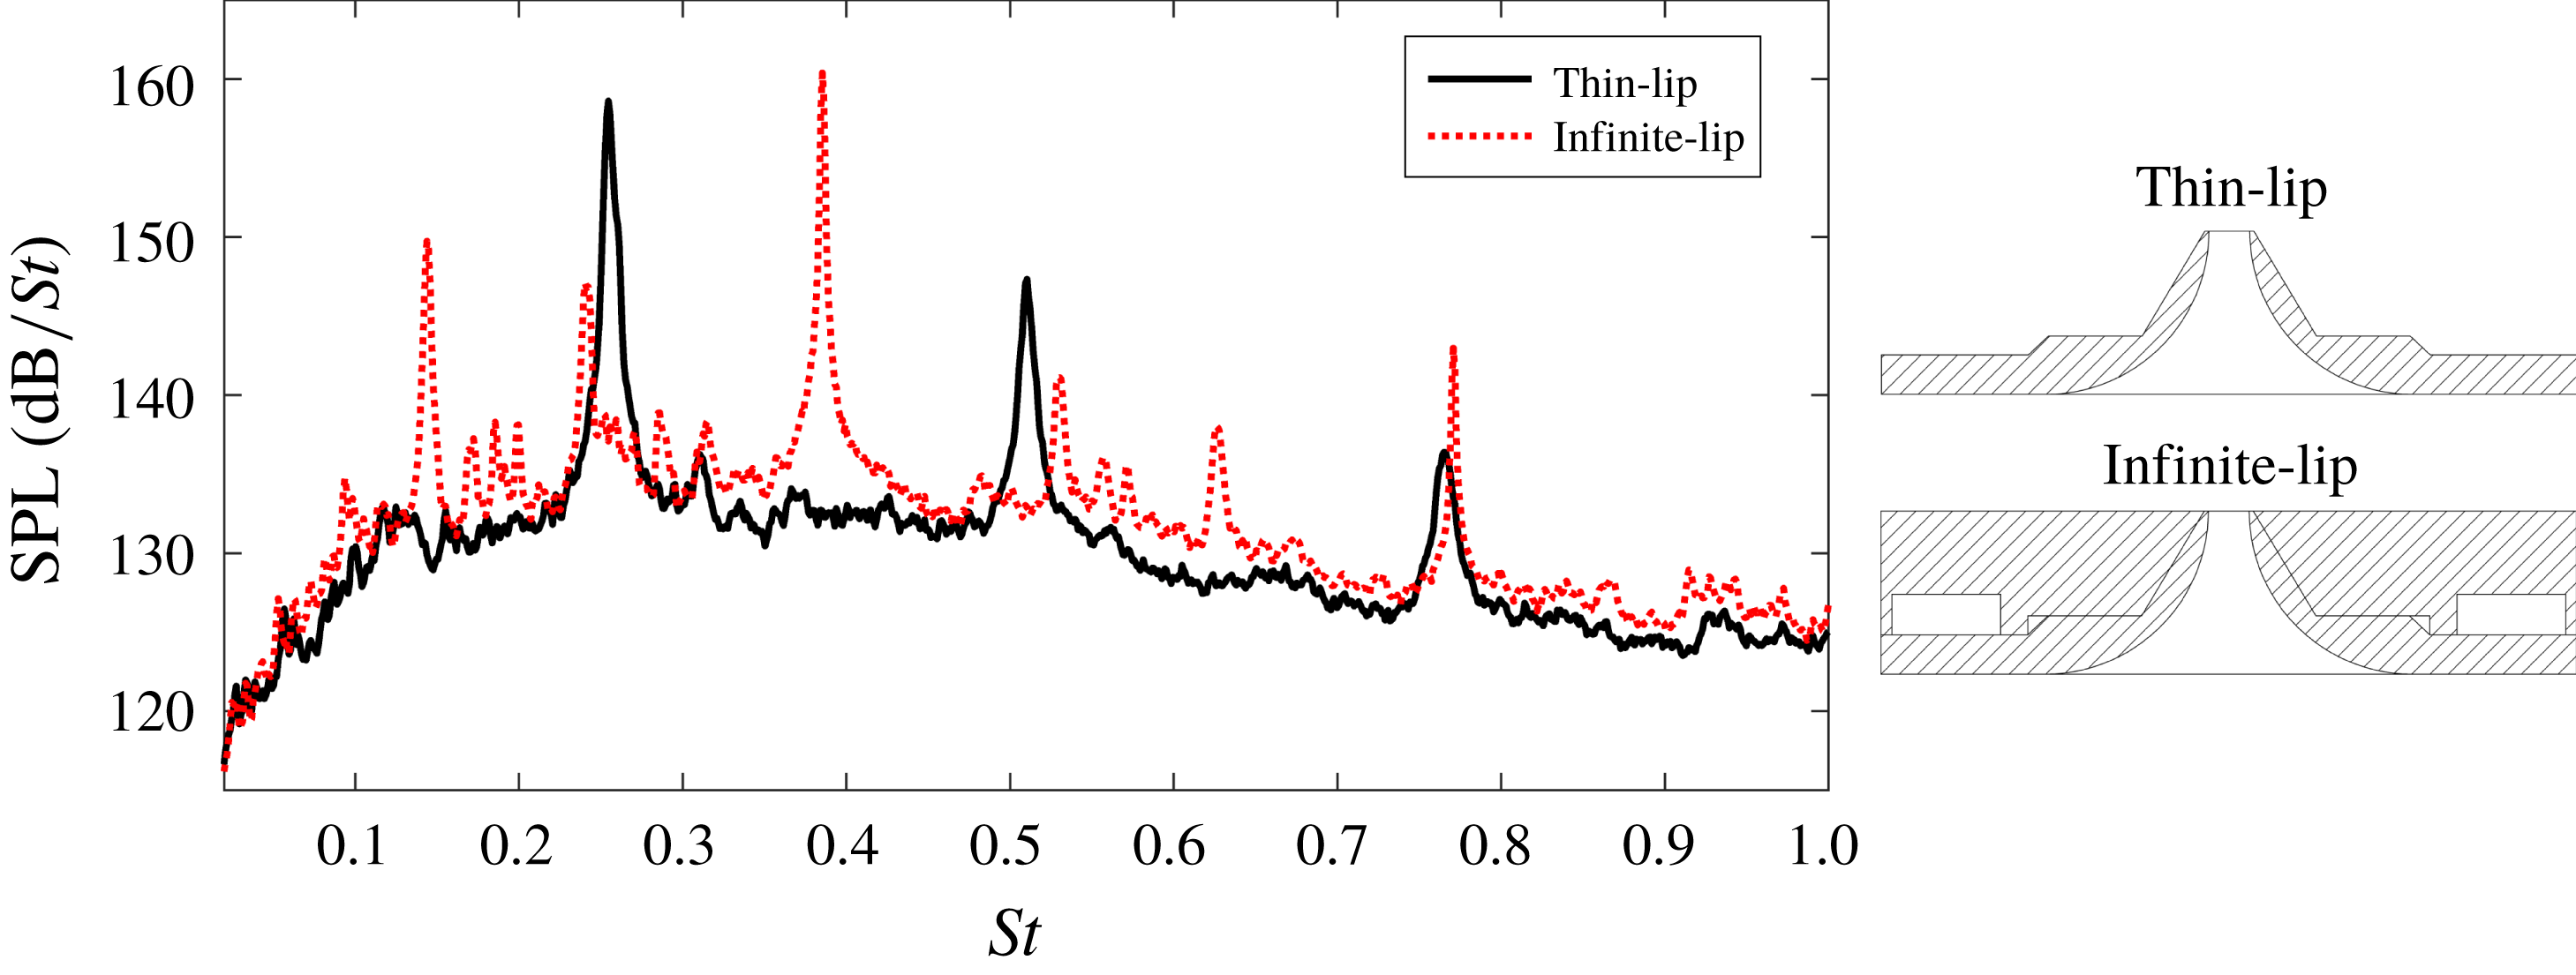
The acoustic spectra may give insight into the aeroacoustic feedback processes present in both jet flows. The spectra are illustrated for the thin- and infinite-lip cases in figure 5. The thin-lip jet exhibits a single discrete tone and several harmonics. This impingement tone has a Strouhal number of
 $St=fD_{j}/U_{j}=0.255$
, where
 $f$
is the frequency,
 $D_{j}$
is the ideally expanded nozzle diameter and
 $U_{j}$
is the ideally expanded velocity. These last two values were calculated from isentropic relations to be 0.016 m and 413 m s
 $^{-1}$
, respectively. The infinite-lip case is observed to have several high intensity tones, the highest of these being at
 $St=0.385$
. The large change in peak tone frequency suggests a change in the aeroacoustic feedback process. Additionally for the infinite-lip case, it is noted that the numerous peaks present have frequencies that are linear combinations of at least two tones. This phenomenon has been observed previously (Tam & Norum Reference Tam and Norum1992; Henderson & Powell Reference Henderson and Powell1993; Thurow, Samimy & Lempert Reference Thurow, Samimy and Lempert2002) and is linked to nonlinear interactions of two flow instabilities.
Due to the proximity of the tone at
 $St=0.241$
to that present in the thin-lip case, this tone and the higher frequency tone at
 $St=0.385$
are assumed to be the actual impingement tones of the flows, with the other peaks being linear combinations of these. This is further supported in a following section when comparing the wavelengths of structures associated with these tones. As the impingement tone occurs in the presence of a self-reinforcing feedback loop, the existence of two, non-harmonic impingement tones suggests that two separate feedback loops may be present within the flow. This will be investigated by applying POD to identify the dominant instability modes.
Acoustic spectra obtained for the —— thin- and - - - - infinite-lip jets.

3.3 Identification of the dominant azimuthal modes
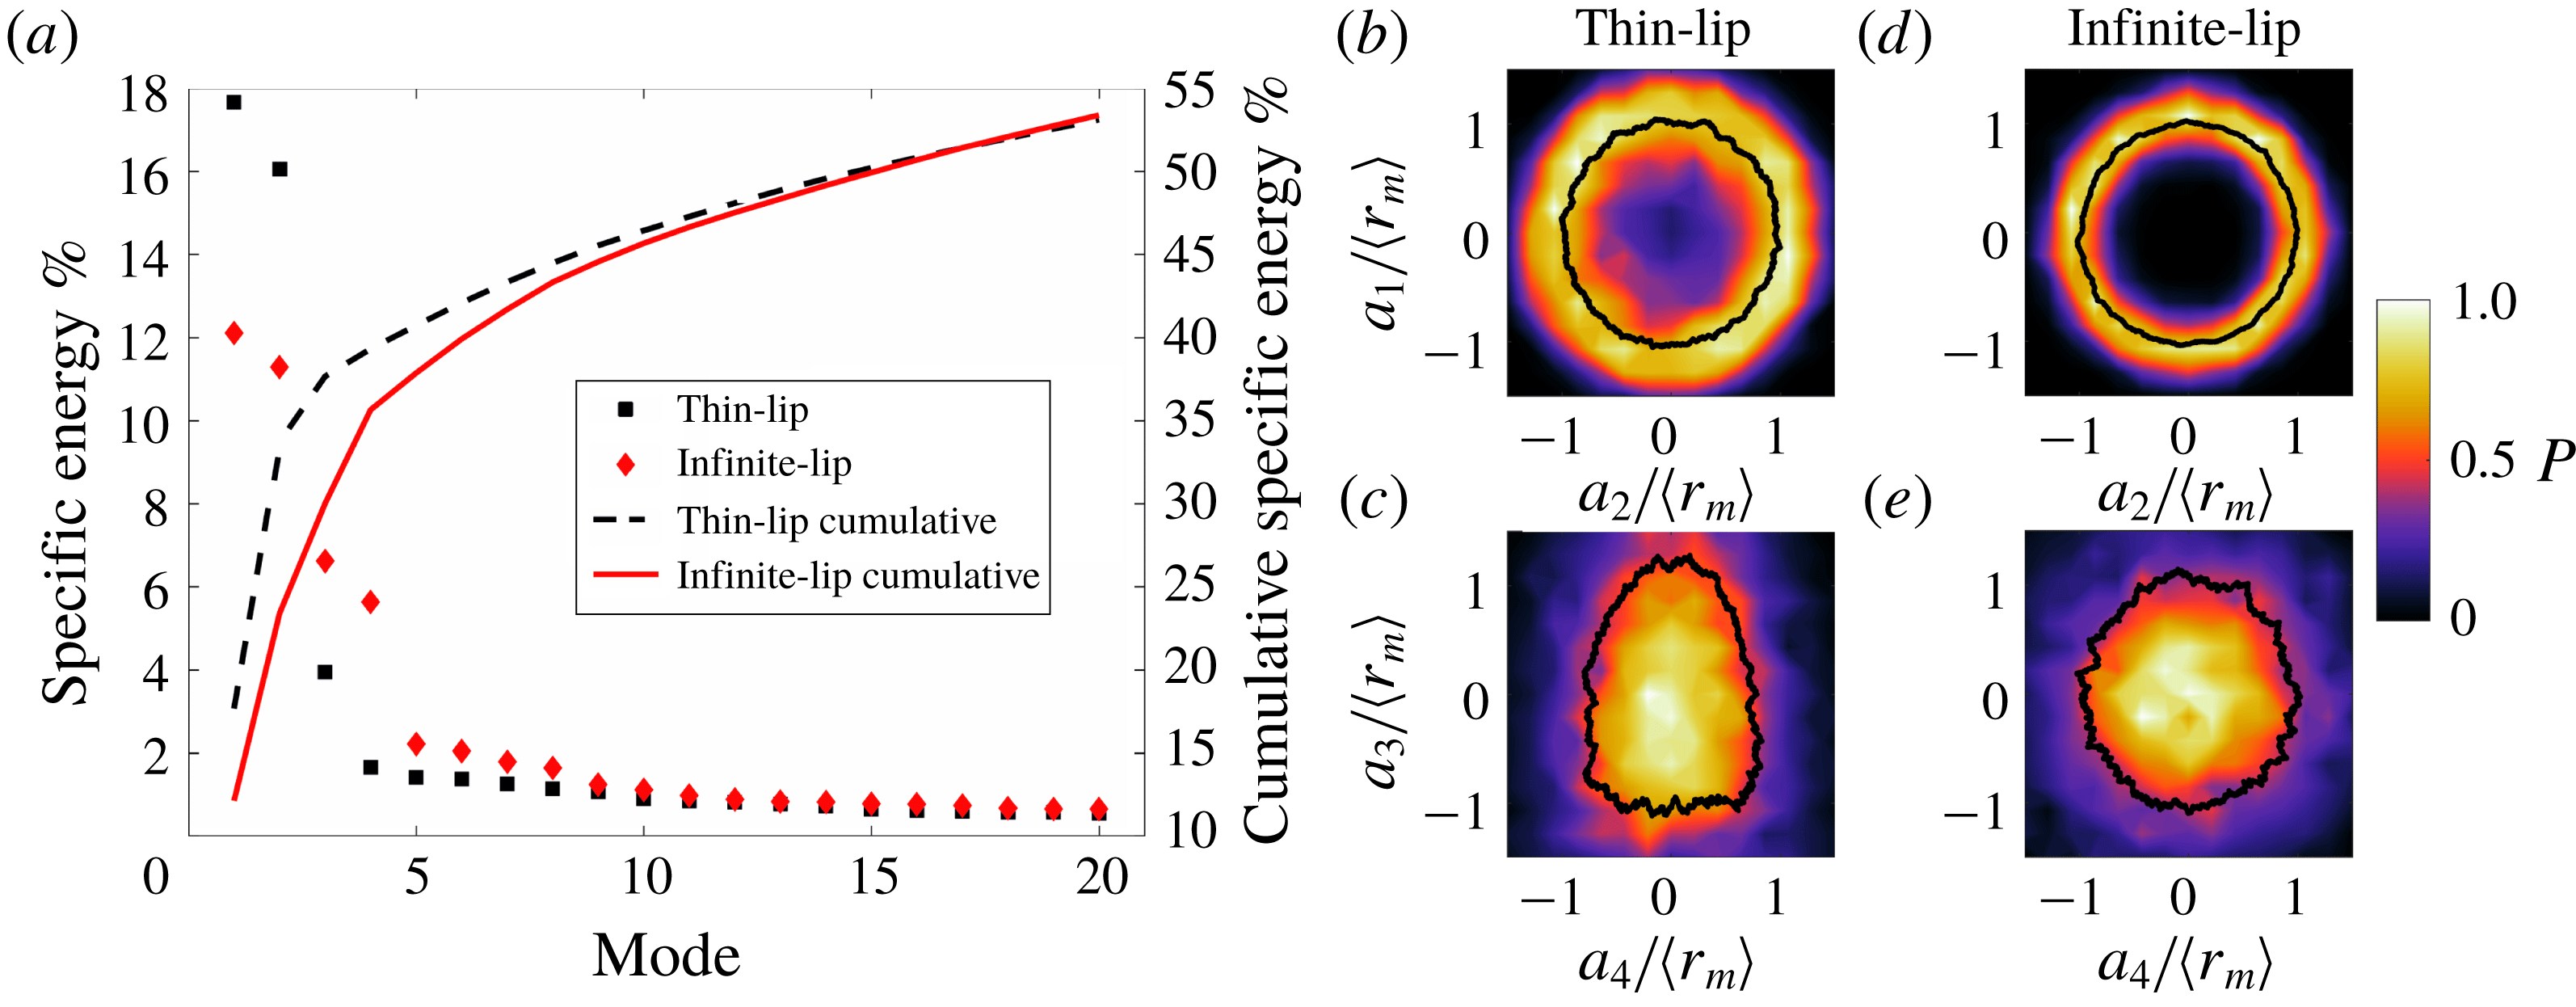
POD is performed on a dataset of over 10 000 velocity fields for each flow case. The autocorrelation matrix was composed of both the axial and transverse velocity fluctuations. The energy spectra of the 20 most energetic POD modes for each case are given in figure 6(a). The thin-lip jet is dominated by two high energy modes, each representing approximately
 $17.7\,\%$
and
 $16.1\,\%$
of the total specific kinetic energy. The third most energetic mode contains only
 $3.9\,\%$
of the specific kinetic energy, with the remaining modes each containing less than
 $2\,\%$
. Due to their low energy content, modes three and higher are omitted from the following analysis. The division of mode energy for the four most energetic modes of the infinite-lip jet is significantly different to the thin-lip case. In this case the flow is dominated by four high energy modes, with the specific kinetic energy ranging from
 $12.1$
to
 $5.6\,\%$
. Again, the remaining modes are of low energy and thus omitted from the analysis.
To determine the temporal relationship between the modes, the method of Oberleithner et al. (Reference Oberleithner, Sieber, Nayeri, Paschereit, Petz, Hege, Noack and Wygnanski2011) is used. By plotting the coefficients of the first eigenvector against those of the second eigenvector, figures 6(b,d) are produced, representing the mode coefficients of each snapshot in phase space. The coefficients are normalised by the mean amplitude,
 $\langle r_{m}\rangle =\overline{\sqrt{(a_{i}(t))^{2}+(a_{j}(t))^{2}}}$
.
 $P$
is the probability density function (PDF) normalised by the peak probability. This method has also been applied to modes three and four for both jet cases. Curves of mean radial distance have been superimposed on the plots, visualising the Lissajous curve of the two modes. A circular shape of this curve indicates that the respective modes represent an oscillatory motion and are
 $90^{\circ }$
out of phase. Modes exhibiting this shape are taken to be a modal pair. Thus modes one and two are a mode pair for the thin-lip jet and modes one and two, and three and four are mode pairs for the infinite-lip case. Due to the cardioid shape of figure 6(c), it is concluded that modes three and four of the thin-lip jet are not a mode pair. Whilst figure 6(e) is not a clear annulus distribution, the circular shape, along with the spatial structure of the POD modes, presented in figure 7, suggests that modes three and four are indeed a modal pair.
(a) Specific kinetic energy of the 20 most energetic orthogonal modes and (b–e) phase portraits of the POD mode coefficients for the thin- and infinite-lip cases. The solid line on the phase portraits is the mean radial distance representing a Lissajous curve.

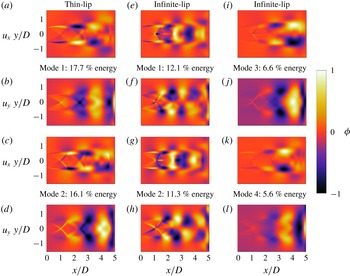
The dominant mode pairs for each flow are presented in figure 7, separated in their axial and transverse components. For the thin-lip case, the axial components are both antisymmetric about the jet centreline, whereas the transverse components are symmetric. By considering the flow velocity induced by the large-scale vortices as they travel downstream within the shear layer, it is determined that this mode pair represents a dominant, helical or flapping mode for the thin-lip jet. Since the dominant mode pair energy is significantly higher than the remaining modes, and a precessing flapping dominated jet would have a broad energy distribution (Tan et al.
Reference Tan, Soria, Honnery and Edgington-Mitchell2017), the instability mode is assumed to be an
 $m=\pm 1$
, helical mode.
For the infinite-lip jet the first two modes are seen to be different to the helical mode of the thin-lip case, as shown in figure 7. For these modes, the axial components are symmetric about the jet axis, with the transverse components being antisymmetric. Again, considering the flow induced by the shear layer vortices, the POD structure is indicative of a primary,
 $m=0$
, axisymmetric mode for the infinite-lip jet. Additionally, the third and fourth modes show a similar structure to the helical mode of the thin-lip jet. This suggests that the infinite-lip also contains an
 $m=\pm 1$
, helical instability mode. A similar superposition of these two azimuthal modes was observed recently by Gojon & Bogey (Reference Gojon and Bogey2017) in LES results of an underexpanded supersonic jet impinging on a flat plate.
(a–d) The two dominant POD modes of the thin-lip nozzle case, as well as (e–l) the first four dominant POD modes of the infinite-lip case. Each mode is normalised and separated into its axial and transverse components.

The helical azimuthal modes of the thin- and infinite-lip jet appear similar in overall structure. To determine the modal wavelengths, a peak to peak distance,
 $\unicode[STIX]{x1D706}$
, along the jet centreline is measured for the transverse component of the POD modes for each case. By comparing peak to peak values, the wavelengths of these modes match well between the two flows, at
 $\unicode[STIX]{x1D706}_{Thin}=2.0D$
and
 $\unicode[STIX]{x1D706}_{Inf,Helical}=1.94D$
. If these modes correspond to the tone frequencies of
 $St=0.255$
and
 $0.241$
, the thin- and infinite-lip helical modes would have a convective velocity of
 $0.48U_{j}$
and
 $0.44U_{j}$
, respectively. This agrees well with the value found in the literature (Krothapalli et al.
Reference Krothapalli, Rajkuperan, Alvi and Lourenco1999; Gojon et al.
Reference Gojon, Bogey and Marsden2016). This analysis supports the claim that the peak at
 $St=0.241$
in the infinite-lip case is a dominant impingement tone, rather than the tone at
 $St=0.144$
, for which no corresponding structure is observed in the data.
From the acoustics, a single impingement tone is present in the thin-lip case, with the infinite-lip exhibiting two impingement tones. The former is a result of the aeroacoustic feedback loop that is characterised by the helical instability mode identified in the POD. Of the two tones present in the infinite-lip case, the lower frequency tone is concluded to be linked to the helical instability mode, given its similar frequency and spatial wavelength to that of the thin-lip jet. This suggests that the higher frequency tone of
 $St=0.385$
is a result of the higher energy, axisymmetric azimuthal mode.
The POD has demonstrated that the two nozzle flows are dominated by different azimuthal modes. The thin-lip case contains a single helical mode, whereas the infinite-lip jet contains two azimuthal modes. The first of these modes is axisymmetric, with the second being a helical mode similar to that of the thin-lip case. The observation of the dominant mode shift differs to the findings of Ponton & Seiner (Reference Ponton and Seiner1992), where increasing the lip thickness in a free jet resulted in a staging change of the dominant peak tone from B to C (flapping to helical) (Powell Reference Powell1953b ; Powell, Umeda & Ishii Reference Powell, Umeda and Ishii1992). However the simultaneous presence of the toroidal and helical instability modes has been observed previously when using upstream reflectors in a screeching jet (Vinoth, Throvagunta & Rathakrishnan Reference Vinoth, Throvagunta and Rathakrishnan2011). The mechanism for the dominant mode shift will be investigated in the following sections.
4 Potential mechanisms for the azimuthal mode switch
4.1 Differentiating between the possible mechanisms
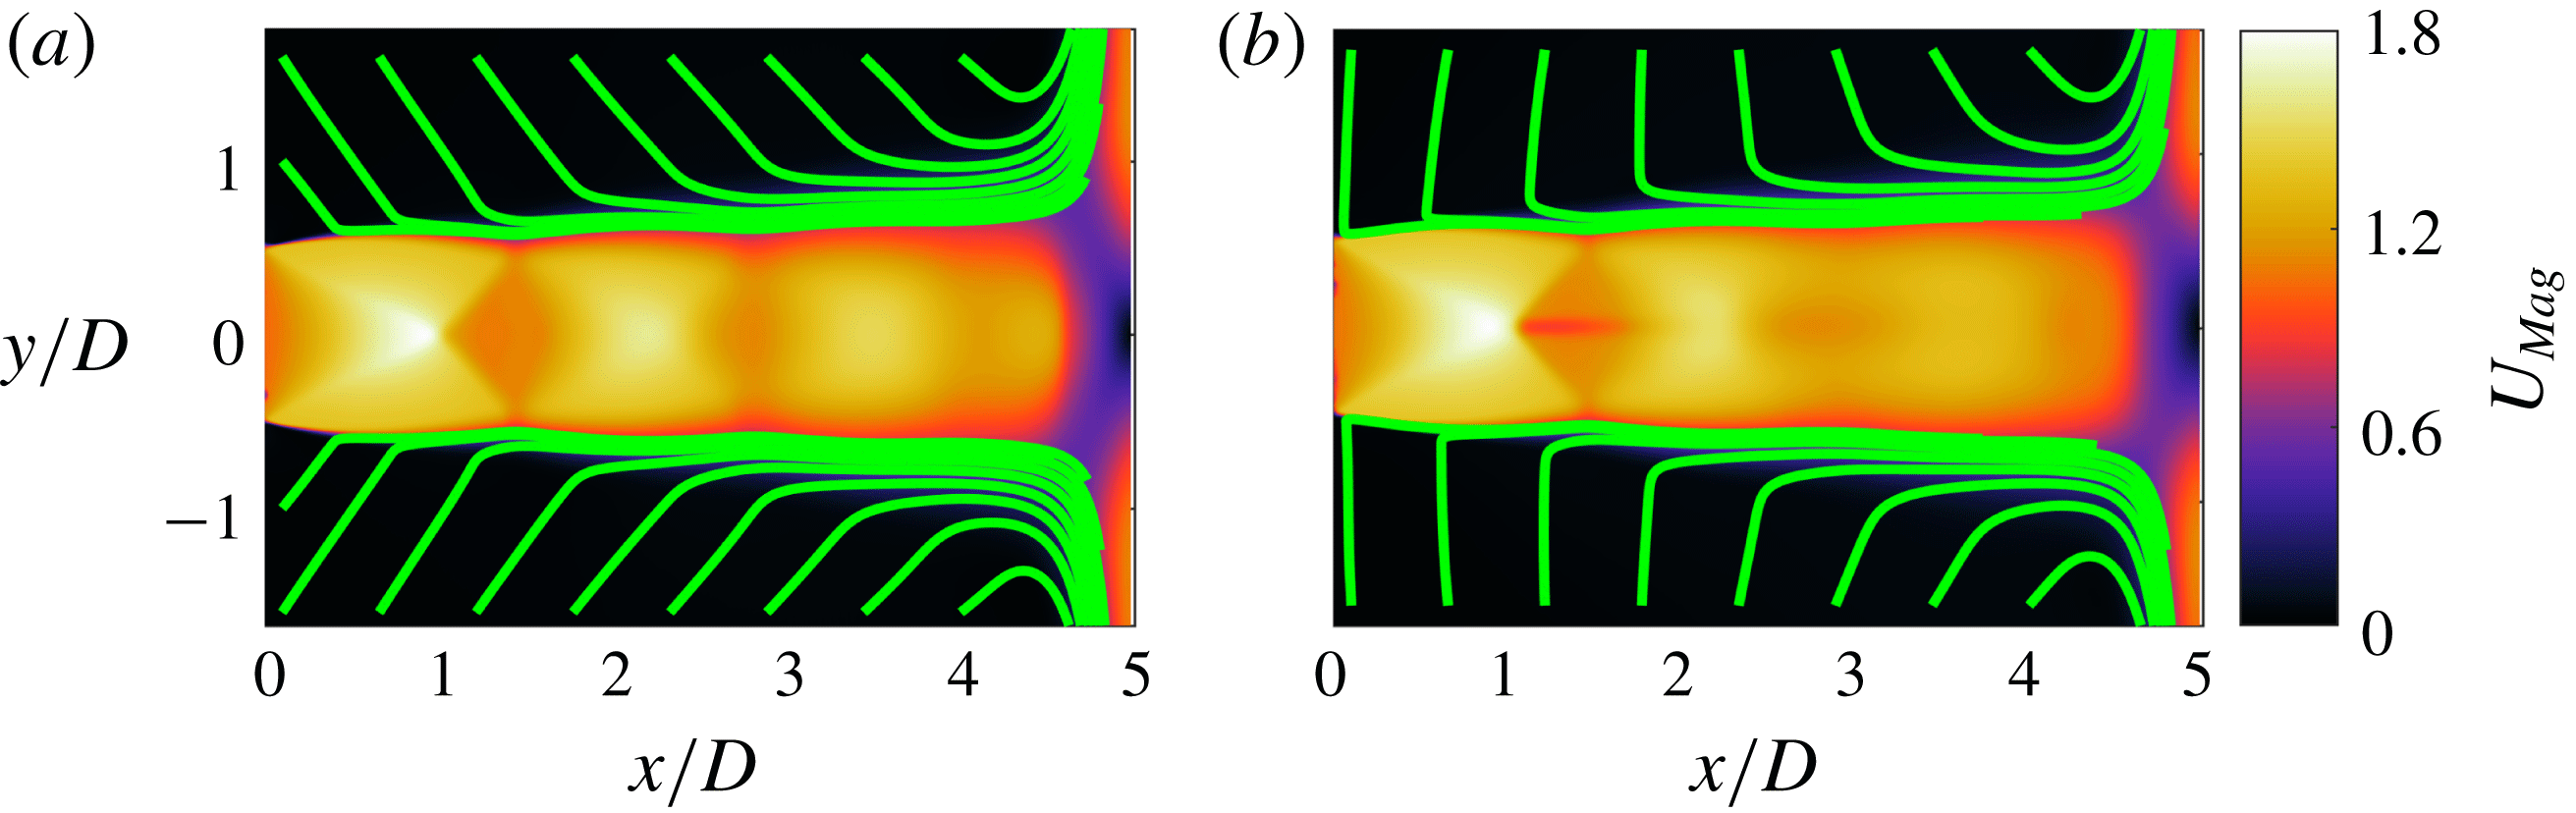
Two possible hypotheses for the mechanism responsible for the change in azimuthal instability mode between the two flows are proposed and investigated. First, the change in nozzle external geometry could have an effect on the feedback processes of the different instability modes. The initial expansion of the flow due to its underexpanded nature could be blocking the acoustic path of the higher frequency tone to the nozzle lip in the thin-lip case. When the nozzle lip is extended with the infinite-lip cap, its larger radial thickness may allow for increased acoustic reflection, thus enabling perturbation of the initial shear layer at the higher frequency. This would be the same mechanism as observed in highly expanded free jets (Raman Reference Raman1997). This first hypothesis also implies that the acoustic waves associated with the helical instability mode of the thin-lip jet must approach the nozzle lip from a different direction, as to not be blocked by the jet boundary. Second, the flow angle of the entrainment field may play a significant role in the growth rates of the different instability modes. As illustrated in figure 8, due to the change in nozzle external boundary conditions, the angle of the entraining fluid is different for the thin- and infinite-lip cases. The contour of velocity magnitude for each flow is used, where
 $U_{Mag}=\sqrt{U^{2}+V^{2}}/U_{E}$
. This difference in entraining flow may lead to a change in the growth rates of the instability modes.
Streamlines of the mean flow in the entrainment region for the (a) thin-lip and (b) infinite-lip cases. The streamlines are overlaid on the mean velocity magnitude,
 $U_{Mag}$
, for each jet flow.

To decouple these two effects, two new nozzle geometries were investigated using acoustic measurements, ultra-high-speed schlieren visualisations and PIV. The first is an intermediate-lip thickness nozzle; by increasing the nozzle lip thickness from
 $0.1D$
of the thin-lip jet to
 $0.33D$
, the available surface for acoustic reflection is considerably increased. However, as the outer surface of the nozzle is still conical (see figure 3
c), the entraining flow should be similar to the thin-lip jet. The second nozzle geometry is the same as the infinite nozzle cap, with the metal cap replaced with one made of acoustic dampening foam, as shown in figure 3(d). This infinite-foam cover was produced to mimic the entrainment conditions of the infinite-lip nozzle, without offering increased surface for acoustic reflection. This is similar to the work of Poldervaart, Vink & Wijnands (Reference Poldervaart, Vink and Wijnands1968) on using acoustic reflectors and dampeners to illustrate the feedback loop of free jets. It is worth highlighting that unlike previous work on screech suppression (Norum Reference Norum1983), the foam additions do not cover the top of the nozzle lip surface. This case will be referred to as the infinite-foam/thin-lip case. Additional foam covers were also produced to test certain aspects of the above explanations, and their results are discussed in the following sections. The flow conditions and PIV parameters are given in tables 2 and 4, respectively.
4.2 Characterising and comparing the new nozzle flows
4.2.1 Acoustic analysis
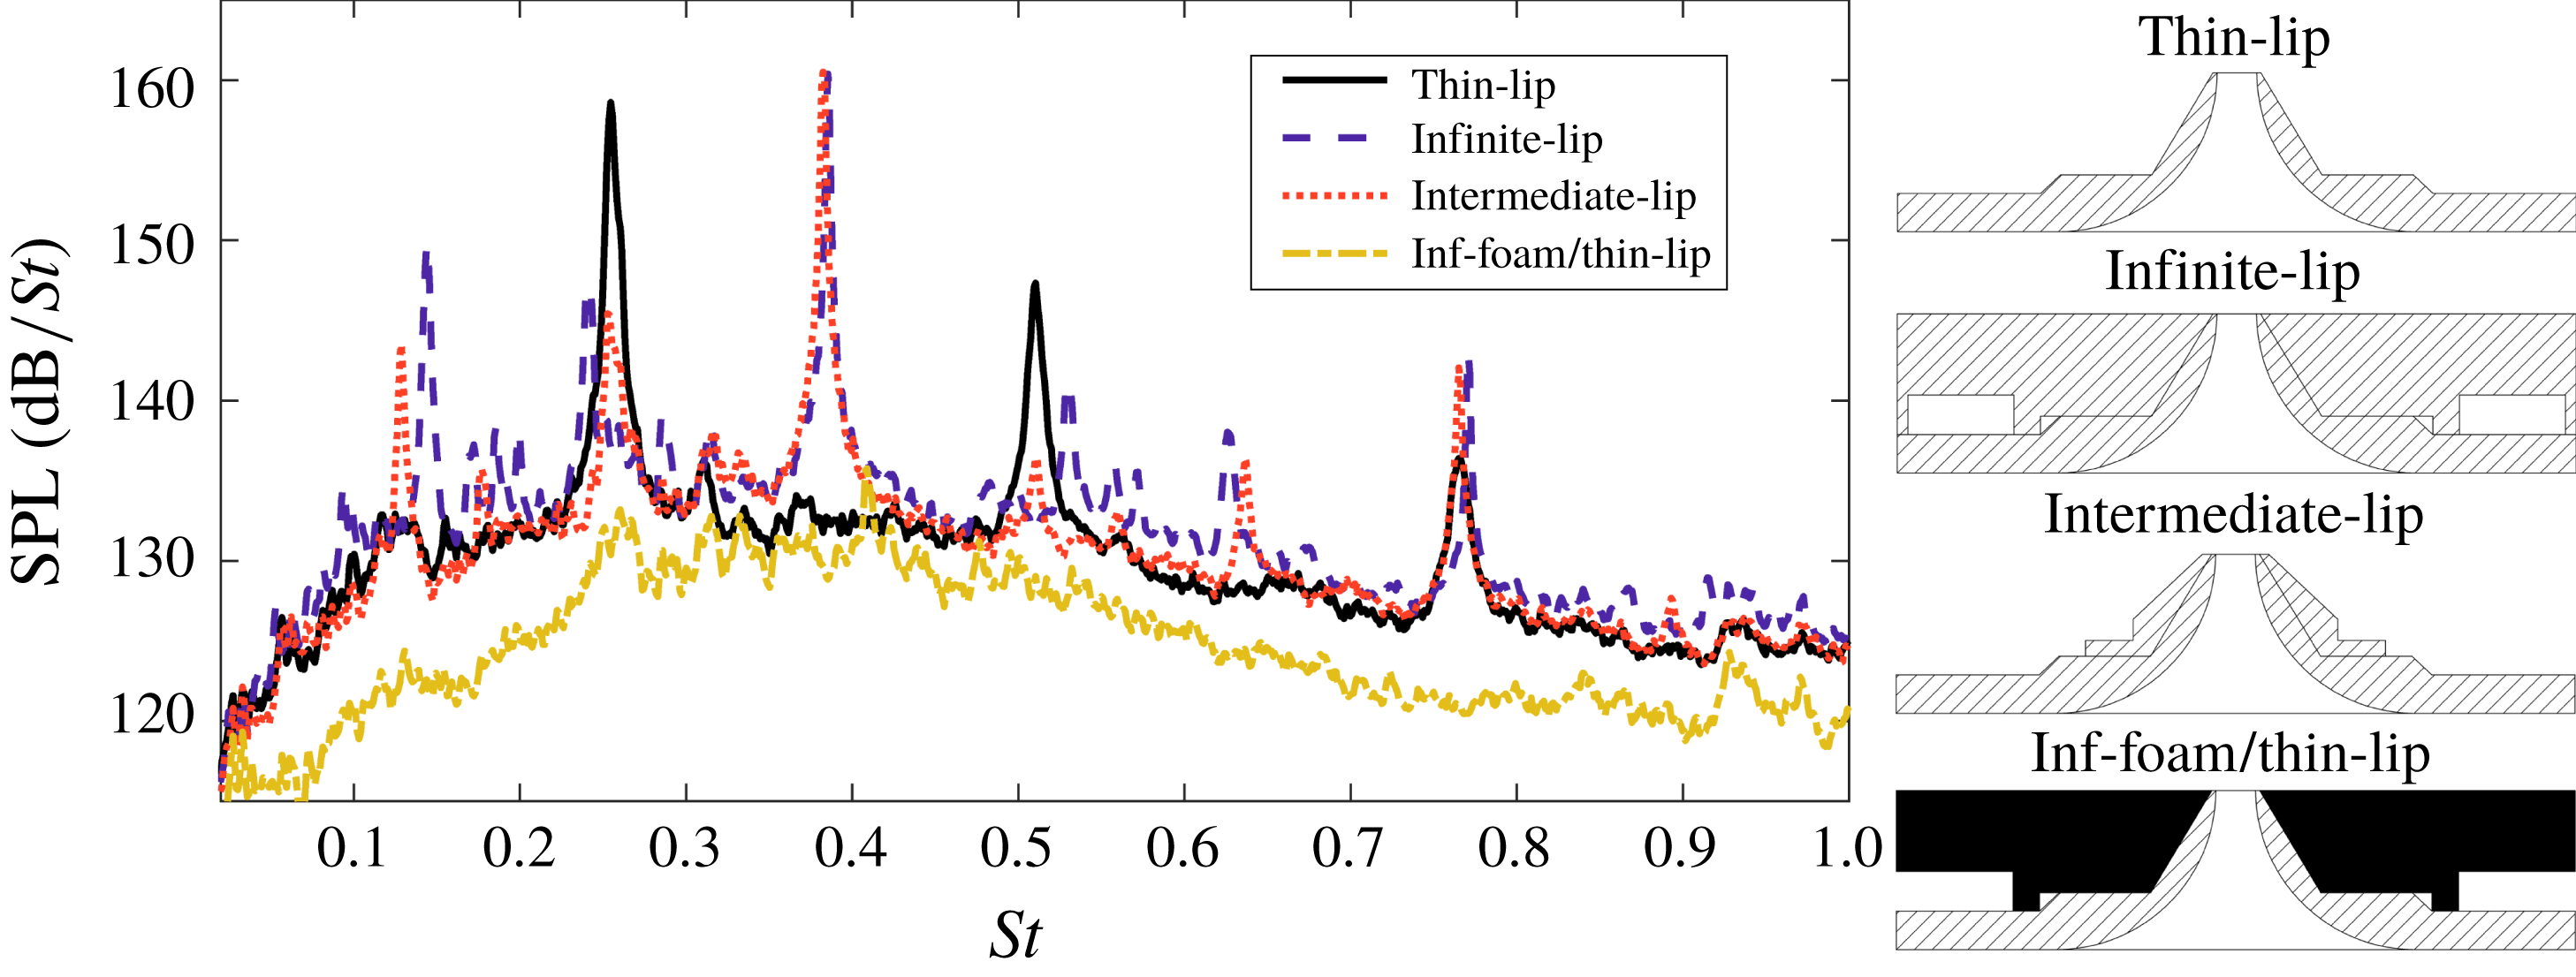
The acoustic spectra of the intermediate-lip and infinite-foam/thin-lip cases are plotted alongside the two original cases for comparison in figure 9. The intermediate-lip spectrum is very similar to the infinite-lip case, containing a peak tone at both
 $St=0.383$
and
 $0.253$
. This suggests that the increased radial surface of the intermediate-lip nozzle has allowed for the reception of the acoustic waves associated with the
 $m=0$
mode at the initial shear layer. The proximity of the lower frequency tone to that present in the thin-lip case also suggests that the helical mode feedback loop is also being completed. From the ultra-high-speed schlieren visualisations, not presented here, the intermediate-lip flow appears to contain a dominant axisymmetric instability mode similar to the infinite-lip case. This will be investigated using POD in the following section.
Comparison of the acoustic spectra of the intermediate-lip and infinite-foam/thin-lip nozzles to the thin- and infinite-lip nozzles.

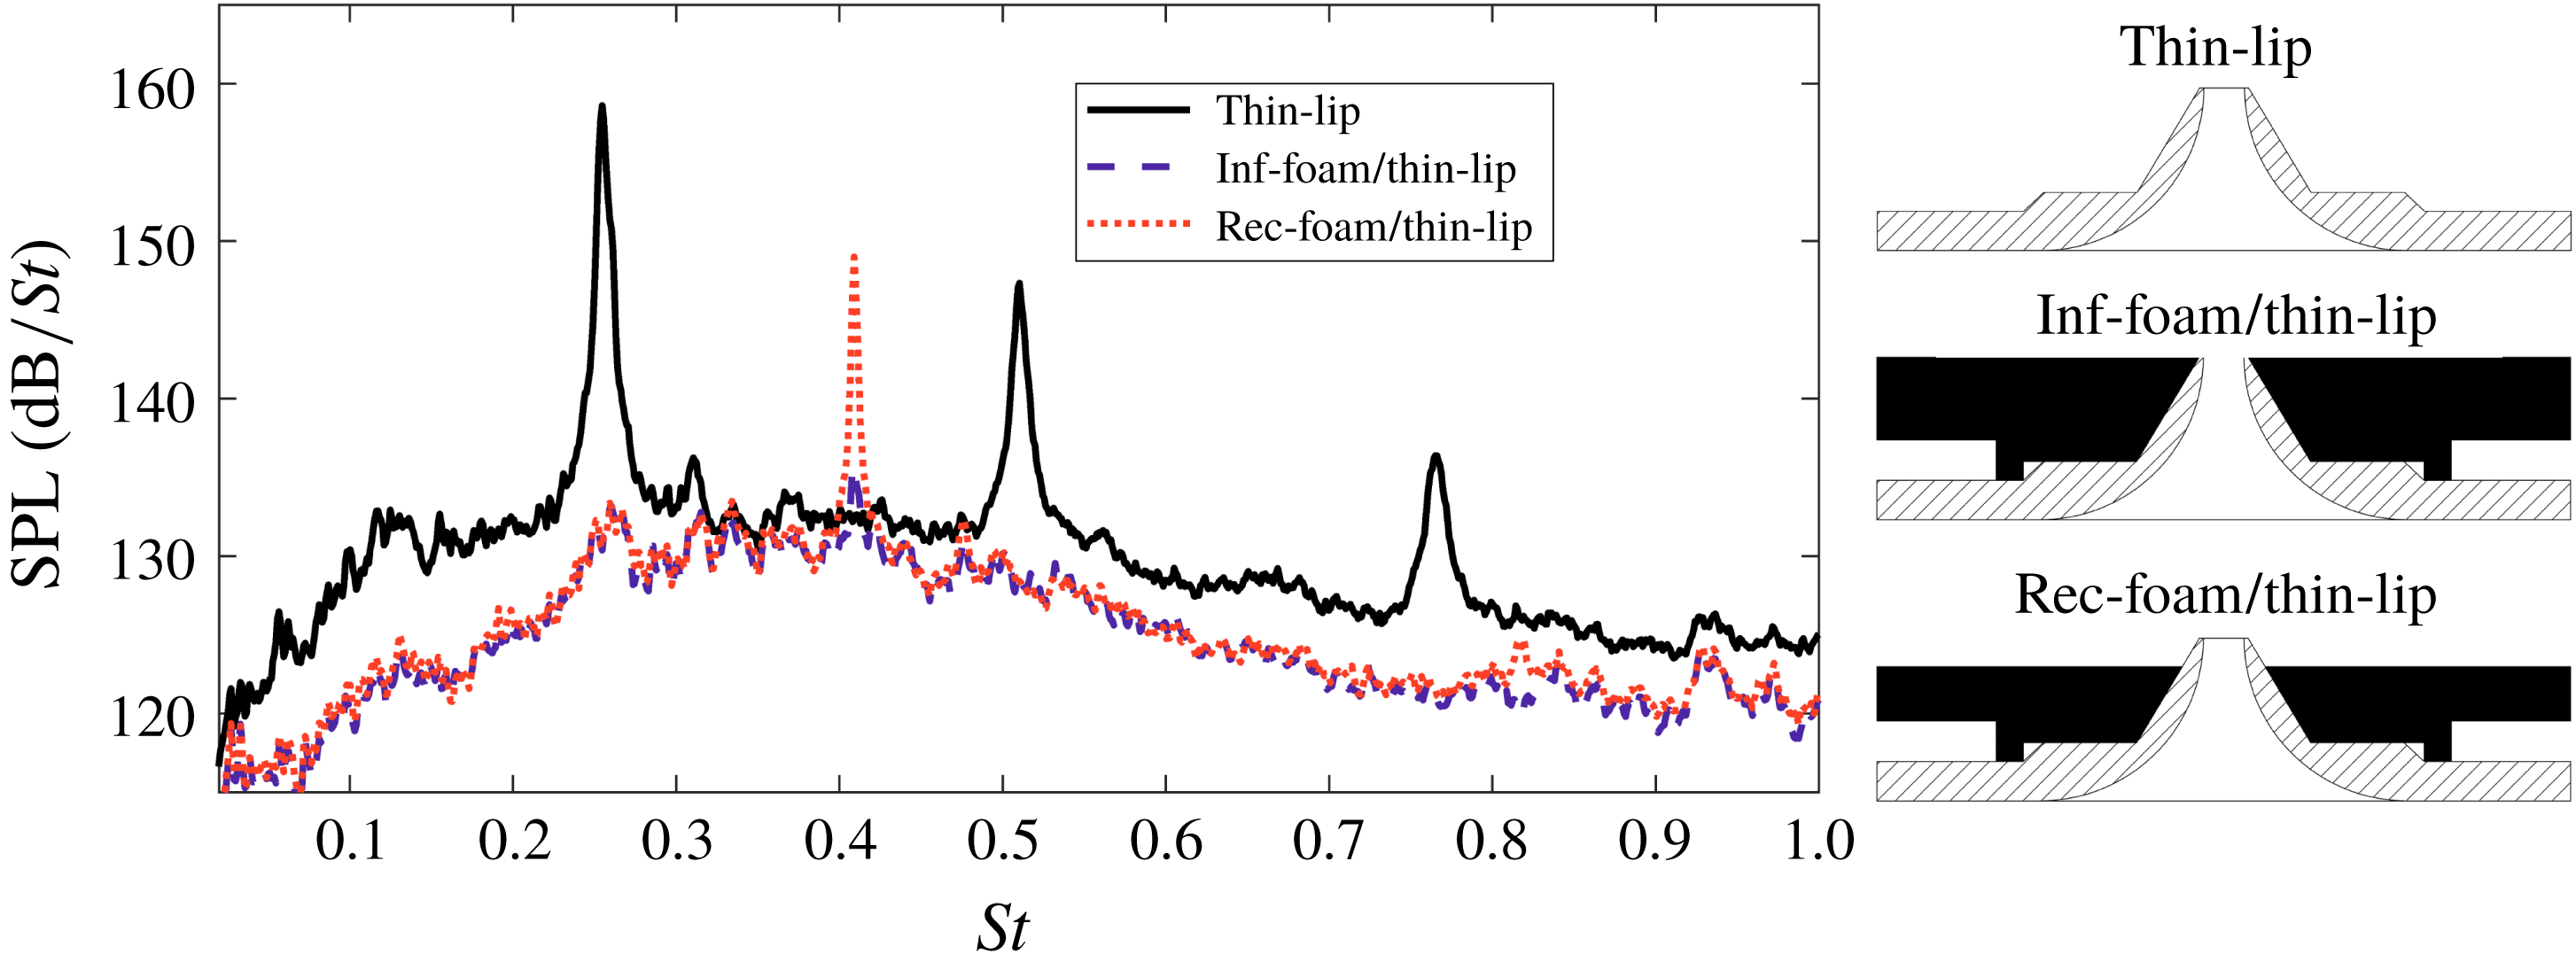
Comparison of the acoustic spectra of the thin-lip nozzle to the inclusion of the infinite- and recessed-foam covers.

The inclusion of the infinite-foam on the thin-lip nozzle results in an unexpected acoustic spectrum. The foam cover results in a significant reduction of the peak tone located at
 $St=0.255$
, while also reducing the overall SPL by
 ${\approx}3{-}7~\text{dB}$
. To ensure that the foam was not obstructing the nozzle lip surface an additional foam piece, named the recessed-foam/thin-lip cover, was manufactured with the top 10 mm removed. This exposed the top portion of the nozzle, as illustrated in figure 3(e). Acoustic measurements using the recessed-foam/thin-lip cover are presented in figure 10. Again, the peak tone of the thin-lip case is significantly reduced. A higher frequency tone at
 $St=0.409$
does occur, which, whilst lower in SPL, has a similar frequency to the toroidal mode of the infinite-lip jet. Due to differences in the peak tone frequency between the two jet facilities, ultra-high-speed schlieren visualisations of this flow were unable to confirm the type of an azimuthal mode in the flow, however, based on the similarities in the peak tone frequencies, a toroidal instability mode is likely.
The significant reduction of the impingement tone associated with the helical instability in the thin-lip jet when the foam is added is particularly significant. The broadband to peak SPL was reduced from 25 to 4 dB. This is equivalent to more than an order of magnitude reduction in the pressure fluctuations. If the acoustic feedback path for the helical instability is directly from the impingement region, later shown to be the stand-off shock, to the nozzle surface, the addition of the extended foam lip should make minimal difference. That the tone was greatly diminished when the foam was added suggests that the feedback is not as simple as an acoustic wave travelling directly back to the nozzle lip. Instead, it is proposed that the feedback loop of the thin-lip helical mode is exclusively closed by the acoustic wave propagating upstream of the nozzle lip, undergoing a reflection off the nozzle base, propagating back to the nozzle lip and perturbing the initial shear layer. This differs from early screech studies using upstream baffles (Norum Reference Norum1983), where a tone occurred without an upstream surface, but numerous mode shifts occurred depending on the position of the introduced baffle. The authors are unaware of any previous results in either free or impinging jet research that has observed the closure of the feedback path exclusively by reflections off an upstream surface. If this feedback path is occurring, the acoustic path of the thin-lip jet approaches the nozzle lip from a different angle than the acoustic waves present in the infinite-lip case, and thus they avoid being blocked by the initial expansion of the jet. This supports the first hypothesis presented in § 4.1. However, the proposed path of the acoustic feedback loop does not rule out the effect of the entrainment region, which will be investigated in § 4.2.4.
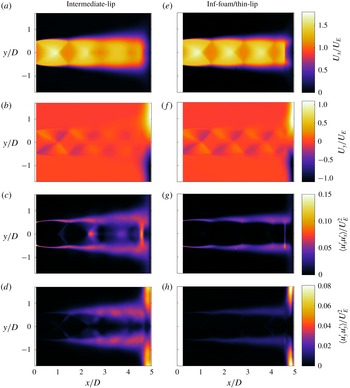
(a) Mean axial velocity, (b) mean transverse velocity, (c) variance of axial fluctuations, (d) variance of transverse fluctuations for the intermediate-lip jet. (e–h) The same statistics for the infinite-foam/thin-lip case.

4.2.2 Flow statistics
First- and second-order statistics are presented in figure 11 for the intermediate- and infinite-foam/thin-lip jets. A larger region of the measured flow is masked in the infinite-foam case than the other three measured flows. This is due to bright reflections from foam material, requiring the laser sheet to be blocked from this region. The mean velocities achieve similar values in both flows and are similar to those measured in the thin- and infinite-lip cases shown in figure 4. No low-speed region is observed downstream of the first shock cell in either flow, indicating that of the cases studied here, the phenomenon is unique to the infinite-lip jet. The axial and transverse variance of the intermediate-lip jet matches the structure found in the infinite-lip jet quite well, although with lower variance values. This is in agreement with the acoustic measurements that the intermediate-lip case is likely dominated by the same azimuthal instability mode as the infinite-lip jet. The variance of the infinite-foam case highlights its reduced shear layer growth and overall fluctuations compared to the other cases. As no impingement tone is present for this case, it is likely that no feedback driven azimuthal mode exists. The presence of any azimuthal instability modes in both flows will again be investigated using POD.
4.2.3 Identification of the dominant azimuthal modes
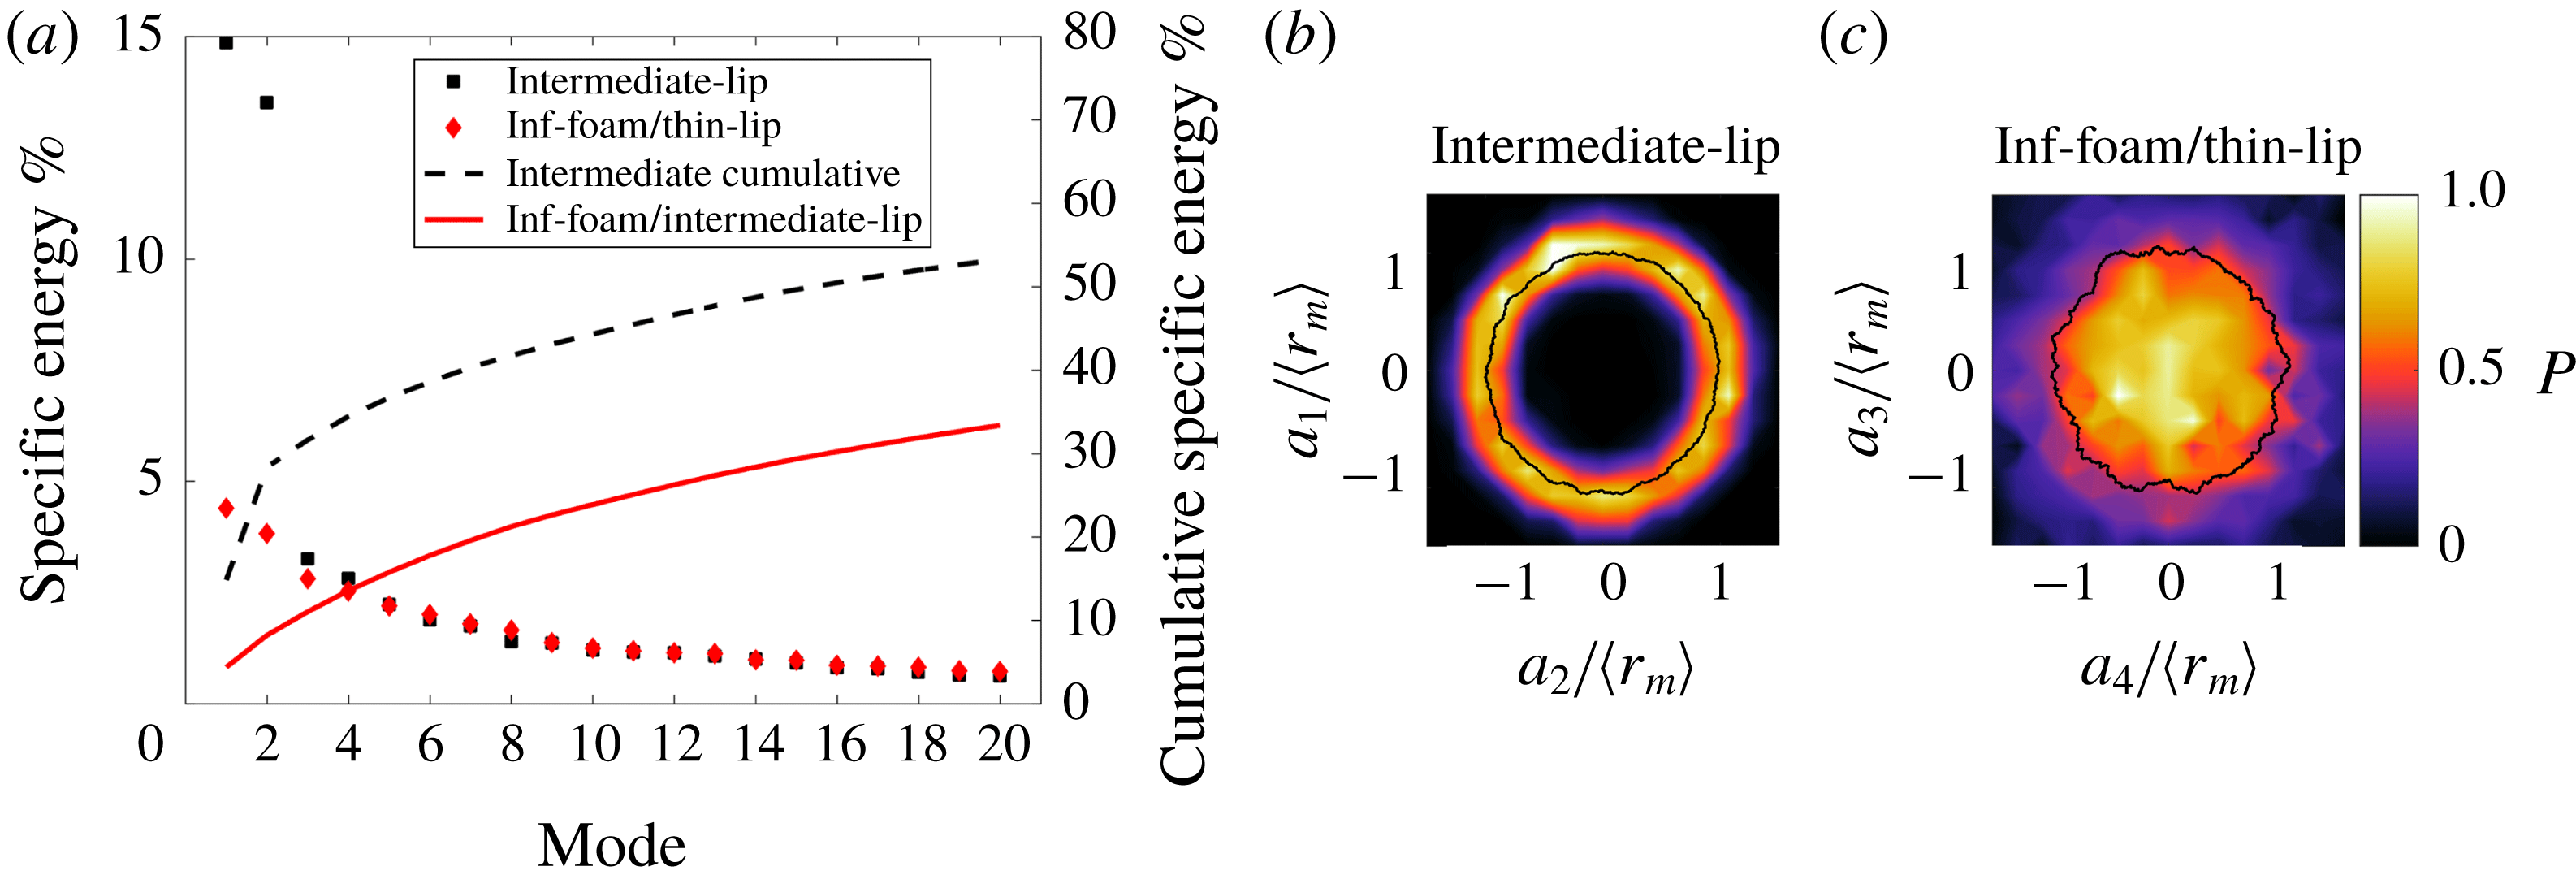
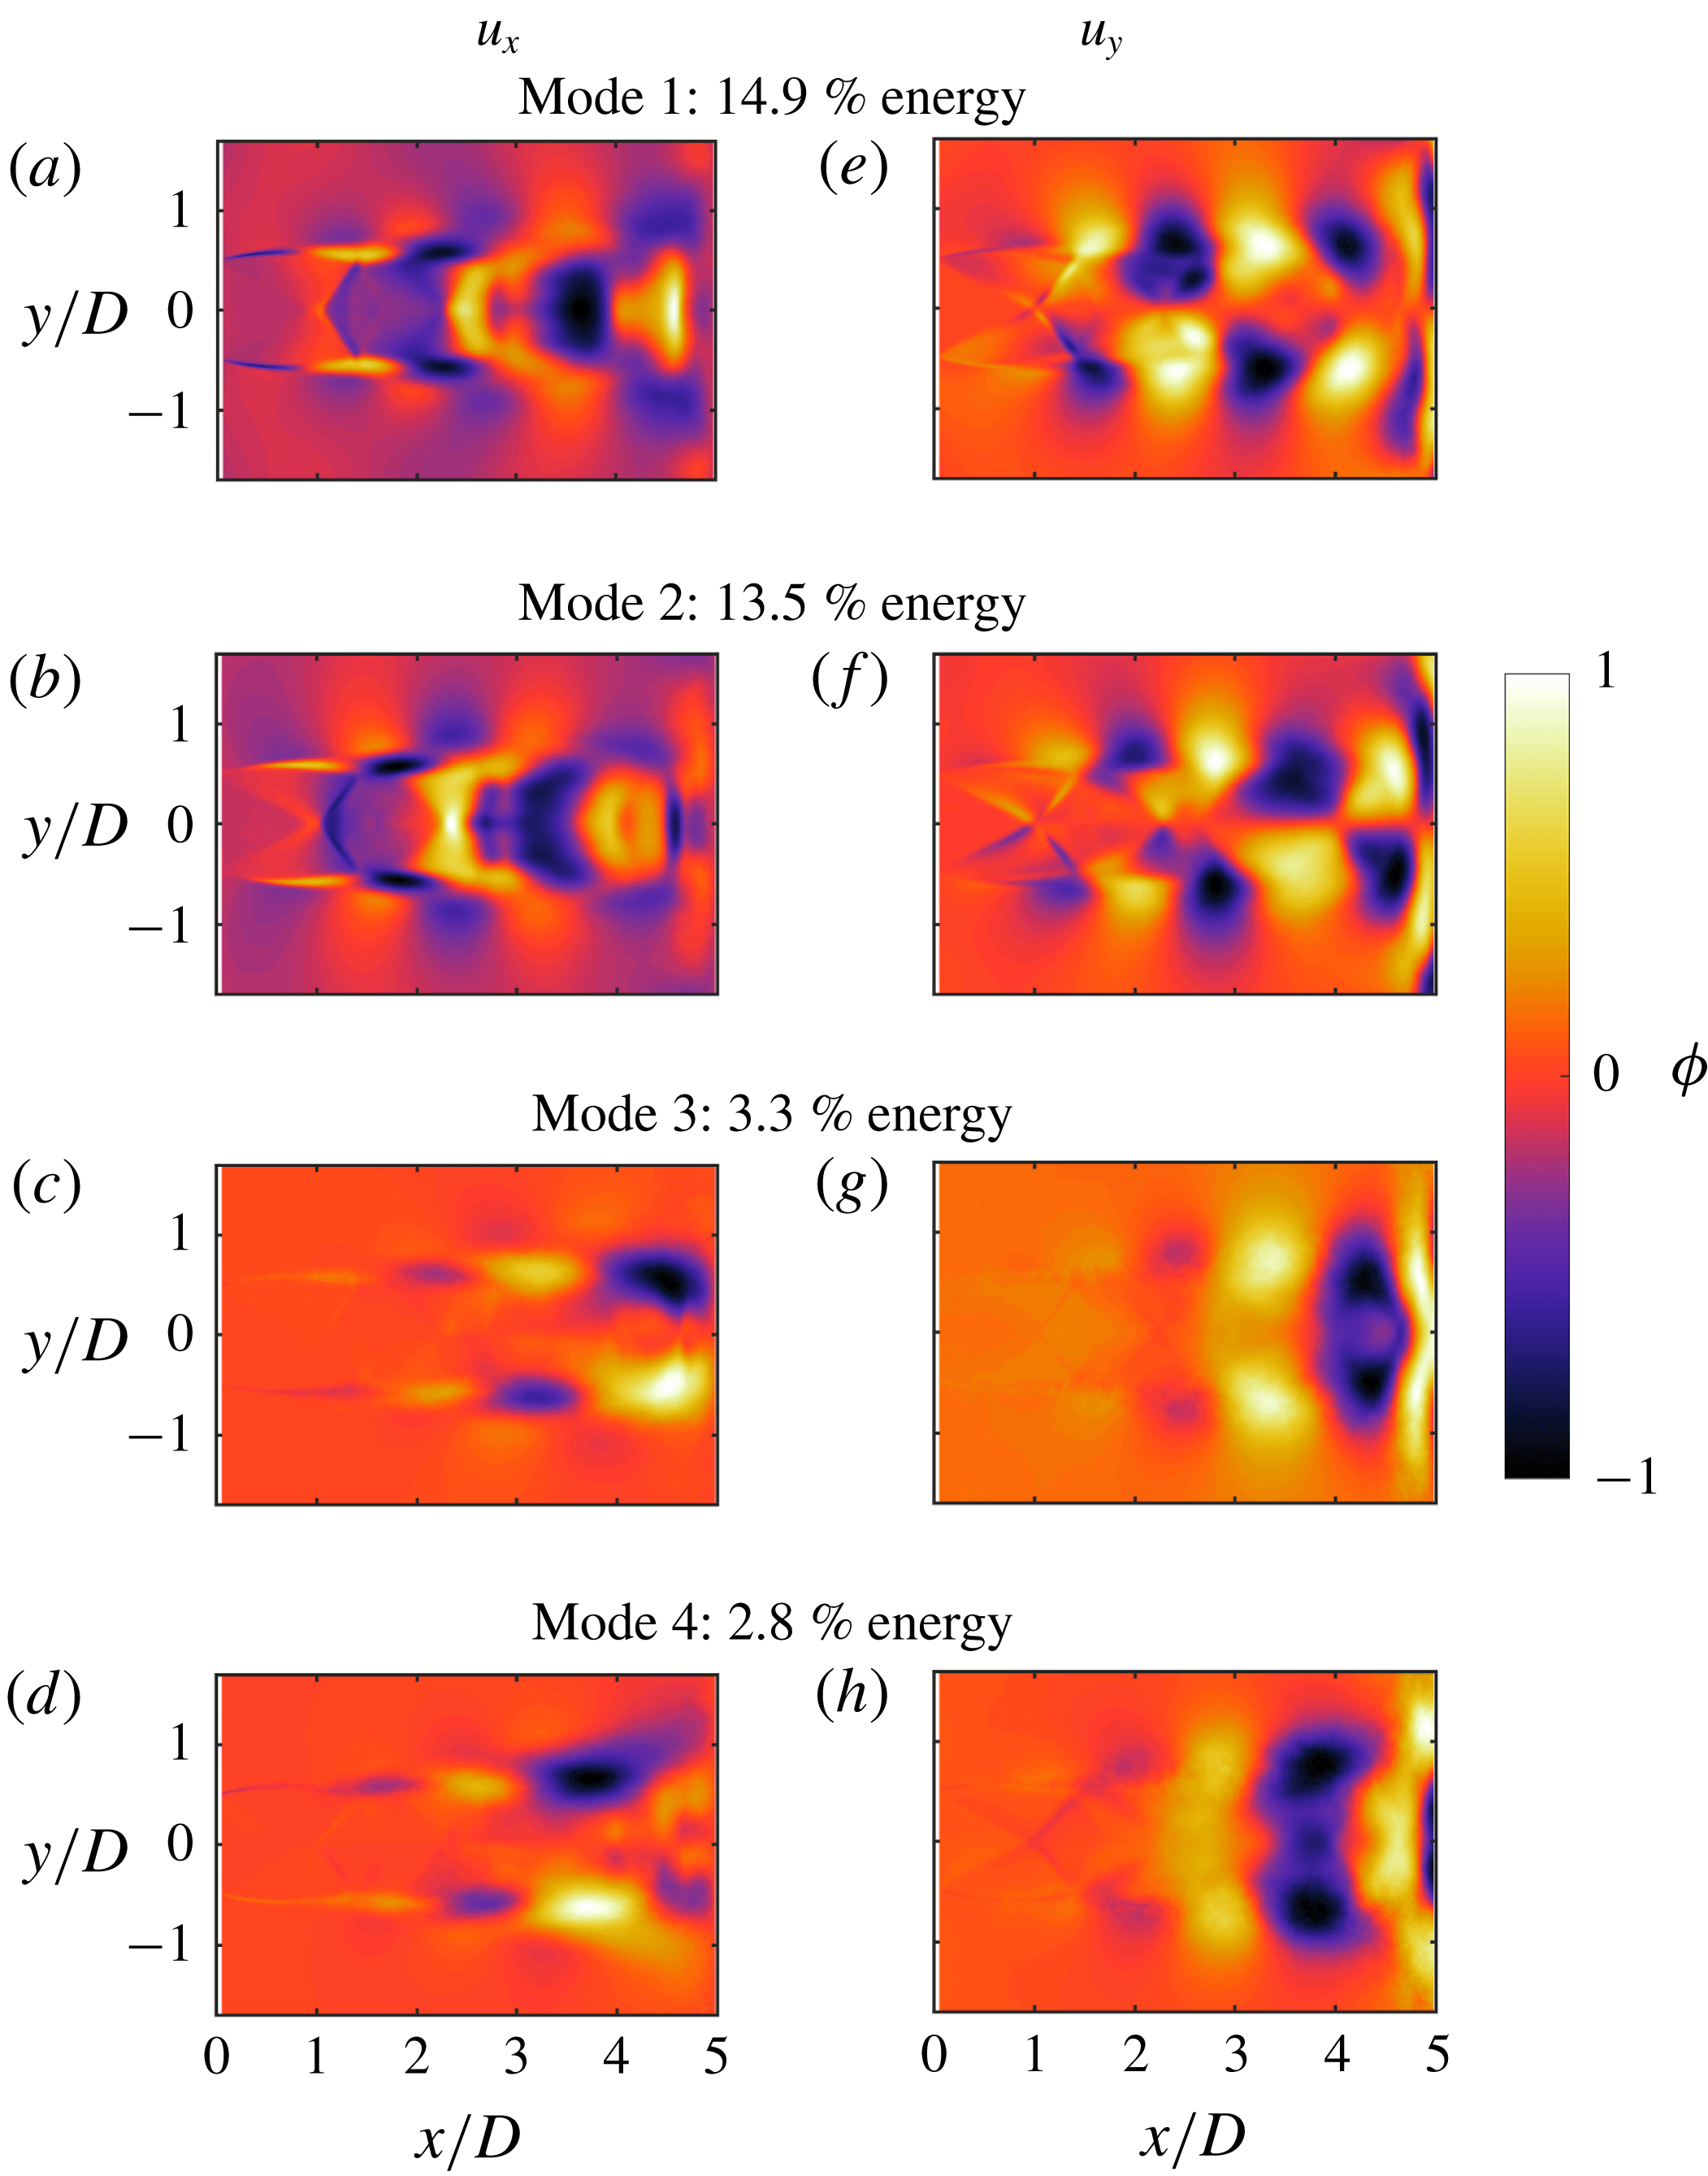
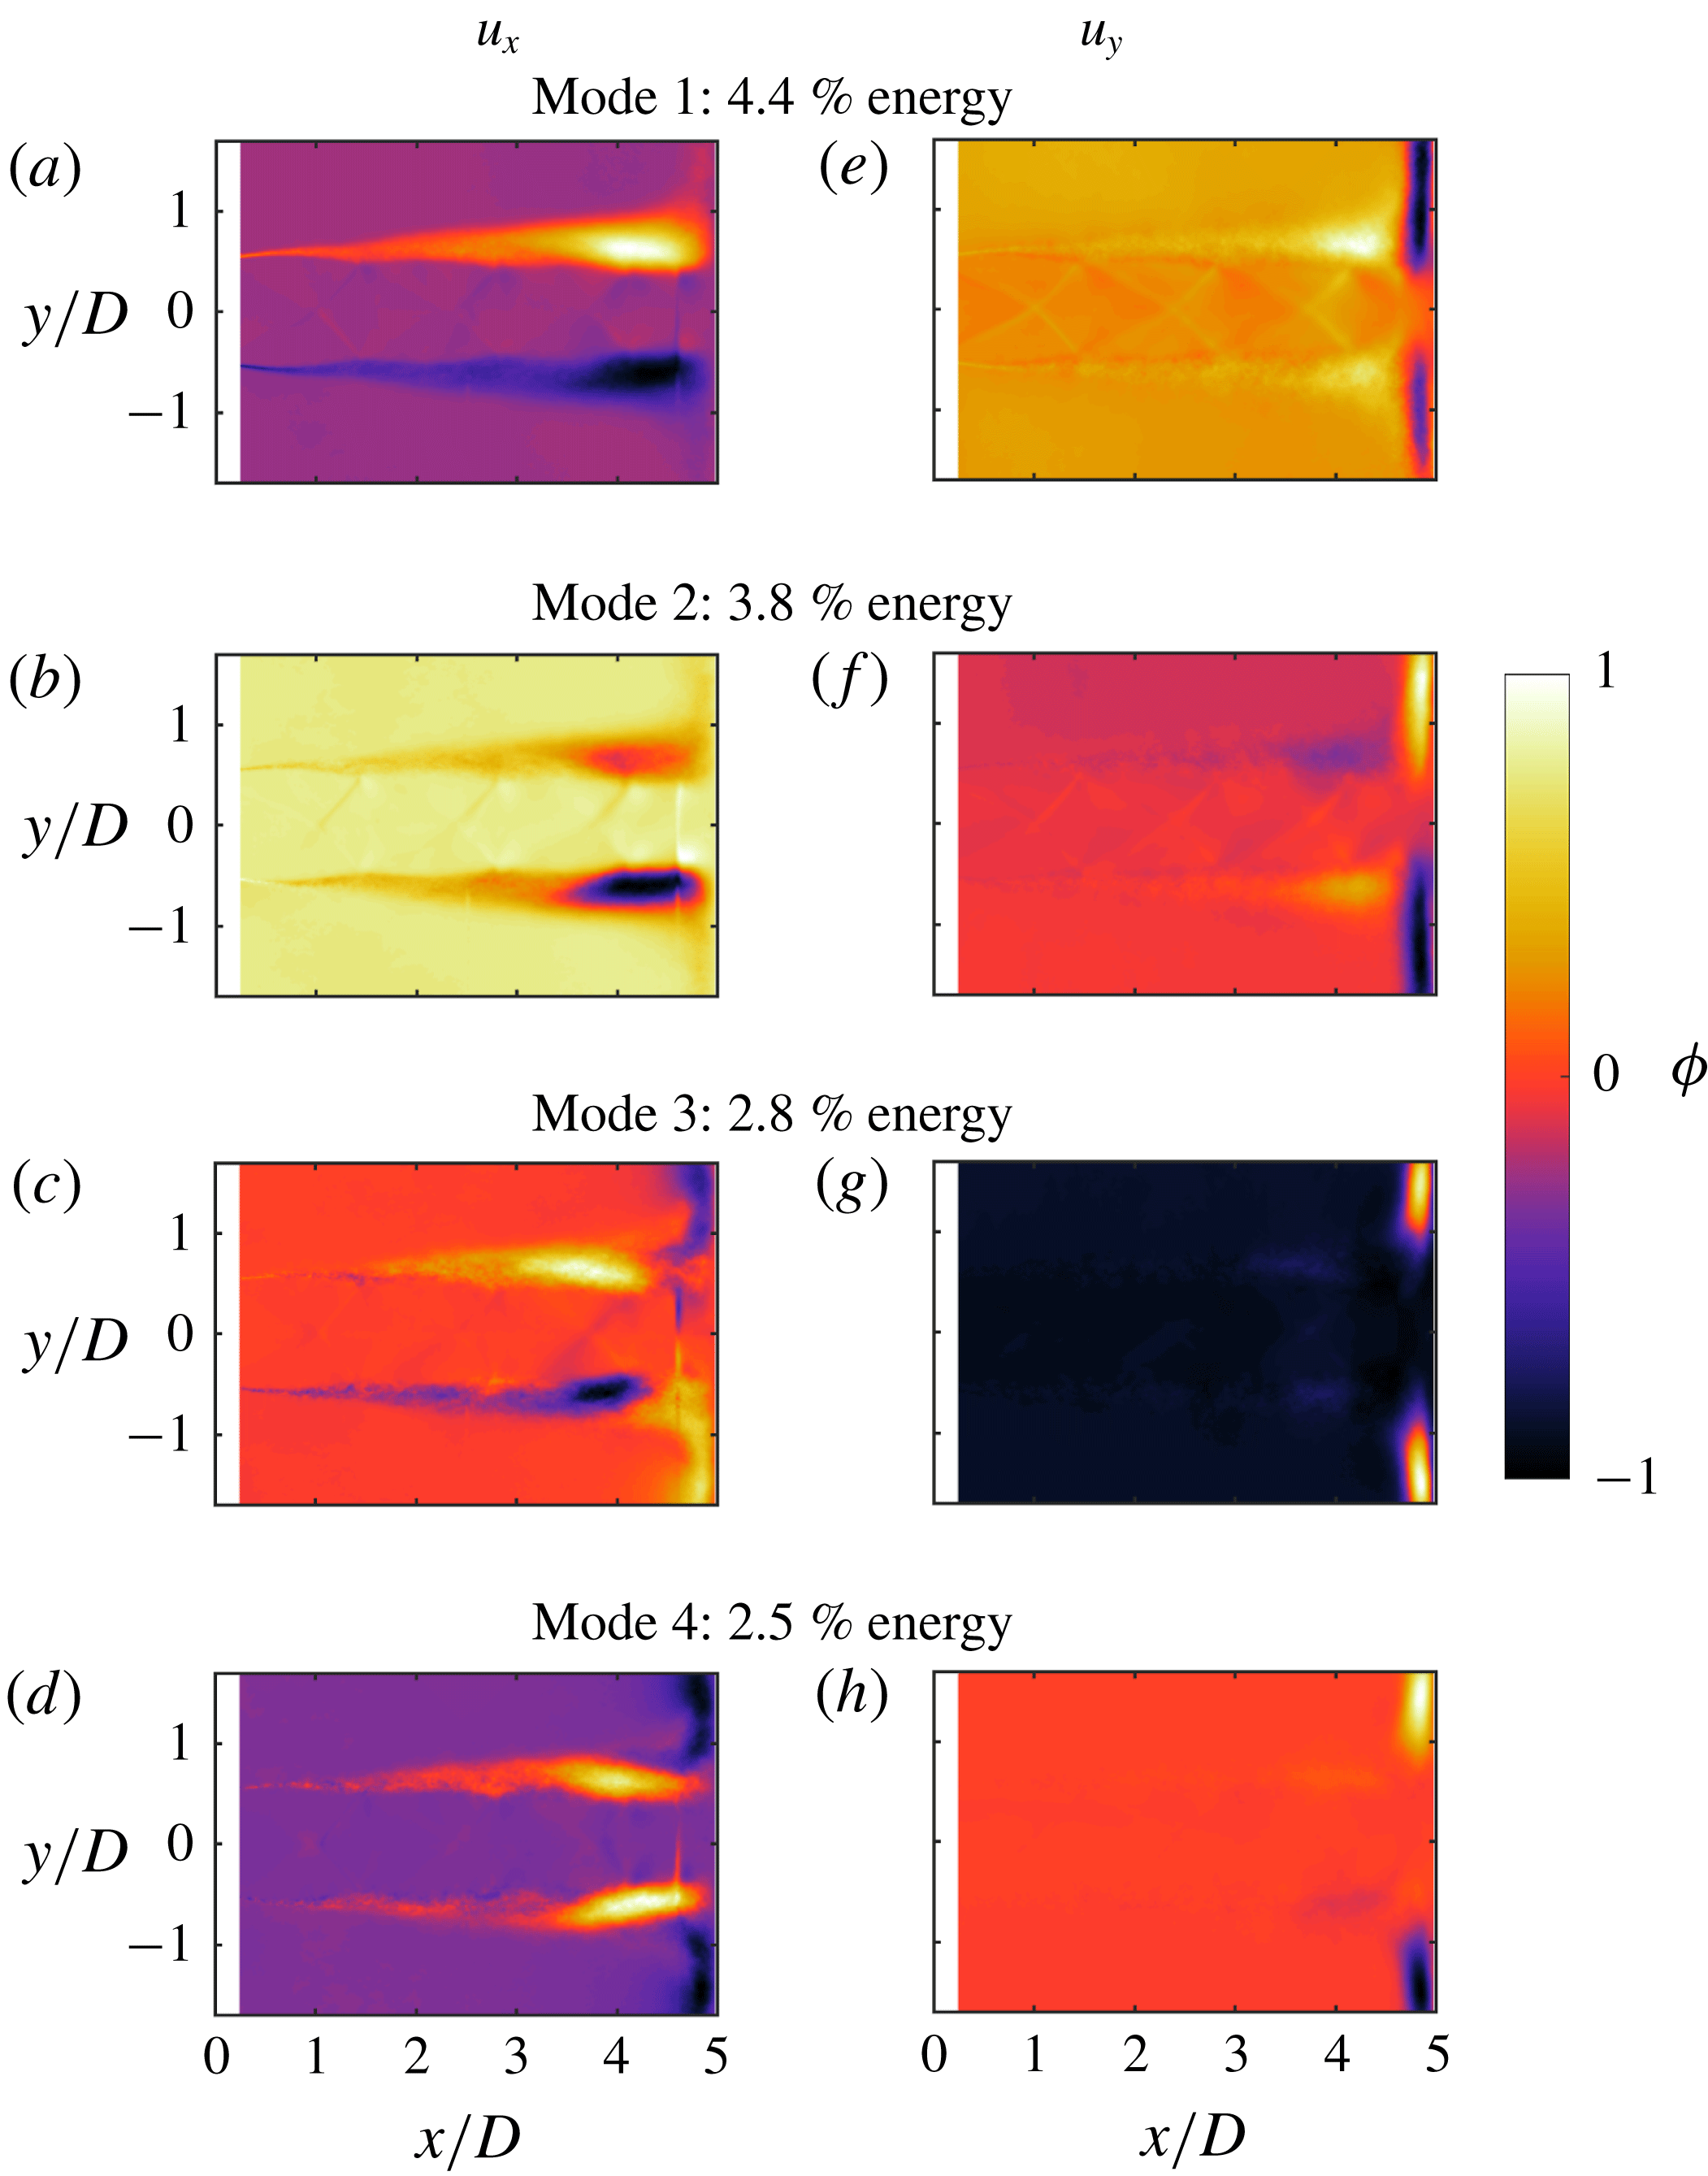
The POD spectra for the intermediate-lip and infinite-foam/thin-lip cases are shown in figure 12, with the first four POD modes illustrated in figure 13 and figure 14 for the intermediate-lip and infinite-foam/thin-lip cases, respectively. The Lissajous plots on the phase portraits (figure 12
b,c) clearly show that the first two modes are a modal pair. The second pair is more difficult to determine, however as in the infinite-lip case, the spatial structure of these modes indicates that they are a modal pair. Thus, for the intermediate-lip the flow is dominated by an axisymmetric instability mode, with a secondary, lower energy helical mode described by modes 3 and 4. These are the same modes as in the infinite-lip case, although the cumulative energy of the secondary helical mode is lower for the intermediate-lip flow. This may correlate with the reduced SPL of the acoustic tone at
 $St=0.253$
. The presence of these modes illustrates that the change in nozzle external geometry due to the increased lip thickness results in the formation of a toroidal azimuthal mode. This further supports the hypothesis that the initial expansion of the jet blocks the arrival of acoustic waves at the nozzle lip for the thin-lip case and that by extending the lip thickness, a feedback path for the toroidal mode is able to be closed.
(a) Specific kinetic energy of the 20 most energetic orthogonal modes and (b,c) phase portraits of the POD mode coefficients for the intermediate- and infinite-foam/thin-lip cases. The solid line on the phase portraits is the mean radial distance representing a Lissajous curve.

(a–h) The four dominant POD modes of the intermediate-lip nozzle case.

The POD energy spectrum illustrates no dominant, high energy modes in the infinite-foam/thin-lip case. The first four POD modes do not appear to describe the presence of any large-scale coherent structures within the flow. Several lower energy modes, not shown here, possibly describe vortical structures, however, these structures occur within multiple modes and are not split into clear modal pairs. In the leading energy modes, regions of high fluctuations of a large axial extent are present, most likely describing variations in the shear layer. With no coherent structures extracted by the POD, and no discrete tone observed in the acoustic measurements, it is concluded that the self-reinforcing aeroacoustic feedback process within the flow has been significantly weakened.
(a–h) The four highest energy POD modes of the infinite-foam/thin-lip case.

4.2.4 The role of the entrainment field
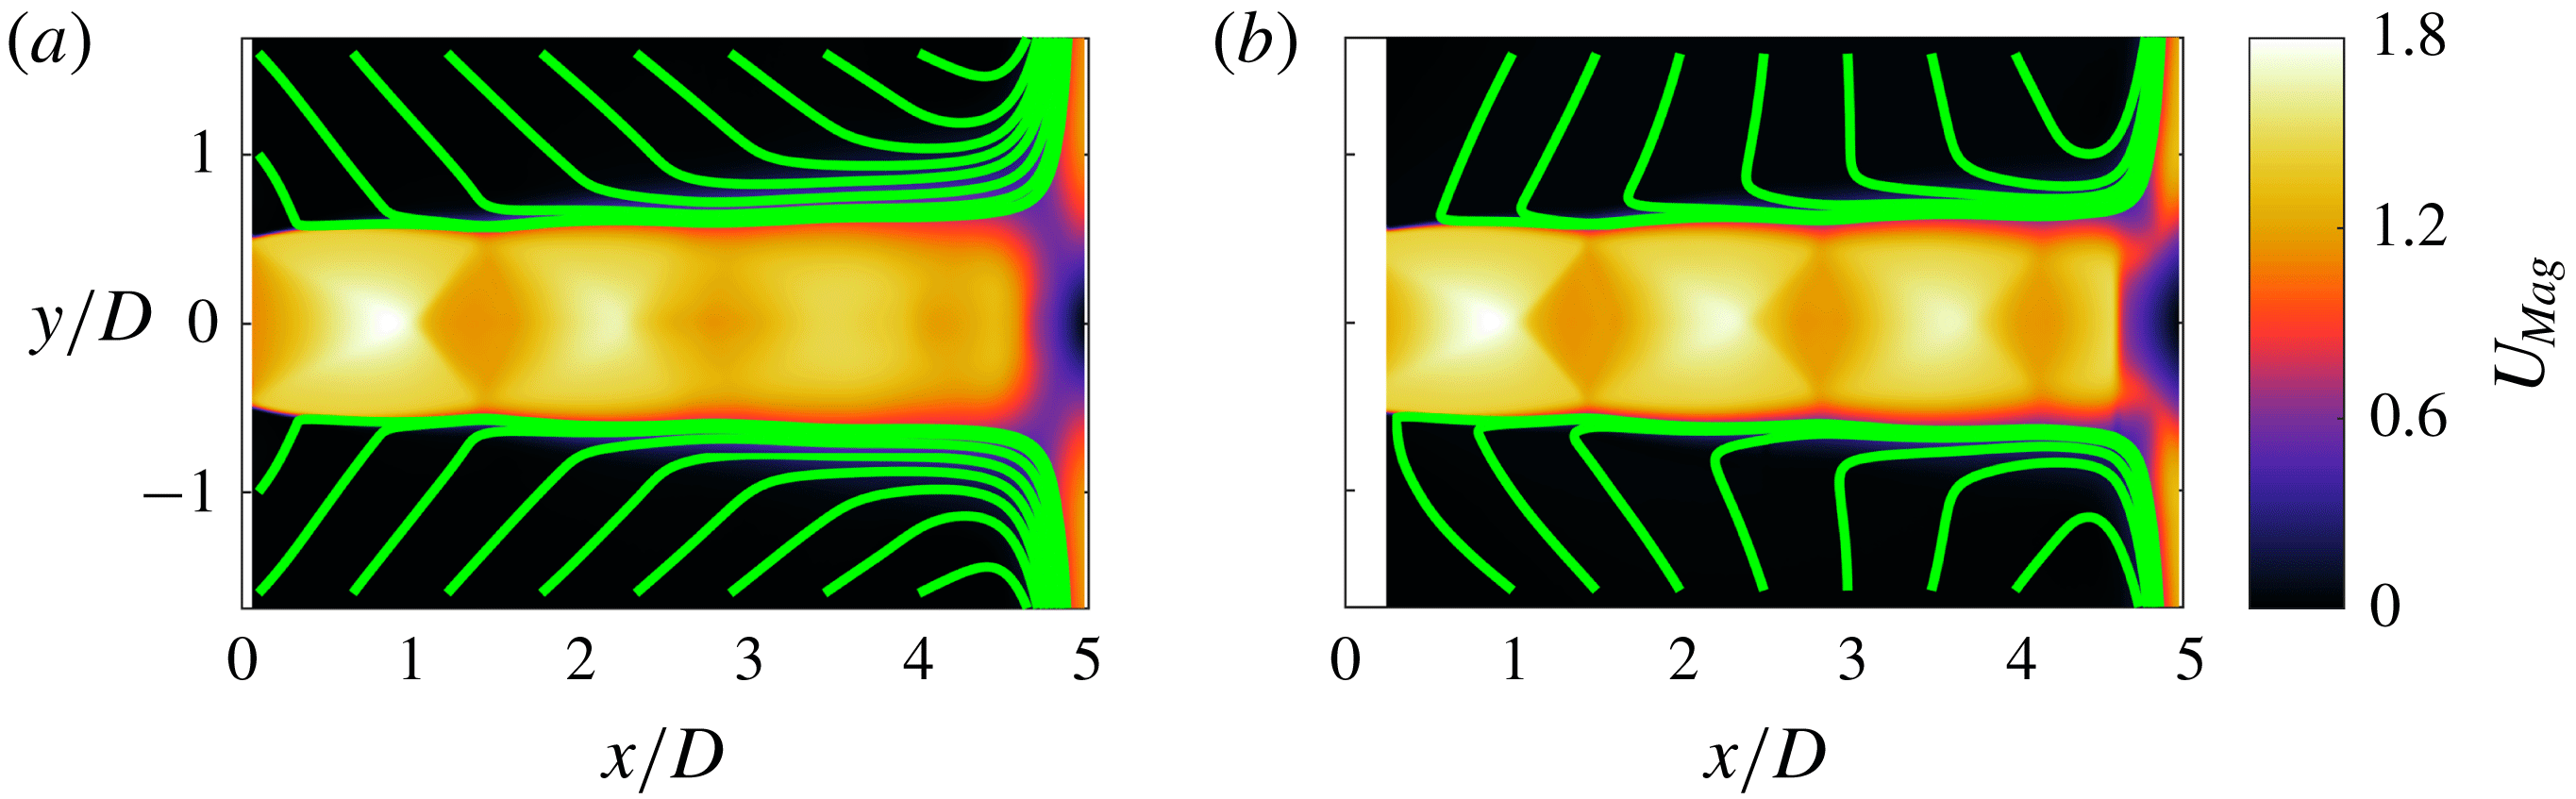
To determine if the change in dominant azimuthal mode is correlated to variations in the entrainment field, the mean flow of the intermediate-lip and infinite-foam/thin-lip cases is investigated. Figure 15 presents streamlines of the mean flow field for both of the new cases. The intermediate-lip case has an entraining flow angle very similar to the thin-lip jet and differs greatly from that of the infinite-lip jet. As the POD has shown that the intermediate-lip and infinite-lip cases have the same dominant instability modes, the difference in the entraining flow illustrates that the entrainment angle has no measureable effect on the growth of the instability modes. It is possible, however, that the region in which the entrainment angle has influence on the instability growth is much closer to the nozzle exit than able to be investigated here. For the foam case, the removal of a dominant azimuthal instability makes the correlation between the entrainment and the instability mode selection impossible to determine. Thus, from the acoustic and PIV/POD analysis of the two new cases, the azimuthal mode selection is concluded to be independent of the measurable entrainment characteristics.
Streamlines of the mean flow in the entrainment region for the (a) intermediate-lip and (b) infinite-foam/thin-lip case. The streamlines are overlaid on the mean velocity magnitude,
 $U_{Mag}$
, for each jet flow.

5 Identification of the mechanism of the azimuthal mode switch
5.1 Possible feedback paths of the intermediate-lip jet
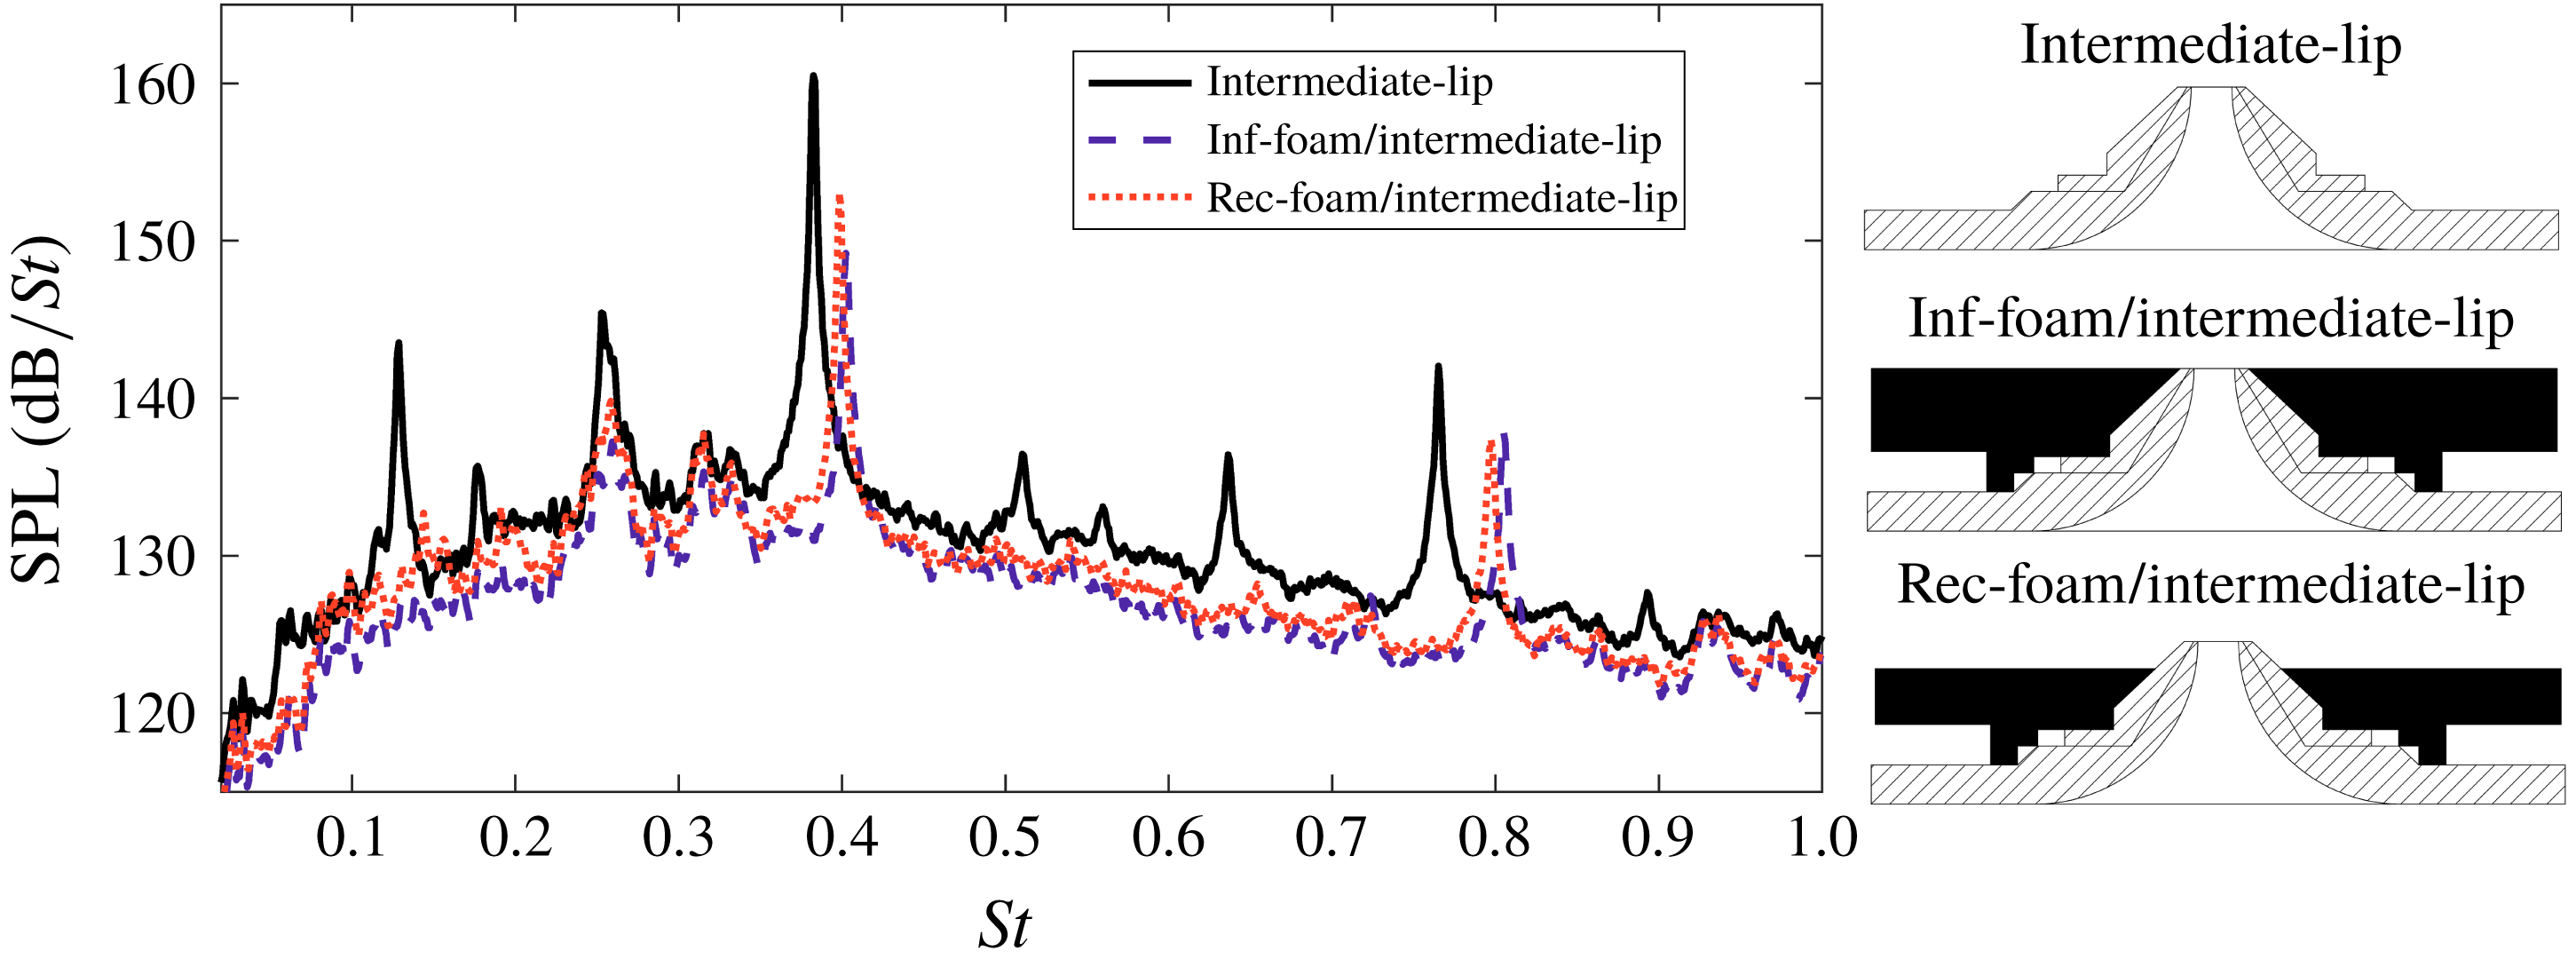
In an attempt to determine if the intermediate-lip helical mode involves a path that would be blocked by the addition of the acoustic foam cover, similar foam covers as for the thin-lip case were produced for the intermediate-lip nozzle, as presented in figure 3. The resultant acoustic spectra are compared in figure 16. The higher frequency tone associated with the toroidal mode does remain, though a decrease in SPL and a shift in frequency to
 $St=0.398$
has occurred. From ultra-high-speed schlieren visualisations of this case, which are not shown here, the jet appears to remain in a toroidal instability mode when the foam is added, with the shock cell spacing increasing by approximately
 $0.05D$
. This change in shock cell spacing would suggest the presence of a reduction in the shear layer thickness, which could result in a change in the most unstable frequency (Morris Reference Morris2010). Further experiments are required to properly investigate this change in impingement tone, which are beyond the scope of the present investigation. The tone associated with the helical mode of the intermediate-lip jet remains when either foam is added, although a slight reduction of broadband to peak SPL of 1–2 dB occurs. The continued occurrence of the
 $St=0.255$
tone is evidence that the feedback loop is not exclusively closed by an acoustic path that contains a reflection from the nozzle base. Thus, it is suggested that the intermediate-lip jet exhibits a different aeroacoustic feedback path to the thin-lip jet for the helical instability mode.
Comparison of the acoustic spectra of the intermediate-lip nozzle to the inclusion of the infinite and recessed-foam/intermediate-lip covers.

5.2 The feedback path of the thin-lip helical mode
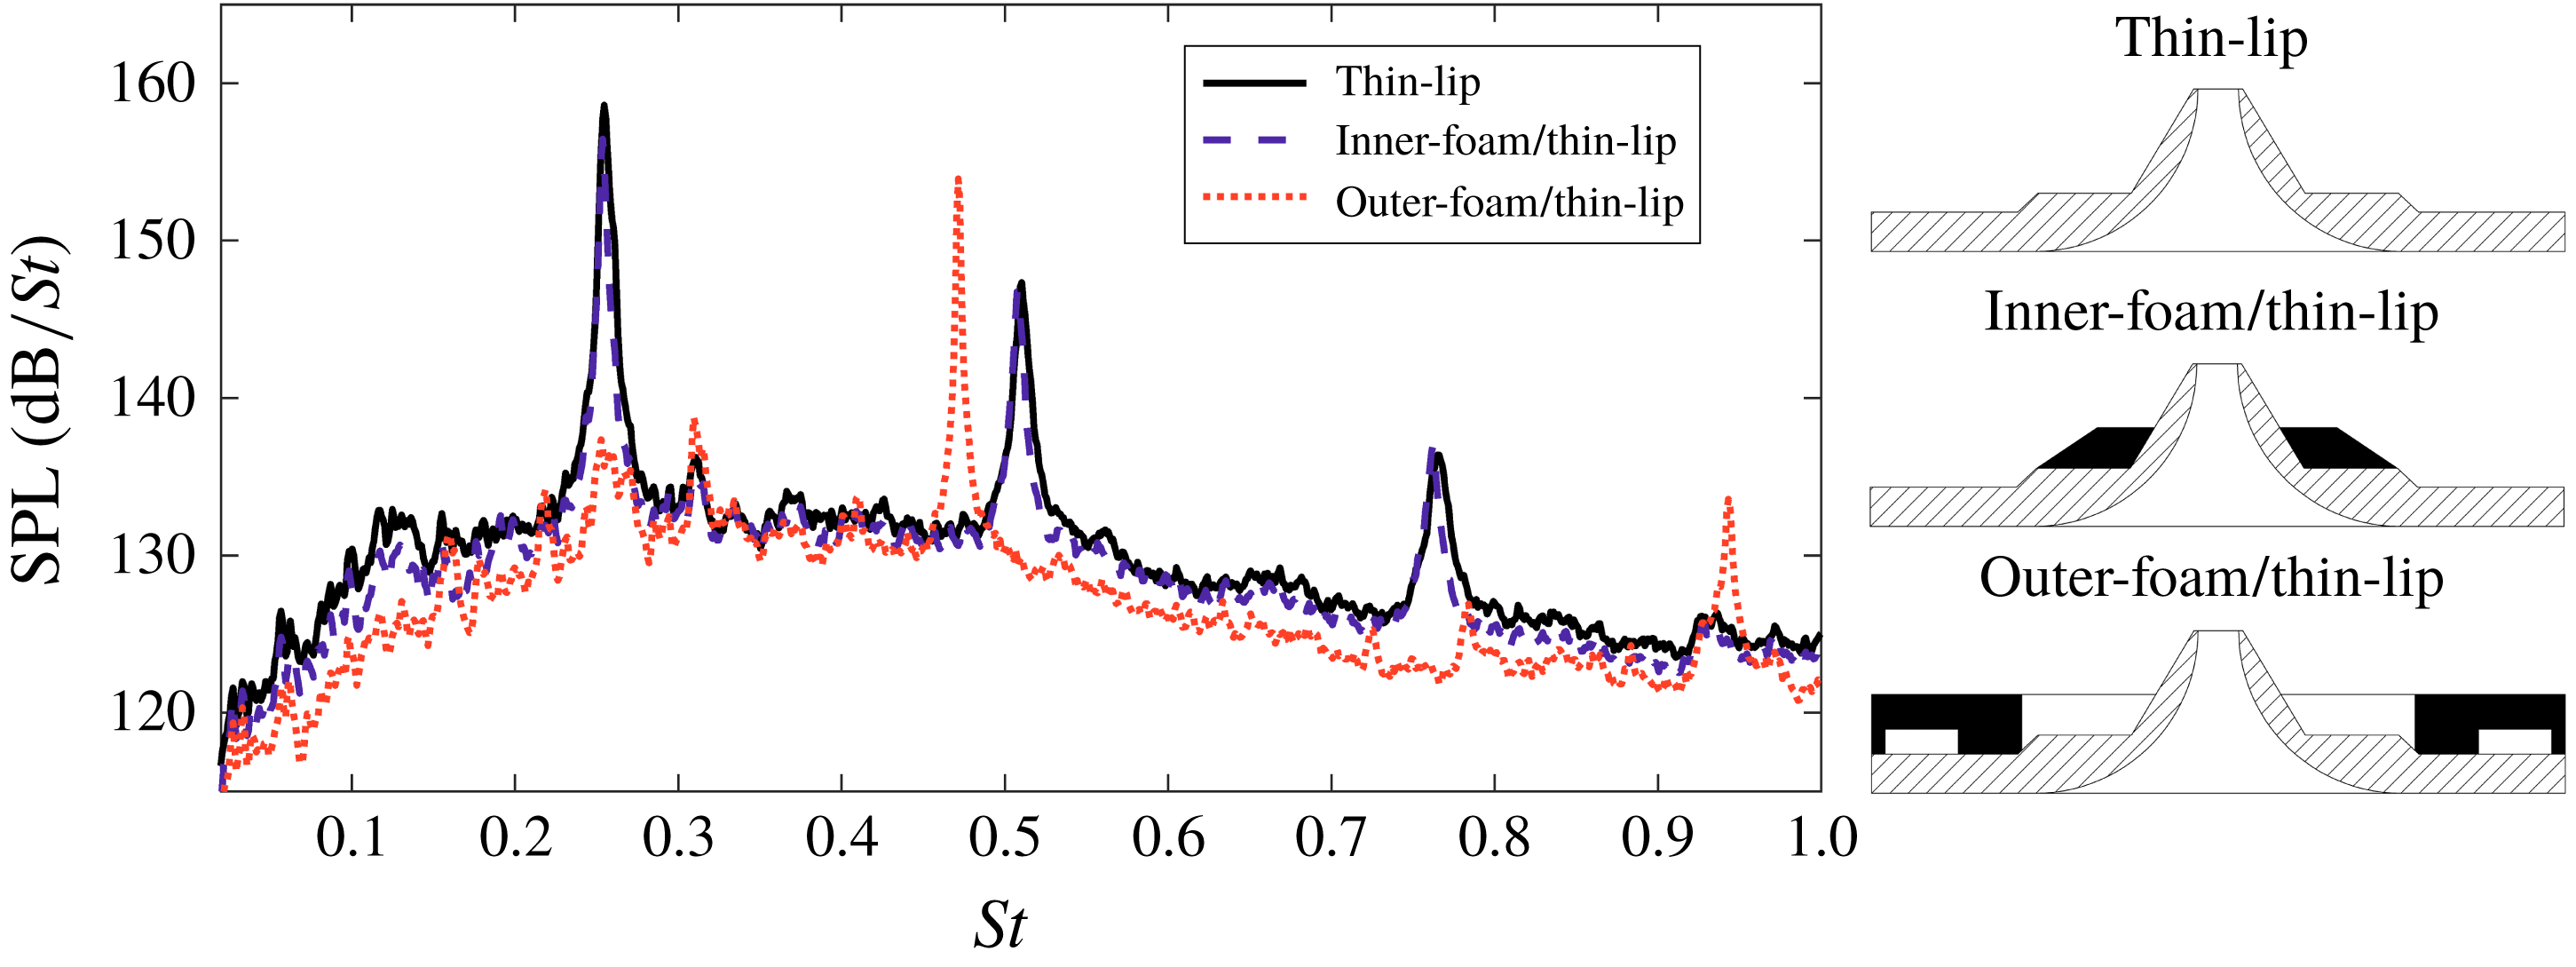
To determine the feedback path of the helical instability mode of the thin-lip jet, two more foam covers were produced. These foam covers each blocked a portion of the base surface of the thin-lip nozzle, as illustrated in figure 3(h,i). The acoustic spectra of the inner and outer-foam covers are compared to that of the original thin-lip nozzle in figure 17. The inclusion of the inner-foam cover is observed to have a negligible effect on the resulting acoustic spectrum. In contrast, the outer-foam cover results in the removal of the peak tone located at
 $St=0.255$
. Instead, a new peak is produced at
 $St=0.472$
at a lower SPL than the original tone. This new peak tone has not been observed for the other flow conditions presented here. It is concluded that by directly blocking the feedback path generating the
 $St=0.255$
tone, whilst leaving other surfaces uncovered, a new closure path has formed for the feedback process. This differs to previous research on upstream reflectors used to constructively or destructively interfere the acoustic waves at the nozzle lip (Nagel, Denham & Papathanasiou Reference Nagel, Denham and Papathanasiou1983; Raman et al.
Reference Raman, Panda, Zaman, Raman, Panda and Zaman1997). The extended surfaces, foam or metal, are not located such that a node would form near the nozzle lip to result in cancellation of these acoustic tones. The breakage of the feedback loop is concluded to be due to the blockage of the original acoustic feedback path.
The effect on the generated acoustic field for the two partial foam covers further supports the conclusion that for this facility, the feedback path that maximises (1.2) involves a feedback loop with an exclusive path that interacts with the nozzle base surface. In particular, this path appears to involve a reflection of the acoustic waves off the outer surface of the nozzle base, which allows the waves to then reach the initial shear layer and excite the flow perturbations. This strongly supports the hypothesis that the aeroacoustic feedback paths of the thin- and infinite-lip jets are different for their dominant instability modes. The difference in mode selection is due to the feedback path of the thin-lip helical mode being blocked by the infinite-lip cover. Additionally, the extended nozzle lip of the infinite-lip jet forms an increased reflective surface via which the higher frequency acoustic waves can close the toroidal instability’s feedback loop. This is supported by the toroidal mode also occurring in the intermediate-lip case.
Comparison of the acoustic spectra of the thin-lip nozzle to the inclusion of the inner- and outer-foam covers.

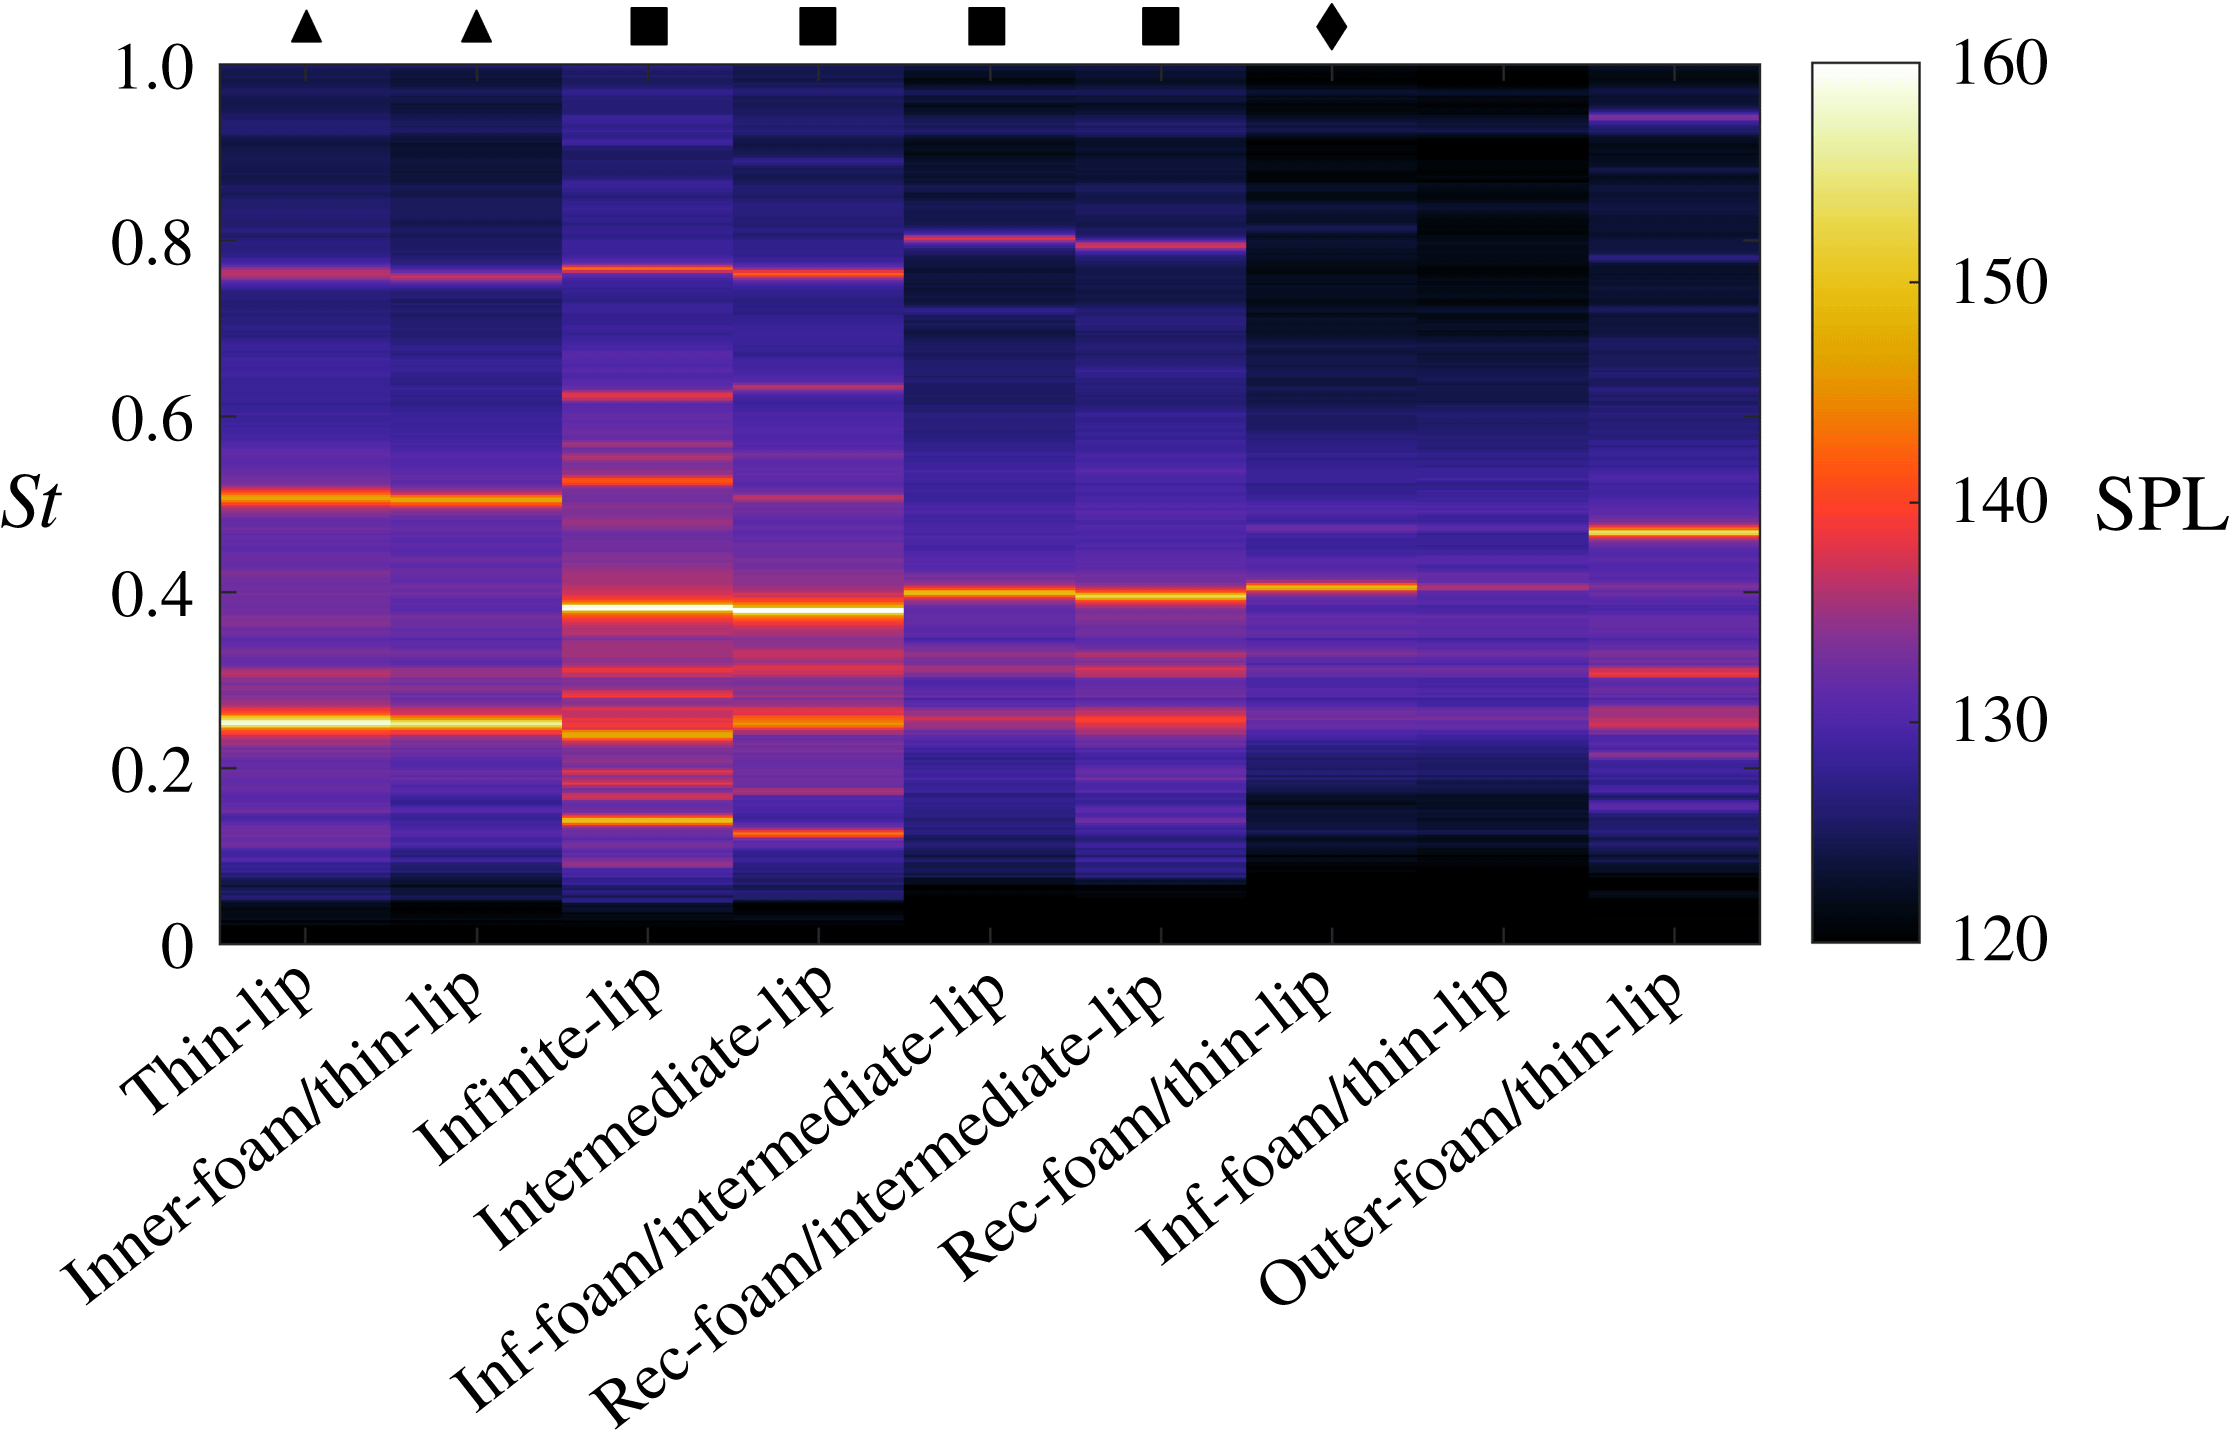
To summarise the acoustic characteristics of each flow condition, a waterfall plot is presented in figure 18. Whilst relatively small changes in peak tone frequency and sound pressure level occur, the spectra of the various cases illustrate the repeated occurrence of the
 $St\approx 0.25$
and
 ${\approx}0.39$
peak tones. It is assumed that these tones are the base flow’s most unstable frequencies. All but two flow conditions fall into one of three groups: (i) both peak tones occur ▪; (ii) the tone associated with the helical mode occurs ▴; or (iii) the tone associated with the toroidal mode occurs ♦. The only cases separate to this grouping are the infinite-foam/thin-lip case, which has no clear peak tone, and the outer-foam/thin-lip nozzle case, which has a peak tone at
 $St=0.472$
. The former is likely a result of all possible feedback closure paths being blocked by the new boundary conditions of the changing nozzle geometry. The outer-foam/thin-lip case produces a peak tone frequency that is not observed in the other flow conditions. This tone is close to the first harmonic of the tone present in the thin-lip case and thus may be the same instability mode. The ultra-high-speed schlieren for this case is not comparable, as this nozzle condition resulted in a different acoustic spectrum, containing no peak tone, in the schlieren jet facility.
The flow cases have various nozzle external geometries, even including changes to the nozzle boundary material. This shows that the flow is almost always capable of creating an aeroacoustic feedback process that amplifies at least one of these particular frequencies. This is achievable via a number of acoustic paths or small variations in the coherent structure convective velocity. This will be explored in the following section via Powell’s feedback model using different acoustic wave paths and convective velocities.
Waterfall plot for comparison of the acoustic spectra of each case. The symbols define the grouping of the flow condition based on acoustic spectra.

5.3 Frequency prediction through Powell’s feedback equation
The available feedback paths of the flow are described by Powell’s feedback equation (1.1). However, the selection of a particular path is thought to be described by the gain criterion of (1.2). The variation in the amplitude growth of certain tones will lead to the most unstable frequencies of the jet bulk flow being selected, with some dependence on the efficiency term of each process. In particular, the receptivity could be affected by the incident angle of the acoustic waves at the shear layer, in addition to having a strong dependence on the tone frequency. Thus, if an existing acoustic path becomes blocked due to the introduction of a new boundary condition, other paths using different reflective surfaces are available that could result in sufficient amplification to form a self-reinforcing feedback process. Whilst numerous feedback paths are present, the consistent selection of the
 $St\approx 0.25$
and
 $0.39$
tones in the experimental flows suggests that these two tone frequencies are often the most optimal frequencies available. Again, this is either due to the amplification of disturbances at this frequency and/or a maximisation of the efficiency of the three acoustic related processes. In this section it is demonstrated that many feedback paths are capable of producing tones close to the two tones of interest. Thus, the selected path will be one that maximises the gain criterion.
To investigate the capability of the flow to construct feedback paths that allow amplification of particular peak tones, equation (1.1) is evaluated for three feasible feedback paths and two convective velocities. For all three feedback paths, the sound source location is taken as the stand-off shock. Whilst sound sources located within the wall jet have been observed for impinging flows (Henderson et al.
Reference Henderson, Bridges and Wernet2005; Weightman et al.
Reference Weightman, Amili, Honnery, Soria and Edgington-Mitchell2017b
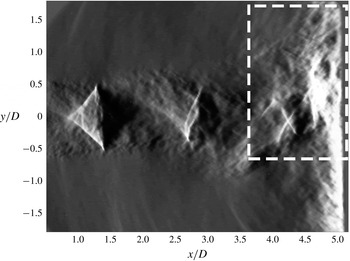
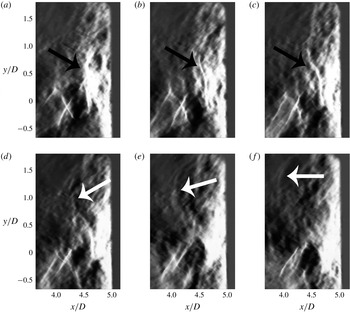
), ultra-high-speed schlieren of the current flow conditions illustrate the stand-off shock region as being the acoustic source. This is presented in figure 20 and highlighted in figure 21, as well as in supplementary Movie 1 that is available online at https://doi.org/10.1017/jfm.2018.957. The sound production mechanism appears to be a periodic shock leakage event as described by Manning & Lele (Reference Manning and Lele2000), which generates the discrete acoustic waves of the feedback loop. Also from the schlieren, no time delay is observed between the vortical structures passing the stand-off shock and an acoustic wave being produced. This results in an assumed phase delay value of
 $p=0$
.
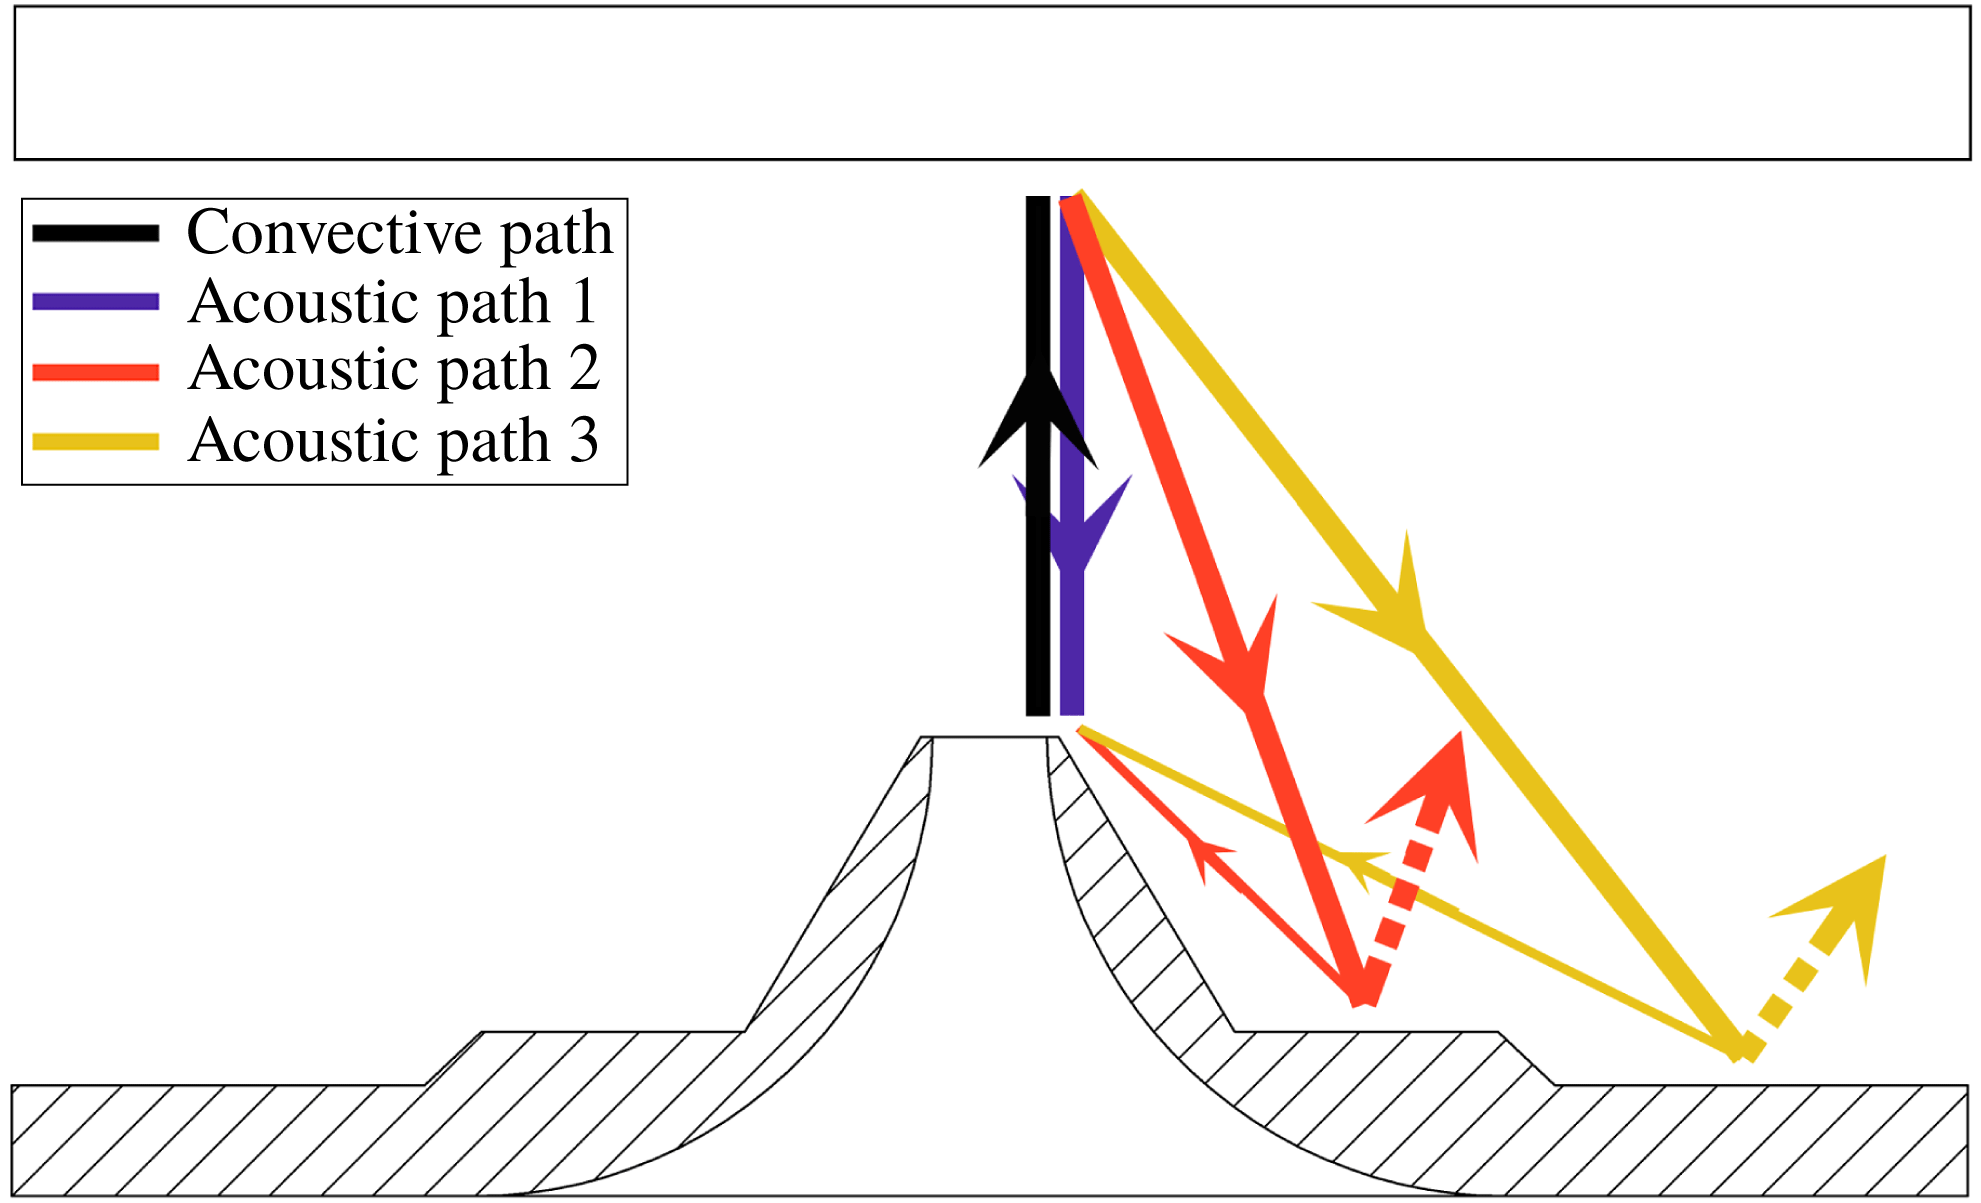
Three proposed aeroacoustic feedback paths for the thin-lip jet. Each acoustic path represents the propagation of a section of the wavefront.

Schlieren visualisation of the thin-lip impinging jet. The highlighted region is presented in figure 21 to demonstrate the sound production process.

Schlieren visualisation of acoustic wave production in the stand-off shock region highlighted in figure 20. The black arrows identify the stand-off shock, with the white arrows highlighting the produced acoustic wave.

The three proposed feedback paths, which are shown in figure 19, have the same downstream-propagating component: the advection of a vortex along the shear layer to the stand-off shock. An acoustic wave is produced and propagates outside of the jet in the upstream direction at the local speed of sound, taken here as
 $340~\text{m}~\text{s}^{-1}$
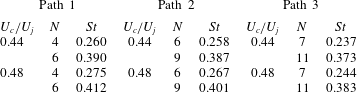
. The three paths then differ: for the first path, the acoustic wave travels back to the nozzle lip directly. In the second path, the wave travels upstream toward the inner nozzle base surface, from which it reflects. As the acoustic wavelength is of the same order as the width of the reflective surface, this reflection results in the scattering of acoustic energy in a range of directions. The directivity peak for this scattering is at the specular angle of reflection, as indicated by the thick dashed line. A smaller fraction of the total acoustic energy will also be scattered directly back towards the nozzle, as indicated by the thin solid line. This portion of the wave energy that propagates directly back to the nozzle lip is evidently sufficient to form a self-reinforcing feedback loop. The third path is similar to the second, with the acoustic wave instead reflecting off the outer surface. Whilst some conditions, namely the infinite-lip and foam cases, can only be described by one path, all three will be tested over a small range of convective velocity. The convective velocities are taken as the values estimated from § 3.3. This variation in convective velocity attempts to account for changes in the actual convective velocity due to the differences in nozzle external boundary conditions. With an unknown
 $N$
value, only the calculated frequencies closest to
 $St\approx 0.25$
and
 $0.39$
are presented.
As illustrated in figure 19, the effective acoustic paths are assumed to propagate from the centre of the nozzle bases to the nozzle lip. The position of the assumed reflection point strongly affects the predicted tone frequency. Using Path 3 as an example, the radial limits on the base surface are
 $[4.9D,8.5D]$
. For
 $U_{c}/U_{j}=0.44$
, the predicted Strouhal number varies from 0.34 to 0.42 for an
 $N$
value of 11. This large range in predicted frequency demonstrates the possibility for the effective acoustic reflection point to change, creating another variable that can enable feedback loop closure by maximising the gain criterion. Due to the difficulty in assessing this in the experimental data, it is not investigated further here and the effective reflection point is taken as the midpoint of the outer surface region.
The predicted Strouhal numbers and corresponding
 $N$
values of the closest matching tones are shown in table 5. Whilst the acoustic feedback paths are significantly different in length, the predicted tone frequencies are capable of matching well with the two main tones observed in the experimental cases for different
 $N$
values. This demonstrates that there are many feedback paths that satisfy (1.1) for the given frequencies, meaning there are many options for producing a maximum gain in (1.2) for these tones, even when one path becomes blocked due to the change in nozzle geometry.
Comparison of predicted frequencies to the
 $St=0.25$
and
 $0.39$
tones for different feedback paths and convective velocities using Powell’s feedback equation.

The ability to predict the tone production of an impinging jet has been thoroughly investigated using the bulk flow characteristics, with good success (Powell Reference Powell1988; Gojon et al. Reference Gojon, Bogey and Marsden2016; Bogey & Gojon Reference Bogey and Gojon2017). However, these models do not account for differences in boundary conditions. The result of the acoustic analysis in previous sections and the application of Powell’s feedback formula for different feedback paths illustrates the potential for different closure paths of the feedback loop due to the different nozzle external boundary conditions.
6 Concluding remarks
The role of nozzle external geometry on the azimuthal mode selection of impinging supersonic jets was studied for several nozzle configurations using PIV, acoustic measurements and ultra-high-speed schlieren. From POD analysis of the PIV data, a difference in azimuthal instability mode was found between several of the flows. Whilst the thin-lip flow contained a helical mode, an increase in nozzle lip thickness resulted in a dominant axisymmetric mode, with a secondary helical mode also present. Thus, altering the nozzle geometry results in a change of the dominant instability mode.
Two hypotheses for the change in dominant instability mode between the two flows are presented, with testing of additional nozzle external boundary conditions used to investigate the hypotheses separately. The acoustic and POD analysis of the new flow cases provide support for the hypothesis that the acoustic path of the aeroacoustic feedback loop is different between the flows. Of particular significance is the helical instability mode of the thin-lip jet. Here, the closure path is concluded to exclusively involve a reflection of the acoustic waves from the outer surface of the nozzle base. This reflection allows the wave propagation back to the nozzle lip to close the feedback loop. The demonstration of this exclusive feedback path, compared to the traditional direct acoustic path to the nozzle, illustrates the flows ability to close a feedback loop that amplifies shear layer perturbations.
Almost all of the investigated flow conditions contain a peak tone frequency at one or both of
 $St\approx 0.25$
and
 ${\approx}0.39$
. These are likely the most unstable frequencies of the bulk flow that result in the largest amplification of the initial shear layer perturbations. Analysis using Powell’s feedback equation illustrates the various feedback paths that produce impingement tone of
 $St\approx 0.25$
and
 ${\approx}0.39$
. Whilst numerous paths are possible and would result in many potential impingement tone frequencies, the feedback paths occurring in the experiments are being selected as they result in the largest disturbance amplification and/or the most efficient transmission from acoustic wave generation to the acoustic receptivity at the initial shear layer. The flow is thus able to select unconventional feedback paths that result in tone production that maximises the gain criterion of (1.2), even when the nozzle external boundary conditions are changed. This helps to explain the exclusive feedback path that occurs for the thin-lip jet’s helical instability mode.
Acknowledgements
This research was supported by Australian Research Council (ARC) Discovery Project and ARC LIEF grant resources. This research was undertaken with the assistance of resources provided at the NCI National Facility systems at the Australian National University and MASSIVE at Monash University through the National Computational Merit Allocation Scheme supported by the Australian Government.
Supplementary movie
A supplementary movie is available at https://doi.org/10.1017/jfm.2018.957.