1. Introduction
The analysis of vessel traffic for the purpose of obtaining information relevant to Maritime Domain Awareness (MDA) has a long history, dating back to the first monitoring and control of vessel movement within harbours. As technologies allowed the monitoring to encompass greater distances, the purpose of the monitoring also changed from an activity focused on port management to one focused on safety and security. With the introduction of technologies that allow vessel monitoring from space-based platforms (Lapinski et al., Reference Lapinski, Isenor and Webb2016), the monitoring also took on a global perspective.
In Canada, MDA is defined as ‘the effective understanding of everything on, under, related to, adjacent to, or bordering a sea, ocean or other navigable waterway, including all maritime-related activities, infrastructure, people, cargo, vessels or other conveyance’ (IMSWG, 2011). One important aspect of MDA is the aggregation of data and information to help formulate a consistent representation of vessel activity over the domain. However, an overabundance of MDA input data has made manual analysis time consuming, if not completely infeasible. As a consequence, there has been growing interest in the application of techniques for automated or semi-automated analysis of vessel traffic from large volume data sets (Lapinski and Isenor, Reference Lapinski and Isenor2011; Isenor et al., Reference Isenor, St-Hilaire, Webb and Mayrand2016).
The context of this work is MDA and how knowledge of normal vessel traffic patterns and the characteristics of those patterns help to determine anomalous vessel behaviour. Given that an anomaly is recognised as behaviour inconsistent with the norm (Roy, Reference Roy2008), then determining the norm represents a reasonable first step. Of course, normal can be dependent on the type of vessel with some vessel types following more predictable patterns between ports (Kaluza et al., Reference Kaluza, Kölzsch, Gastner and Blasius2010). Nevertheless, traffic pattern analysis does offer some insight into general patterns, traffic lanes and the statistical characteristics of the traffic within particular lanes.
The scientific motivation behind this work is the desire to understand relationships between spatial vessel traffic patterns and vessel attributes. This includes relationships between vessel position and other vessel attributes, including kinematic (e.g., speed, course) and nonkinematic (e.g., vessel type) attributes. Given this motivation, the research question focuses on the use of information theoretics in understanding the vessel traffic patterns. Effectively, the research asks, can mutual information between a vessel's spatial position and attribute values be used to identify and distinguish different traffic patterns or traffic characteristics?
This paper addresses the research question by introducing a new interpretation for spatial mutual information. This new interpretation provides a tool for quantifying the strength and directionality of spatial dependencies in vessel attribute values. In terms of the vessel traffic, this means that at locations where a dependency exists between location and the vessel attribute (e.g., course, vessel type), these dependencies can be discerned with mathematical rigor.
The method is also able to detect the presence of spatial boundaries between regions having differing distributions of vessel attribute values. This allows regions to be associated with different vessel movement patterns (e.g., fishing or merchant traffic), which then establishes baseline characteristics of the traffic for that location. Understanding this baseline provides a basis from which the abnormal can be determined. In this paper, the method is applied to the detection of vessel traffic boundaries in areas of complex traffic patterns.
The paper is organised as follows. Section 2 provides background on related work in information theory and MDA. Section 3 introduces the new interpretation of spatial mutual information and includes an example of its application to simulated vessel position data. Section 4 then applies the new interpretation to actual vessel positional data. Section 5 provides concluding comments.
2. Application of information–theoretic measures in MDA
For the purpose of this paper, spatial data reports (SDRs) are defined as including an n-dimensional position, possibly a time stamp, and one or more nonspatial attributes. In the context of MDA applications, SDRs are most often associated with a report containing a vessel's position, together with a number of vessel-related attributes. These attributes may be nonspatial and represented by dynamically changing kinematic data, such as vessel speed and course, or static data such as vessel identity or type, and less-frequently changing information such as vessel cargo or destination. SDRs may be produced as the output of a sensor-based tracking system or by a vessel self-reporting system, such as the Automatic Identification System (AIS) (Creech and Ryan, Reference Creech and Ryan2003).
2.1 Information theoretics
Given the discrete random variable X, with the discrete probability mass function $p({{x_i}} )$ , the Shannon entropy (Shannon and Weaver, Reference Shannon and Weaver1949) $H(X )$
 is defined as

Entropy has a minimum value of 0 when the probability mass is concentrated on a single outcome and a maximum value of $\textrm{lo}{\textrm{g}_2}|{{V_X}} |$ given a uniform distribution, where $|{{V_X}} |$
 is the number of outcomes of X. Normalisation of entropy by the value $\textrm{lo}{\textrm{g}_2}|{{V_X}} |$
 is commonly used to produce entropy values in the range [0,1].
Entropy measures have been applied to spatially indexed data using several different approaches. These include: using the spatial component of the data while not taking into account any attribute values (Ilachinski, Reference Ilachinski2004); using data points originating from specified spatial regions (Gilles, Reference Gilles1998; Oikonomopoulos et al., Reference Oikonomopoulos, Patras and Pantic2006); and using pairs or higher-order sets of data points selected using specified spatial criteria (Leibovici, 2009; Altieri et al., Reference Altieri, Cocchi and Roli2019).
Mutual information (Cover and Thomas, Reference Cover, Thomas and Edwards2006) considers the relationship between two discrete random variables X and Y and is defined as

where $p({{x_i},{y_j}} )$ is the joint probability mass function of X and Y, and $p({{x_i}} )$
 and $p({{y_j}} )$
 are the marginal probability mass functions of X and Y, respectively.
Mutual information can be defined in terms of entropy as


where $H({X,Y} )$ and $H({X\textrm{|}Y} )$
 are the joint and conditional entropies of X and Y.
The conditional entropy can be defined in terms of the expected value of the subpopulation entropies $H({X\textrm{|}{y_j}} )$ (Yao, Reference Yao and Karmeshu J.2003) as

A related concept, the specific information $I({X;{y_j}} )$ , is used to quantify dependencies between the random variable X and a specific outcome ${y_j}$
 of Y (DeWeese and Meister, Reference DeWeese and Meister1999):

As in the case of entropy, spatial information may be incorporated into mutual information by computing local spatial estimates of mutual information, based on sample subsets whose positions fall within specified local spatial regions. Local estimates of mutual information have been applied to image registration techniques using nonrigid transformations (Studholme et al., Reference Studholme, Drapaca, Iordanova and Cardenas2006). However, the majority of the approaches for incorporating spatial information into the calculation of mutual information use joint observations of two or more spatially separated samples (Li and Deutsch; Reference Li and Deutsch2010; Altieri et al.; Reference Altieri, Cocchi and Roli2018).
2.2 Maritime domain awareness
Considerable literature exists on defining vessel traffic patterns for the purpose of MDA. Pallotta et al. (Reference Pallotta, Vespe and Bryan2013) applied an unsupervised learning technique to vessel trajectories in the North Adriatic Sea. The technique used waypoint clustering to construct routes, with vessel tracks then compared to the historical routes as a means to identify anomalies. This work was extended by Nguyen et al. (Reference Nguyen, Vadaine, Hajduch, Garello and Fablet2018), where many of the assumptions made by Pallotta et al. (Reference Pallotta, Vespe and Bryan2013) were relaxed. Nguyen et al. (Reference Nguyen, Vadaine, Hajduch, Garello and Fablet2018) developed a machine-learning technique using recurrent neural networks to distinguish anomalous trajectories that do not follow shipping routes. The method also identified vessel types from the behavior of the vessel, as represented by its trajectory.
Arguedas et al. (Reference Arguedas, Pallotta and Vespe2018) considered an approach that built maritime traffic networks via clustering of vessel trajectories. The technique first clustered trajectories that shared common start and end locations, then decomposed these into distinguishable routes, and finally broke routes into straight segments. Similar to Arguedas, Yan et al. (Reference Yan, Xiao, Cheng, He, Ruan, Zhou, Li and Bin2020) constructed traffic networks using directed graphs and also incorporated contextual information, such as water depth and distance from shore. This is important for open-ocean pattern analysis where context greatly impacts trajectory alterations or what may appear as anomalous behaviours (Filipiak et al., Reference Filipiak, Strózyna, Wecel and Abramowicz2018). Work has also been conducted on accounting for context by adjusting tracks to be attracted or repelled from certain influences (George et al., Reference George, Crassidis, Singh and Fosbury2011).
The use of information theoretics in the analysis of vessel traffic is more limited. In the unsupervised learning approach of Pallotta et al. (Reference Pallotta, Vespe and Bryan2013), it was noted how entropy provides a measure as to how well traffic patterns can be predicted based on the historical traffic data. Work by Pan et al. (Reference Pan, Jiang and Shao2014) used entropy in a traffic route analysis in the ports of Xiamen and Hong Kong. Using a trajectory comparison method that considered a density of distances between tracks of different vessels, entropy was used as an objective means to identify the trajectory spread. This technique was effective at identifying and separating complex traffic routes in and around islands. Leibovici et al. (Reference Leibovici, Claramunt, Guyader and Brosset2014) applied spatial entropy measures to the analysis of spatial and temporal clusters in a vessel activity data set. This work used distance ratios and the co-occurrence of attribute values from multiple spatially separated data samples. Entropy was also used by Liu et al. (Reference Liu, Dobias and Eisler2015) based on the spatial component of vessel reports. Here, entropy contributed to the identification of seasonal trends in shipping and fishing activities. Vicente-Cera et al. (Reference Vicente-Cera, Acevedo-Merion, Nebot and Lopez-Ramirez2020) used entropy in an examination of vessels in ports throughout Europe. Using the AIS destination field and more than 1000 defined European ports, entropy was used to determine the diversity of vessels visiting the ports. In turn, this diversity index was used as an indicator of the port's economic resilience. In a similar manner, Scully et al. (Reference Scully, Young and Ross2020) used the AIS vessel type in an entropy calculation for a management of navigational structures, for example jetties, breakwaters and seawalls. Here, the diversity of vessel type visiting the structure was proposed as a management tool for the assessment of structure performance and use.
Entropy has also been used in past work for the quality control of vessel data supporting MDA. For example, entropy has been applied to attribute matching between AIS messages and authoritative databases for the purpose of correcting attribute values in high-volume data streams (Horn et al., Reference Horn, Isenor, MacNeil, Turnbull, Beierle and Dekhtyar2015). Information theory has also been used to assess the data quality of AIS messages (Iphar et al., Reference Iphar, Napoli and Ray2015) and applied to the semantics in MDA ontologies, for the matching of vessel labels (Blasch et al., Reference Blasch, Dorion, Valin and Bosse2010).
It should be noted that the cited literature on the use of information theoretics in vessel trajectory construction does not document any specific data manipulation as a result of report-to-report correlation. Although kinematic data will have a random component, there will also be a correlation between reports originating from the same vessel track, with the degree of correlation dependent on the vessel motion. The problem of report-to-report correlation in kinematic data has been studied extensively in the tracking and data fusion literature (Bar-Shalom et al., Reference Bar-Shalom, Fortmann and Cable1990; Blackman and Popoli, Reference Blackman and Popoli1999). Static or infrequently changing AIS attribute data also have correlation issues because the repeated values are not independent random samples. The impact of repeated measurements on statistical analyses is a recognised problem in the statistics community (Millar and Anderson, Reference Millar and Anderson2004); however, there is little mention of this problem in the literature on spatial information theoretic measures.
3. A new interpretation of spatial mutual information
A new interpretation is proposed for the characterisation of spatially indexed attribute data, based on the mutual information between a spatial position and an attribute value. This measure is distinguished from existing approaches, described in Section 2, that involve joint observations of spatially separated variables or local spatial estimates of the mutual information between multiple attributes.
Assume a set of n spatially indexed data records of the form $\{{{u_k},{x_k}} \}, k = 1, \ldots , n$ , with ${u_k}$
 being the continuous-valued spatial location and ${x_k}$
 being a discrete-valued attribute measured at spatial location ${u_k}$
 . The spatial locations, $U = \{{{u_k}} \}$
 , are discretised into a set of i spatial subregions $R = \{{{r_i}} \}$
 ; the attribute data, $X = \{{{x_k}} \}$
 , are assumed to have a set of j values.
Using the definition of mutual information in Equations (3) and (5), the spatial mutual information $I({X;R} )$ between the attribute X and the discretised spatial position R is defined as

or equivalently

The spatial mutual information $I({X;R} )$ measures the reduction in uncertainty about X given knowledge of the spatial position R; or, conversely the reduction in uncertainty of R given knowledge of X.
This new interpretation of spatial mutual information is most closely compared with elements of the work of Altieri et al. (Reference Altieri, Cocchi and Roli2018) and of Studholme et al. (Reference Studholme, Drapaca, Iordanova and Cardenas2006). However, the Altieri et al. (Reference Altieri, Cocchi and Roli2018) spatial mutual information measure, $I({Z;W} )$ , measures dependencies between Z – a discrete random variable whose instances describe the values of pairs of spatially indexed attributes X – and W, the distribution of distances between the pairs of X. The Studholme et al. (Reference Studholme, Drapaca, Iordanova and Cardenas2006) work considered a set of subregions $r\epsilon R$
 to be a random variable. However, the mutual information between a spatial random variable and an attribute was not considered.
Also defined here is the spatial specific information, $I({X;{r_i}} )$ between the attribute X and the spatial outcome ${r_i}$


which describes the reduction in the entropy of the attribute X, given knowledge of a specific value ${r_i}$ of the spatial variable R. The spatial specific information is used to determine the subregions that have the largest influence on the spatial dependence of attribute X. The spatial specific information bears some similarity to the spatial partial information, $I({Z;{w_i}} )$
 , as formulated by Altieri et al. (Reference Altieri, Cocchi and Roli2018). However, $I({Z;{w_i}} )$
 is based on a formulation for specific information different than Equation (6) and that possesses different properties.
Additional characterisation of the spatial mutual information is possible if the gradient of the spatial specific information is considered. It is observed that the set $\{{I({X;{r_i}} )} \}$ , calculated over R, if treated as a spatially indexed function, can be used to estimate the direction and magnitude of the greatest rate of change in $I({X;{r_i}} )$
 by using a gradient operator. The gradient is calculated using a discrete gradient operator, for example the Roberts operator for 2 × 2 subregions or the Sobel or Prewitt operators for 3 × 3 subregions (Rosenfeld and Kak, Reference Rosenfeld and Kak1982). For R composed of a 2 × 2 spatial array of four subregions $\{ \{{{r_3},{r_4}} \},\{{{r_1},{r_2}\} } \}$
 and using the Roberts operator, the gradient magnitudeFootnote 1 and gradient directionFootnote 2 of $\{{I({X;{r_i}} )} \}$
 are defined as


respectively, where


It is noted that the Roberts operator measures the difference in $I({X;{r_i}} )$ across diagonally opposed subregions. Based on Equation (6), the gradient in the spatial specific information is equivalent to the negative gradient in the conditional entropy, $H({X\textrm{|}{r_i}} )$
 .
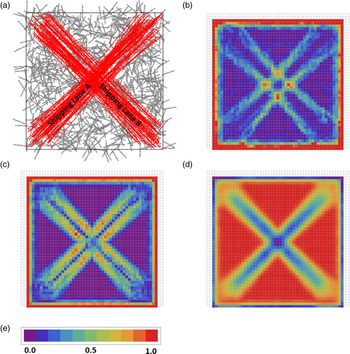
The spatial mutual information and specific information gradient proposed here are useful in the detection of spatial boundaries between regions of data having different statistical properties. As an example, consider the kinematic property course over ground (COG) in a simulated vessel track data set (Figure 1). Figure 1(a) shows foreground vessel tracks (shown in red) originating from two crossing shipping lanes, overlaid on a background of random vessel traffic (shown in grey). Each track is composed of a defined number of evenly spaced reports, with each report consisting of an (x,y) location and a single COG value between 1⋅0° and 360⋅0°.
Simulated vessel track data. (a) A subsample of 100 foreground tracks (red) (100 reports/track) and 1000 background tracks (grey) generated within the 100 × 100 spatial region; (b) Spatial mutual information, $I({\textrm{COG};R} )$ ; (c) Spatial specific information gradient magnitude, $|{\textrm{grad }I({\textrm{COG};{r_i}} )} |$
 ; (d) Spatial entropy, $H({\textrm{COG}} )$
 ; (e) Continuous-valued spectral colormap is scaled as fractional range between plot minimum and maximum values: {0⋅000078, 0⋅00571} for (b); {0⋅000016, 0⋅0873} for (c); and {0⋅899, 1⋅000} for (d)

The qualitative behaviour of the spatial mutual information, $I({\textrm{COG};R} )$ , the spatial specific information gradient magnitude, $|{\textrm{grad }I({\textrm{COG};{r_i}} )} |$
 , and the normalised spatial entropy, $H({\textrm{COG}} )$
 , are illustrated in the plots shown in Figures 1(b)–1(d). Each information measure is computed over a 49 × 49 array of overlappingFootnote 3 4 × 4 unit local regions, defined over a 100 × 100 unit spatial domain that contains 2 million foreground track reports and 18⋅6 million background track reports. The information measures are calculated using six outcomes for COG (based on bins of width 60°) and four outcomes for R (based on subregions of size 2 × 2 units). In order to better visualise the spatial variations in each plot, information measure values in each local region are colour-coded using a continuous-valued spectral colour map, with purple and red representing the plots’ minimum and maximum values, respectively.
As observed in Figures 1(b) and 1(c), $I({\textrm{COG};R} )$ and $|{\textrm{grad }I({\textrm{COG};{r_i}} )} |$
 are both sensitive to the spatial changes in the distribution of COG that occur at the boundaries of the shipping lanes. If we consider a scenario in which the background tracks correspond to an activity other than merchant shipping, such as fishing (based on the uniform distribution in COG), then this example illustrates how the new information measures could be used to detect spatial changes in vessel activity. $I({\textrm{COG};R} )$
 has maximum values at the four intersections of the shipping lane boundaries. The identification of intersections may be important for way-point detection, which would then be beneficial to algorithms needing automated waypoint detection (Nguyen et al., Reference Nguyen, Vadaine, Hajduch, Garello and Fablet2018). In comparison, $|{\textrm{grad }I({\textrm{COG};{r_i}} )} |$
 has a stronger response to shipping lane boundaries but a much weaker response to boundary intersections. In contrast to $I({\textrm{COG};R} )$
 and $|{\textrm{grad }I({\textrm{COG};{r_i}} )} |$
 , spatial entropy is sensitive to regions having differing levels of dispersion in the distribution of COG. Entropy is high in local regions containing a uniform distribution in COG from background vessel track reports. Local regions corresponding to the shipping lanes have a less-uniform distribution of COG and, hence, a lower entropy.
Based on tests conducted using the simulation example, several factors are observed to affect the measurements of spatial mutual information and spatial specific information gradient magnitude. These include:
• Report-to-report correlation has an impact on the result. Having more than two reports originating from the same track, in a given subregion, can result in elevated $I({\textrm{COG};R} )$
 values in local regions having a low spatial dependence in attribute values;
• The total number of reports influences the information measures. Reducing the total number of reports available to compute $I({\textrm{COG};R} )$
or $|{\textrm{grad }I({\textrm{COG};{r_i}} )} |$ will increase the variability in the resulting information measures; and• To a lesser extent, information measures are affected by the number of outcomes selected for COG and R; particularly, if bin boundaries for COG coincide with the courses of dominant shipping lanes.


4. Study using actual AIS track data
A data set for July 2019 was constructed from space- and land-based AIS receptions in the area of 7°S - 2°N, 75°E - 95°E. The data set contains a total of 324,168 position reports comprised of AIS message types 1, 2, 3, 18, and 19. The area approximately coincides with the rectangular region identified in Figure 6 of Isenor et al. (Reference Isenor, St-Hilaire, Webb and Mayrand2016). Using this data set, local spatial estimates of entropy, spatial mutual information and spatial specific information gradient were computed using AIS positions (latitude and longitude) and COG, whose values are in the range (0⋅0, 359⋅9) degrees (relative to North).
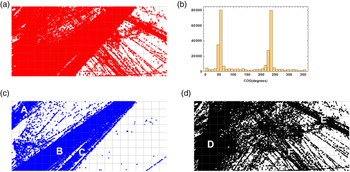
A geospatial plot of the AIS position reports and a histogram of the distribution of COG are presented in Figures 2(a) and 2(b), respectively. COG values have two dominant peaks – in the ranges 40°–60° and 220°–240° – that have a difference in course of 180° and are indicative of two-way shipping traffic. The spatial distribution of position reports as a function of COG is illustrated in Figures 2(c) and 2(d). Three dominant shipping lanes (labelled ‘A’, ‘B’, and ‘C’ in Figure 2(c)) are observed for COG values in the range 220–240°.Footnote 4 Position reports whose COG values fall outside the ranges 40°–60° and 220°–240°, as shown in Figure 2(d), reveal several smaller shipping lanes (those labelled ‘E’ and ‘F’). In the region labelled ‘D’, COG has the full range of values, which may indicate a movement pattern associated with fishing. Crossing points between shipping lanes, such as between shipping lanes F and C and shipping lanes E and C, are observed in Figure 2(a).
AIS position reports as a function of COG. (a) Position reports for all COG values (0° ≤ COG < 360°); (b) Histogram of COG values; (c) Position reports with 220° ≤ COG < 240°; (d) Position reports with COG values falling outside 40°–60° and 220°–240°

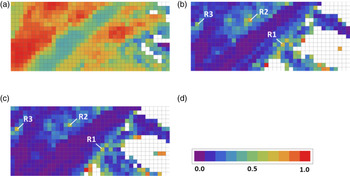
Local spatial estimates of normalised entropy, spatial mutual information, and spatial specific information gradient were computed for the AIS data set using COG bin sizes of 45°, 60°, and 90° and a single value for $|{{V_R}} |$ (four 0⋅5° × 0⋅5° sub-regions). The selected subregion size and $|{{V_R}} |$
 are compromises between maximising the spatial resolution of local estimates, having a sufficiently large sample size, and minimising the number of reports/track in a given subregion. Each measure is calculated using overlapping 1° × 1° local regions. This creates an effective spatial resolution of 0⋅5° by using vertical and horizontal overlaps of 0⋅5°. Plots of $H({\textrm{COG}} )$
 and $I({\textrm{COG};R} )$
 are shown in Figure 3. As in Section 3, entropy and spatial mutual information values are colour-coded using the spectral colour map scaled to the plot minimum and maximum values. Regions having no colour indicate an insufficient number of reports to satisfy a minimum sample size constraint of $2|{{V_{\textrm{COG}}}} |$
 for entropy, and $3|{{V_{\textrm{COG}}}} ||{{V_R}} |$
 for mutual information, in accordance with guidelines proposed by Wong and Chiu (Reference Wong and Chiu1987) and Liu et al. (Reference Liu, Dobias and Eisler2015).
Entropy and spatial mutual information of AIS data using overlapping local regions. (a) $H({\textrm{COG}} )$ , COG bin size = 45°; (b) $I({\textrm{COG};R} )$
 , COG bin size = 45°; (c) $I({\textrm{COG};R} )$
 , COG bin size = 60°; (d) Continuous-valued spectral colormap is scaled as fractional range between values: {0⋅0, 1⋅0} for (a); {0⋅0, 0⋅6854} for (b); and {0⋅0, 0⋅7166} for (c)

As illustrated in the plots in Figure 3, entropy and spatial mutual information provide complementary information regarding spatial features in the AIS data. In the plot of $H({\textrm{COG}} )$ , in Figure 3(a), we observe: regions of low and medium COG entropy that correspond to shipping lanes B and A, respectively; a region of high COG entropy to the left of shipping lane B that corresponds to the region marked D in Figure 2(d); and, the smaller high entropy region to the right of shipping lane B that corresponds to a region of crossing tracks in Figure 2(d).
$I({\textrm{COG};R} )$ is computed for COG bin sizes of 45° and 60° in Figures 3(b) and 3(c), respectively. Regions having spatially homogeneous distributions of COG are observed to have low values of $I({\textrm{COG};R} )$
 . Regions of COG homogeneity can occur if COG has a restricted range of values, such as in the shipping lanes denoted A, B and C. In addition, COG homogeneity can occur when a broad range of values are encountered, such as in region D. The boundaries of the shipping lanes are observed as a weak transition to a higher level of spatial mutual information, as observed along the left boundary of shipping lane B and the right boundary of shipping lane C. The boundary between shipping lanes B and C is more clearly defined using a COG bin size of 45°. Several local maxima in $I({\textrm{COG};R} )$
 , observed in consistent locations in both of Figures 3(b) and 3(c), and labelled as R1, R2 and R3, can be confirmed as corresponding to crossing points between shipping lanes by applying the spatial specific information, $I({\textrm{COG};{r_i}} )$
 .
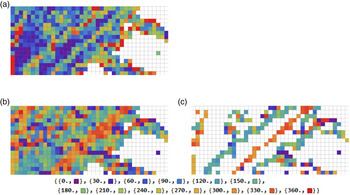
The boundaries of spatially homogeneous regions, such as shipping lanes, are more reliably identified by considering the magnitude and direction of the spatial specific information gradient. Figure 4(a) presents $|{\textrm{grad }I({\textrm{COG};{r_i}} )} |$ . Regions of higher gradient magnitude are observed that correspond roughly to the left boundary of region D, and the left and right boundaries of shipping lane B. Areas of high gradient magnitude adjacent to blank regions are assumed to be spurious. Regions of low gradient magnitude correspond to shipping lane B, possibly shipping lane C and region D.
Gradient magnitude and direction of $I({\textrm{COG};{r_i}} )$ for AIS data set. (a) Colour-coded magnitude in gradient $I({\textrm{COG};{r_i}} )$
 , using the spectral colormap in Figure 3(d), scaled in the range {0⋅0, 1⋅0}; (b) Colour-coded direction in gradient $I({\textrm{COG};{r_i}} )$
 ; (c) Colour-coded direction in gradient $I({\textrm{COG};{r_i}} )$
 for local regions with |grad $I({\textrm{COG};{r_i}} )|$
 ≥ 0⋅4. Colour codes for directions, at 30° intervals, are shown below (b) and (c). All plots use: overlapping 1° × 1° local regions (with 0⋅5° shifts between overlapped regions); $I({\textrm{COG};{r_i}} )$
 is based on four 0⋅5° × 0⋅5° sub-regions and 45° COG bins

The gradient direction, $\theta ({\textrm{grad} I({\textrm{COG};{r_i}} )} ),$ is also useful to consider and is presented in Figure 4(b). The gradient direction is colour-coded using the spectral colour map, with violet corresponding to 0⋅0° and red corresponding to 360⋅0°. As shown in Figure 4(c), by mapping the gradient direction onto regions that have a high value of gradient magnitude (in this case, exceeding a threshold of 0⋅4), boundary features are more clearly identified. It is observed that the gradient direction has a consistent value over the spatial extents of the different boundary features; and, that for shipping lanes the values of gradient direction are roughly orthogonal to the direction of the shipping lane.
Shipping lane boundaries and crossing points are observed to be less well discriminated in AIS data when compared against the simulation example presented in Section 3. In part, this can be explained by differences in the effects of report-to-report correlation as well as sample size. Using 0⋅5° × 0⋅5° subregions, the AIS data set has a median value of three reports/track/subregion (computed over all subregions). This value exceeds the guideline of two or fewer reports/track/subregion reported in Section 3. Perhaps more significantly, the distribution of AIS data has a ‘long tail’, with nine or more reports/track/subregion in 20% of the cases and 17 or more reports/track/subregion in 10% of the cases.Footnote 5 Also, considering the subset of local regions that meet the minimum sample size criteria for mutual information (assuming $|{{V_{\textrm{COG}}}} |= 8$ and $|{{V_R}} |= 4$
 ), the AIS data has a median and mean of 934 and 2136 reports/local region, respectively. This sample size is comparable to simulated data values when variability in information measures began to be observed. Further study is required to quantify the effects of report-to-report correlation on spatial information theoretic measures and to better understand trade-offs between sample size and report-to-report correlation.
5. Conclusions
This paper introduces a new interpretation of spatial mutual information, which may be used to quantify the degree of spatial dependence in attribute values in spatially indexed attribute data. Our measure is differentiated from those spatial information measures based on the joint observations of spatially separated variables. It is extended to characterise dependencies between attribute values and specific values of spatial position (and vice versa), using the spatial specific information and the gradient in the spatial-specific information. Variations in spatial mutual information and spatial specific information measures over the domain are measured by computing estimates over a set of local spatial regions. Spatial mutual information and spatial specific information are shown to be complementary to spatial entropy.
Spatial mutual information, and related spatial specific information measures, provide new tools to answer questions regarding the presence of spatial dependencies in attribute values; and their strength, degree of directionality, whether specific attribute values dominate the dependency, and where in the domain such dependencies exist. These new information measures can be applied to spatially indexed vessel data for the detection of spatial boundaries between regions having different vessel movement patterns, where such patterns are characterised by different distributions of vessel attribute values. Their utility for detecting vessel traffic boundaries in areas of complex traffic patterns is demonstrated using simulated and collected AIS vessel reporting data.