

Introduction
Cigarette smoking is one of the most significant risks for developing atherosclerotic cardio vascular disease (ASCVD) and a leading cause of both preventable and premature death in the United States (U.S. Department of Health and Human Services, 1990; 2014). Prospective epidemiological and mechanistic studies also suggest that smoking increases the risk of diabetes mellitus (Ford, Li, & Sattar, Reference Ford, Li and Sattar2008).
Metabolic Syndrome (MetS), which is characterized by a group of clinically measurable variables, including abdominal obesity, hypertension, and dyslipidemia is associated with both an increased risk for type 2 Diabetes and ASCVD (Kaur, Reference Kaur2014). Smoking cessation is a top priority for people at risk for ASCVD and in particular with MetS (National Heart, Lung, and Blood Institute, 2002).
The association of smoking and diabetes may be through the development of the MetS. Paradoxically, several earlier studies demonstrated that smoking cessation could actually increase the risk for MetS which may be related to weight gain after tobacco cessation (Ishizaka et al., Reference Ishizaka, Ishizaka, Toda, Hashimoto, Nagai and Yamakado2005; Kim et al., 2009; Wada, Urashima, & Fukumoto, Reference Wada, Urashima and Fukumoto2007). However, a recently published large cohort study found that smoking increases the risk of MetS (Slagter et al., Reference Slagter, van Vliet-Ostaptchouk, Vonk, Boezen, Dullart and Kobold2013) and meta-analysis of prospective studies found smoking adds to any pre-existing risks and active smoking is associated with the higher risk of developing MetS (Sun, Liu, & Ning, Reference Sun, Liu and Ning2012).
The mechanism by which smoking may promote vascular disease is complex and appears to be related to the development of vascular endothelial dysfunction (Messner & Bernhard, Reference Messner and Bernhard2014). A recent study from Korea found that smoking changed cytokines implicated in the MetS as increased plasma leptin and plasma ghrelin concentrations decreased after smoking cessation (Lee et al., Reference Lee, Joe, Kim, Park, Lee, Sung and Kim2006). The overall impact of tobacco on MetS, and in particular the hormones related to human energy metabolism and MetS are not fully known and there are few prospective cohort studies evaluating these relationships. Tobacco is a significant independent risk factor for ASCVD and may play a unique role through the development and promotion of MetS.
We determined whether stopping smoking in a targeted tobacco cessation program in smoking veterans with MetS affects the variables of MetS and therefore prevalence, insulin resistance, and hormones related to obesity. The objective of this study is to evaluate the impact of short-term smoking cessation on MetS risk factors and hormones related to human haemostasis, energy metabolism, and MetS.
Thus, our key evaluation questions are as follows:
-
1. Does the prevalence of MetS or individual components of MetS change among the veterans who quit smoking?
-
2. Do the changes of MetS risk factors including individual MetS components, hormones (ghrelin, leptin, insulin), and insulin resistance differ significantly in veterans who quit smoking compared to veterans who continued to smoke?
A convenience sample of veterans attending a tobacco cessation program was chosen as a target population because smoking and MetS are known to be highly prevalent among veterans compare to the general population. Previous unpublished research showed 26% of veterans in VA Loma Linda smoked and the prevalence of MetS in Loma Linda VA population is 42% (Thomazin, Reference Thomazin2008). Our own retrospective analysis of 500 veterans who enrolled smoking cessation class indicated that MetS was present in 63% of the group.
Methods
Between 2008 and 2011, male veterans attending VA Loma Linda's the “Break the Chains of Nicotine Addiction” tobacco-dependence treatment program were invited to enrol in a prospective observational follow-up study of the effects of stopping smoking on risk factors associated with MetS and the on overall prevalence of MetS. The study was approved by the Research and Development and Human Subjects Sub-Committee of the Loma Linda Veterans Medical Center.
The initial goal was to recruit about 130 veterans with MetS after screening for MetS male smoking veterans who attended the “Break the Chains of Nicotine Addiction” stopping smoking program. After describing the program, veterans aged 18–65 years of age, living within 50 miles of LLVAMC and smoking at least five cigarettes/day or more for the last year were invited to join the study. Informed written consent was obtained from veterans that met the inclusion criteria and underwent initial screening evaluations, including medical and smoking history.
Veterans were excluded if they used other forms of tobacco other than cigarettes, current dependence on addictive substances other than nicotine, treatment with a weight-loss drug or severe chronic diseases that would affect the weight, lipid concentrations, or have high morbidity/mortality risk during the course of the trial.
Subjects were screened for the presence of MetS components by measuring blood pressure, pulse, weight, body mass index (BMI), waist circumference, fasting lipid profile, and fasting blood glucose. If a subject had three or more components of MetS and met the enrolment criteria during the first visit or one year prior to the first visit, he was included and continued in the study.
The National Cholesterol Education Program (NCEP) Adult Treatment Panel III (ATP III) MetS criterion was used in identifying MetS (National Heart, Lung, and Blood Institute, 2002). MetS was identified as the presence of three or more of these five components:
-
• Elevated waist circumference: Equal to or greater than 102 cm.
-
• Elevated triglycerides: Equal to or greater than 150 mg/dl or on statins.
-
• Reduced HDL cholesterol: Less than 40 mg/dl or on statins.
-
• Elevated blood pressure: Equal to or greater than 130/85 mm Hg, or on blood pressure medication.
-
• Elevated fasting glucose: Equal to or greater than 100 mg/dl or on diabetes medication.
Fasting blood samples were collected for blood glucose and a lipid profile. Serum samples were also collected and with plasma specimens stored at a –80°C for determination of leptin, ghrelin, and insulin concentration.
A detailed questionnaire was obtained from subjects as to smoking status as cigarette use per day. The carbon monoxide concentrations were obtained in each subject. A medical history documenting diabetes, hypertension, and cholesterol medication and a brief exercise questionnaire was completed. All subjects were smoking during the first visit.
The study required two visits over 6–12 months of follow-up to complete the study. Baseline data was collected during first visit with the second visit at 6–12 month of follow-up. In each visit, identical data were collected as the baseline above. On study completion therefore, each subject had measurements obtained at baseline and after the follow-up. Each subject served as his own control.
During the follow-up period, subjects were provided identical counselling and treatment to stopping smoking regardless of smoking status during the visit. The subjects were given an opportunity to attend smoking cessation class without limitation. The veterans enrolled in the study were seen by physicians in regular intervals in the Preventive Medicine Stopping Smoking Clinic and were interviewed about smoking status and counselled about stopping or cutting down smoking. Medication was provided based on need and included nicotine replacement therapy (nicotine patch, nicotine gum, and nicotine inhaler nicotine nasal spray), bupropion (Zyban®), or both. Subjects gave expired carbon monoxide concentration measurement during each visit to validate self-reported smoking status and amount of cigarettes they were using. Self-reports of subject tobacco cessation were validated by the measurement of expired low concentrations of carbon monoxide in each visit.
Subjects who were continuously abstinent from smoking for at least two months at study end were classified as “quitters”. Subjects who continuously smoked at least two months before the end of follow-up and smoked at least 80% of the time were classified as “non-quitters”. The rest of the subjects who quit intermittently and smoked sporadically were classified as “intermittent quitters”. All 95 subjects were included in “overall” group comparison analysis. We were able to obtain samples in 72 subjects including all “quitters”, all “non-quitters”, and 6 “intermittent smoker” and analysed for the leptin, ghrelin, and insulin concentrations.
We determined the five components of MetS (waist circumference, blood pressure, fasting blood glucose, HDL, triglyceride), and other MetS risk factors such as weight, BMI, LDL, HDL ratio (Total cholesterol/HDL), total serum ghrelin, leptin, and insulin concentrations. Insulin resistance was estimated from the fasting glucose and insulin concentrations by using Homeostasis Model Assessment (HOMA) method (ref).
The change in each component of MetS, risk factors of MetS, and hormone concentration were calculated as the difference (delta) between the values at the baseline and after the follow-up. Quitter, non-quitter, intermittent quitter, and the overall within group mean absolute difference before and after the follow-up were determined by using two-sided paired Student's t-test. After the follow-up, the average change for the group was obtained by calculating the average of differences (delta) compare to the baseline. Student's t-test for continuous unpaired data was used for between group change comparison between quitters and non-quitters. For categorical data, McNemar's test was used to examine the within group prevalence (proportion) difference. To avoid statin's possible confounding effect on MetS risk factors and MetS status in the end of study, paired t-test was repeated that excluded statin users from both group. Simple linear regressions analyses were used to evaluate the associations of MetS risk factor differences before and after the follow-up as dependent variables and total duration of abstinence from smoking as independent variables. The simple linear regression and Pearson correlation coefficient tests were used to study the relationships between weight and blood sugar, ghrelin and lepin.
Biochemical measurements: We used sandwich ELISA-based assays to measure fasting total ghrelin (pg/ml; EZGRT-89K, MILLIPORE, Billerica, MA), fasting leptin (ng/ml; EZHL-80SK, MILLIPORE, Billerica, MA), and fasting plasma insulin (µIU/ml; 80-INSHUU-E01.1, ALPCO Immunoassays, Salem, NH) according to kit instructions. We measured the absorbance in both assays at 450 nm on a plate reader (µQuant, Microplate Spectrophotometer, BioTek Instruments Inc., Winooski, VT). We measured the samples in duplicate and re-assayed those with more than 10% variation from fresh aliquots. The average coefficient of variation (%) using ELISA kits for ghrelin (total) assays was 3.3% (range: 0–9.8), for leptin assays was 3.9% (range: 0–9.8), and for insulin assays was 3.1% (range: 0–9.6). We calculated the Homeostasis Model Assessment of Insulin Resistance (HOMA-IR) scores using the following equation (1): HOMA-IR = [FPI (µU/ml) × FPG (mg/dl)/18]/22.5.
SAS, version 9.2; SAS Institute, Cary, NC was used in statistical analysis. For all analyses, statistical significance was accepted at a p value of <0.05. All means are reported with 95% confidence interval. Cases with missing values were eliminated from the average or t-test calculations for the each group. Both values are eliminated in paired t-test calculations if only measurement was obtained in either baseline or after the follow-up.
Results
One hundred fifty nine (159) eligible veterans signed up for the study, 152 came to the initial visit and offered baseline data. Fifty seven (57) subjects were lost to follow-up, with 95 subjects completing the study. Non-Hispanic whites made up 63% of the subjects and 80% of subjects were between the 47 and 66 age.
Among the 95 subjects who completed the study, 30 (30/95) subjects quit and met the criteria for “quitters” category, 36 (36/95) continuously smoked and met the criteria for “non-quitters”. Intermittent quitters were classified as not filling either criteria and were 29 (29/95) subjects. A total of 94.7% (90/95) subjects (all quitters, 33 of non-quitters, and 27 of intermittent quitters) had MetS at baseline. The rest, 5.2% subjects did not have MetS at the baseline, but were diagnosed with MetS within one year of the baseline (Table 1). 50% of the quitters, 30.6% of non-quitters, and 44.8% of the intermittent quitters had diabetes at the baseline.
MetS components, risk factor, and hormone average at baseline and after the follow-up in quitters and non-quitters

Notes: Paired sample t-test, comparing baseline to the end of the follow-up.
Quitters, non-quitters, and intermittent quitters were on average had followed-up for 244.9, 240.6, and 265.5 days, respectively. Quitters’ mean length of continued abstinence before the end of follow-up was 197.6 (169.2–225.9) days. Total days of abstinence were 210.1 (187.7–232.6) for quitters, 9.8 (5.4–14.3) days for non-quitters, and 106.1 (67.7–144.6) days for intermittent quitters during the follow-up. Only 44.4% of non-quitters continuously smoked during the entire follow-up period, the rest of non-quitters quit at a median of 6 days during the follow-up period.
At the baseline, average age for non-quitters was 55.6 (95% CI 52.2–59.0) years, quitters was 58.7 (56.6–60.9) years, intermittent quitters was 55.8 (53.2–58.4). Non-quitters smoked an average of 26.66 (22.60–30.73) cigarettes/day compared to 23.43 (19.62–27.25) in quitters. After the follow-up, quitters stopped smoking before the second visit, and non-quitters, on the other hand, cut their daily average cigarette use down to about half to 12.37 (9.52–15.52) per day. Quitters’ median carbon monoxide level after the follow-up was 2 ppm, average level was 2.22 ppm.
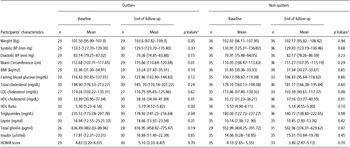
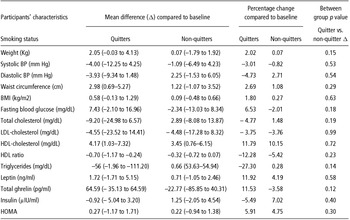
Table 1 shows the average waist circumference, blood pressure, fasting blood glucose, HDL-cholestrol, triglyceride, weight, BMI, LDL-cholesterol, HDL/Total cholesterol ratio, total serum ghrelin, leptin, insulin concentrations, and HOMA scores before and after the follow-up in quitters and non-quitters. The average difference and percent of change compare to the baseline after the follow-up are shown in Table 2.
Comparing within group difference in quitters and non-quitters in the end of follow-up

Notes: Independent t-test, comparing quitters difference (Δ) to the non-quitters.
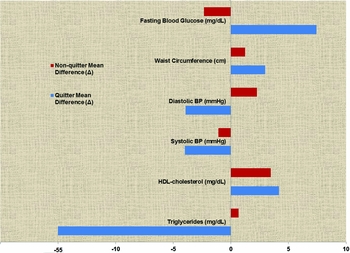
Compared to their baseline pre-quit values, subjects in the quitter category had increased average waist circumference by 2.98 cm (0.69–5.27, p = 0.01), and HDL cholesterol 4.17 mg/dl (1.03–7.32, p = 0.01) Figure 2. The weight increased 2.05 kg (–0.03 to 4.13, p = 0.05), but was marginally significant. The HDL ratio decreased 0.70 (–1.16 to –0.24, p < 0.01) as did the triglyceride concentration by 56 mg/dl (–111.2 to –1.96, p = 0.04).
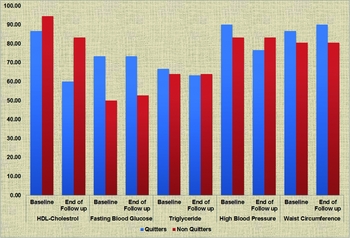
As shown in Figure 1, prevalence of the individual components of the MetS demonstrated quitters with increased prevalence of elevated waist circumference of 2.33 %, prevalence of reduced HDL cholesterol of 26.67%, and triglyceride was 3.34% less prevalent among quitters. Based on changes of the MetS component after quitting, four subjects no longer had MetS with an overall decrease in MetS prevalence of 13.33% (McNemar's test, p = 0.05). There were no significant changes in blood pressure, fasting blood glucose, total cholesterol, or LDL cholesterol. For non-quitters, HDL cholesterol concentration was also increased 3.44 mg/dl (0.82–6.06, p = 0.01) (Tables 1 and 2). However, as an assessment of the individual component of the MetS, the presence of the reduced HDL cholesterol was also decreased 11.11% among non-quitters. The changes of HDL ratio, waist circumference, triglyceride, weight, blood pressure, fasting blood glucose, total cholesterol, and LDL concentration were not statistically significant.
MetS component factor prevalence at baseline and after the follow-up.

Mean MetS component factor difference after the follow-up compare to the baseline.

For intermittent quitters, LDL cholesterol decreased –19.82 mg/dl (–35.5 to –4.16, p = 0.02) and weight was increased 2.90 kg (0.32–5.48). The changes of HDL cholesterol, HDL ratio, waist circumference, triglyceride, blood pressure, fasting blood glucose, and total cholesterol concentration were not statistically significant. The prevalence of MetS after the follow-up were not statistically significant for both non-quitters and intermittent quitters. There were no significant differences within group hormone concentration changes for both quitters and non-quitters. There were no significant differences in mean differences (delta) in serum leptin, total ghrelin, insulin, and HOMA.
Two Quitters and six non-quitters started statin therapy during the follow-up. After excluding statin users, the trend was similar for quitters. The quitters mean waist circumference increased 3.33 cm (0.8–5.85, p = 0.01), HDL increased 4.86 mg/dl (1.68–8.05, p < 0.01), HDL ratio decreased 0.66 (–1.15 to –0.17, p = 0.01), fasting triglyceride decreased 65.71(–122.37 to –9.06, p = 0.02) Overall the MetS prevalence decreased 14% (McNemar's test, p = 0.04). The changes in weight, blood pressure, fasting blood glucose, total cholesterol, LDL, mean MetS components in quitters were not statistically significant. For non-quitters, the mean change of weight, waist circumference, blood pressure, fasting blood glucose, HDL ratio, and total cholesterol, LDL were remained not statistically significant. Mean HDL difference only increased 2.75 mg/dl (0.1457–5.6524, p = 0.069) and was not statistically significant.
The trends were similar for the veterans with diabetes. Diabetic veteran quitters waist circumference increased 5.09 cm (2.01–8.18, p < 0.01), HDL increased 4.40 mg/dl (0.81–7.99, p < 0.01), HDL ratio decreased 0.89 (–1.66 to –0.11, p = 0.03). The change of weight, blood pressure, fasting blood glucose, total cholesterol, fasting triglyceride, LDL cholesterol, and MetS prevalence in diabetic quitters were not statistically significant. In diabetic non-quitters, HDL ratio decreased to 0.81 (–1.53 to – 0.08, p = 0.03), and that was the only significant difference for the group.
To examine and evaluate the overall impact of stopping smoking classes and treatments on MetS subjects, without stratifying based on smoking status, we compared all 95 subjects after the follow-up data to the baseline. At the end of the study, average waist circumference for all subjects increased 2.5 cm (0.81–3.30, p < 0.01), average weight increased 1.58 kg (0.37–2.79, p = 0.01), HDL cholesterol increased 3.19 (1.27–5.10, p < 0.01), HDL ratio decreased 0.49 (–0.78 to –0.20, p < 0.01), LDL cholesterol decreased 9.78 (–18.46 to –1.10, p = 0.03). The changes in blood pressure, fasting blood glucose, total cholesterol, triglyceride, ghrelin, leptin, insulin concentration were not statistically significant. Fourteen subjects, compare to the five at the baseline, no longer had MetS and the prevalence of veterans with MetS decreased 10% (McNemar's test, p <0.01).
Although significant within-group differences were observed among the quitters after the follow-up, differences that occurred in quitters were found to be not statistically different from non-quitters (Table 2). In the end of the follow-up, when within-group differences in quitters were compared to non-quitters, waist circumference was 1.78 cm (1.56–5.13, p = 0.29) larger, weight was 1.98 kg (–0.74 to 4.7, p = 0.15) heavier, mean HDL cholesterol was 0.72 (–3.32 to 4.76, p = 0.72) higher, HDL ratio was 0.38 (–0.98 to 0.21, p = 0.23) lower, blood sugar was 10.17 (4.78–25.13, p = 0.18) higher, triglyceride was 57.26 (–133.2 to 18.69, p = 0.14) lower, total cholesterol was 12.09 (–30.51 to 6.32, p = 0.19) lower, systolic blood pressure was 2.91 (–12.26 to 6.43, p = 0.53) lower, diastolic blood pressure was 1.38 (–7.81 to 4.57, p = 0.54) lower, leptin level was 1.02 (–2.6 to 4.81, p = 0.58) higher, ghrelin level was 87.36 (–24.53 to 199.3, p = 0.12) higher, insulin level was 2.17 (–7.28 to 2.94. p = 0.40) lower, HOMA score was 1.13 (–1.02 to 3.28, p = 0.3) was higher than non-quitters. Despite slight differences above, no single difference above was statistically significant. As a group, the changes occurred among quitters were not different from the non-quitters.
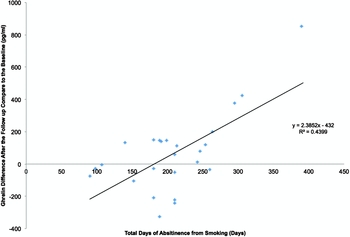
In order to investigate if the cumulative change in smoking usage could have predicted the level of change in MetS component factors after the follow-up, we performed simple linear regression analysis between MetS and hormone difference (delta) before and after the follow up, and the total duration of abstinence from smoking. There was a moderate association between quitters’ differences in ghrelin with duration of abstinence (R-squares was 43.99, and p < 0.01), around 43.99% of ghrelin differences were predicted by the duration abstinence. Therefore, as the smoking cessation duration increased, ghrelin level increased among the quitters (Figure 3). When used all samples without stratifying based on smoking status, there was a weak association between change in ghrelin (delta) and duration of quitting smoking (R-squares 11.63, p < 0.01). Other MetS component risk factors, leptin, insulin, and HOMA differences (delta) were not found associated with duration of quitting smoking (R-squares were < 0.5 and p > 0.05).
Linear regression between ghrelin difference after the follow-up compare to the baseline and total duration of abstinence from smoking.

The weight and waist circumference among quitters were significantly increased at follow-up as quitters mean weight gain was 2.05 kg (–0.03 to 4.13, p = 0.05), median was 4.5 kg. Mean waist circumference increased 2.98 cm (0.72–5.45, (p = 0.01), and the median at 3.08 cm. Although not statistically significant, mean fasting blood glucose among quitter was increased to 7.69 (–2.17 to 17.55, p = 0.12). To determine if weight gain caused by quitting smoking was associated with an increase in blood glucose, we performed simple linear regression analysis and Pearson correlation coefficient. For both quitters and non-quitters, R-squares were <0.01 (quitter p = 0.62, non-quitter p = 0.63), and no linear relation was found for both groups. For both quitters and non-quitters, there were no statistically significant correlation between the differences of weight and blood glucose (quitter: r = 0.18, p = 0.35; non-quitter: r = 0.08, p = 0.64) and the differences of waist circumference and blood glucose (quitter: r = –0.01, p = 0.94; non-quitter: r = –0.09, p = 0.61). We found no clear association between smoking cessation and increased weight gain and blood glucose increase among the quitters.
Consistent with previous studies, we found a positive correlation between serum leptin and body weight at baseline (r = 0.56, p < 0.01). Quitter weight differences after the follow-up were positively correlated with the differences in leptin (r = 0.37, p = 0.04), HOMA (r = 0.39, p = 0.04), and insulin (r = 0.54, p < 0.01). For non-quitters, weight differences after the follow-up were positively correlated with differences in HOMA (r = 0.36, p = 0.03), and insulin (r = 0.36, p = 0.03). Weight differences among the non-quitters were not correlated with leptin concentration changes (r = 0.11, p = 0.53).
No significant correlations were found between ghrelin and weight at the baseline (r = 0.01, p = 0.91) and the changes in plasma ghrelin were not correlated with changes in body weight in either quitters (r = 0.13, p = 0.52) or non-quitters (r = 0.08, p = 0.64).
Discussion
The effects of smoking on the cardiovascular system are complex and are thought to be in part related to effects on the endothelial lining. Our study, in concert with earlier epidemiological studies, has suggested that smoking may increase risk by a unique effect to increase the incidence of MetS. This is supported by our findings that cessation of smoking for just six months decreases the prevalence of MetS by 13%. Consistent with previous reports, quitting smoking significantly increased HDL concentrations by 12% and HDL ratio decreased 12%. The fasting triglyceride concentration decreased 24%. The combination of these changes resulted in a decrease in the prevalence of MetS.
Weight gain and increasing abdomen size are the most daunting complications of stopping smoking. Consistent with previous studies, quitter's weight increased 2.02% and waist circumference increased 2.64%, which might attenuate some of the beneficial effects of stopping smoking. This once again signifies importance of diet and weight control during the stopping smoking process to maximize the benefits.
The changes in ghrelin were moderately positively associated with duration of quitting smoking. The longer the duration of quitting, the greater the increase in ghrelin. The increase in the weight was significantly correlated with the increase in both insulin and insulin resistance (HOMA) in quitters and non-quitters. The changes in the weight in quitters were positively correlated with changes in leptin. Despite those correlations, increased body weight, and increased waist circumference, there were no significant changes in ghrelin and leptin concentrations after quitting smoking. Our study differs from earlier studies that reported that stopping smoking was associated with increased leptin and decreased ghrelin concentration. This difference could be due to differences in sample size, assay performance, or weight changes after quitting. We did not see significant changes in fasting insulin, blood glucose, and HOMA score, hence no significant change in insulin resistance. Aside from the imperfect measurement of HOMA, our result could be due to increased body weight and visceral fat increase that counteracted positive benefits of stopping smoking. As one-third of our subjects had diabetes, insulin concentration is generally not a good indicator of insulin resistance and therefore may have confounded interpretation.
The positive health effect of decreasing daily cigarette use or quitting intermittently was inconclusive. As MetS and individual MetS component factor prevalence did not change in these groups, our finding strongly argues for complete cessation of smoking to achieve benefits in cardiovascular risk reduction.
Surprisingly, fasting HDL concentration was also increased 10.2% in non-quitters category. However, after adjusting for statin use this increase was non-significant, as these drugs do increase HDL cholesterol. Although previous studies have showed increased risk of diabetes with stopping smoking, our study demonstrated no significant fasting blood glucose increase in quitters or diabetics despite weight gain. This finding may indicate an improvement in insulin sensitivity that we could not determine using the HOMA model.
The diabetic veteran group demonstrated a significant intragroup increase in HDL cholesterol and the largest decrease in HDL ratio. As we assume this group has the highest concentration of insulin resistance, it suggests that smoking cessation may have a greater benefit in this high-risk group. As we could not demonstrate a reduction in insulin resistance with HOMA, we cannot specifically implicate an increase in insulin sensitivity in the change in HDL.
All subjects were counselled to stop smoking and given smoking cessation medications regardless of study group status or duration of study participation. Complicating our analysis was the fact that non-quitters quit an average of 9.88 days and cut down their daily cigarette use about half resulting in a possible bias towards the null and leading to an underestimate of the relative risk. This may explain the lack of intergroup differences between quitters and non-quitters. A relatively high but expected drop out rate, small sample size, and lack of power is the major limitation of this study and diminished the chance of finding significant differences between groups. These limitations may also apply to the largely exploratory analysis of ghrelin and leptin which revealed no significant changes.
Despite these limitations, our study suggests that smoking may in part increase cardiovascular risk by changes in the individual risks for MetS and hence increase the prevalence of MetS. Whether the presence of this syndrome contributes to increased cardiovascular risk independent of the individual risks is controversial. Our average quit period in this study is around six months and benefits of quitting smoking could be potentially greater after extended period of abstinence. Larger cohort studies with extended duration are required to assess the potential differences of MetS risk factors and long-term effect of stopping smoking.
Our finding that quitting smoking had a significant effect on increasing HDL cholesterol is significant in that low HDL cholesterol is the most prevalent risk factor among subjects with MS. The specific adverse effects of smoking to lower HDL may in part be one of the important mechanisms for the development of ASCVHD realized in cigarette smoking. The actual molecular mechanism involved in how cigarette smoke components lower HDL is unknown but may provide insight to the role of environmental regulation of HDL and attributable risk for vascular disease.
Our study adds to the growing literature on the additional and potentially unique risks of smoking and the benefits of complete abstinence as the important intervention to decrease overall ASCVHD burden.
Acknowledgment
We wish to express our sincere thanks to Dr Linda H. Ferry for wholeheartedly supporting our project. We are extremely grateful and indebted for her valuable guidance and encouragement extended to us. We also take this opportunity to thank all members of the VA Loma Linda tobacco-dependence treatment program including Anna Cortez, James Hahn, and all of the study participants.
Financial support
The Jerry L. Pettis Memorial VA Medical Center Research Funds (AFF) and Loma Linda University (ST) supported this research.
Conflict of Interest
None
Ethical Standards
All procedures performed in studies involving human participants were in accordance with the ethical standards of the Loma Linda VA research committee and with the 1964 Helsinki declaration and its later amendments or comparable ethical standards.