


The Chairman (Mr D. C. E. Wilson, F.I.A.): I am delighted to introduce Michael Sanders. He is going to share his thoughts on data science, how data science can be relevant to policy-making and the role actuaries can play in data science.
Michael has been a thought leader on this issue. He is the Chief Scientist of the Behavioural Insights Team, where he heads up research evaluation and social action. He designs and analyses randomised control trials (RCTs) and uses quasi experimental methods and data science. His activities support government in making public services more cost-effective and improving policy outcomes through creating better models of human behaviour.
Some of those projects have helped to increase tax payments, reduce prescription errors, increase fine payments and encourage people to give more to charities.
The team has shown on many occasions how data science is relevant to public policy and how it can make people’s lives better.
He is also an Associate Fellow of the Blavatnik School of Government at the University of Oxford where he teaches behavioural science and policy; an Affiliate of the Harvard Behavioural Insights Group and he teaches field experimental design at the University of Bristol.
Michael holds an MSc in Economics and Public Policy and a PhD in Economics, both from the University of Bristol. His PhD research focused on the application of behavioural science to charitable fundraising. He has previously taught public policy analysis at the University of Bristol and has worked as a teaching Fellow at the University of Bath. He has completed post-doctoral research at the Harvard Kennedy School of Government.
In his lecture, Michael will explore the relevance and importance of data science for making public policy and the role of actuaries.
Mr M. Sanders: I should like to take the opportunity to acknowledge James Lawrence, who is our Head of Data Science at the Behavioural Insights Team, as well as Daniel Gibbons and Paul Calcraft, who do all the work that I am about to present.
I am not an actuary. I am an economist by training.
I am going to talk about the Behavioural Insights Team, the organisation that I work for, what it is that we do, and how it is that we have gone from behavioural science to data science in terms of the work that we do, and how we are looking to apply data science. I will talk about how we might think about applying data science, both in public policy and also more broadly, touching on the work that you all do as actuaries and the ethics around that.
The Behavioural Insights Team was set up in 2010 under the then Coalition Government of the Conservatives under David Cameron and Nick Clegg, who was the leader of the Liberal Democrats. We were the first government institution dedicated to applying behavioural science to policy. When we say “behavioural science” what we mean is behavioural economics and psychology. When we think about psychology, the mental image we probably put together is somebody sitting and saying, “How are you feeling? Tell me about your mother,” and why exactly is it that has a role in government. David Laibson, who is a professor of behavioural economics, said that the reason why psychology historically has not played a big role in policy-making is that while it is okay for the President of United States to have a Council of Economic Advisers, if we were to say the President of the United States has a Council of Psychological Advisers, it makes you think he might be a little bit unhinged.
Why do we think that we need behavioural science in politics? Why do we think psychology plays a role? I am now going to ask you all to play a game.
You are all going to have to invest some money in a bundle of stocks. You have a series of options. You are not allowed to pick the S & P 500 because that is boring; but you can choose any of the other ones: power, trade, fortitude, alpha investments or tobacco investments. I would like you to raise your hands, looking at the Figure 1 investment choice which is of returns over a nine-year period. Who wants to invest in power trade investments?
Investment choice.
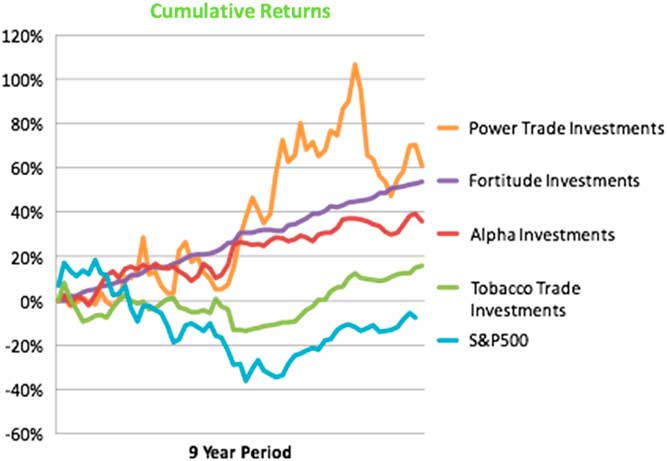
Nobody. A gentleman here. You love volatility. Good.
Who wants to invest in fortitude?
Almost everyone. I am going to assume nobody wants to invest in alpha or tobacco. Who thinks that it is possible for a trade to beat the market systematically over a 9-year period with no volatility?
Some of you do. Those of you who do not, everybody who voted for fortitude, voted for Bernie Madoff’s fund.
Those of you who kept your hands up when I asked if you did not believe that the market could be beaten systematically with no variance over a 9-year period, you knew you were making a mistake and you still did it.
Despite the fact that I am looking at an audience of incredibly well-educated people who understand how risk works, many of you voted for what was obviously not a real fund because funds like that cannot exist. They are unicorns.
Essentially, because of the way that I framed the initial question, you chose the investment that seems like the best bet: maximise return/minimise volatility. It makes sense. However, when I asked you if you can beat the market systematically, you responded that you cannot. What I have done is triggered the automatic thinking part of your brain. I have got you to think very quickly about a problem. I framed it in terms of rate of return. You have all gone for the natural answer.
This is what economists would call a cute problem. I have an audience who were not really expecting it.
However, this is not a real-world problem; it does not matter at all. However, what we do see – and this is the reason economists did not like us when we came into government originally – is we have a series of cute tricks. What we do see, however, is this has profound implications for the way people choose to save for retirement; the way they purchase investments; the way that they purchase insurance; the way that they make decisions whether or not to pursue education, and a whole range of other areas. What we have done over the course of the last 7 years is not just design interventions used in psychology, but also to test them. What we have done is about 400–500 RCTs. There is no reason why psychology RCTs in government and psychology and evidence-based policy-making need to be linked, but they have become intrinsically linked in the minds of many policymakers.
My boss, David Halpern, and I come from a world where you have rigorously to test things in order to have any kind of credibility. We try to bring that with us.
There was also a lot of scepticism among the public. For example, there is a cohort of young people who get really good grades at school and do not go to university. If they go to university, they go to less good universities than their grades would allow them to. They are typically people from low-income families. They are essentially leaving money on the table. It is several thousand young people a year. We can, through sending them a letter from a student from their background who has gone to university, get them to go to university and we can increase the number of people going to elite universities by about 200 people a year from low-income families. That is non-trivial and it should have substantive impact on social mobility in the future. I hope we have a government in the future that is slightly more representative than people who look and sound almost exactly like us.
We should all agree that that is desirable.
If I tell you that is the case, that one letter can do this for 200 extra people, from one letter sent to 10,000 people, you should be sceptical. You spend your lives being professionals, existing in the world where people say something is true and often it turns out not to be. But your scepticism is as nothing compared to the amount of scepticism that exists in government and exists particularly in the government economic service. The government economic service is the intellectually dominant part of the government. Everybody will announce in a meeting that they are an economist and give you a view. I am economist so I have just done it as well. It gives you credibility. “He understands numbers a bit, and he understands what inflation is, and I am a bit unsure, so this guy seems credible.”
The government of economics is very suspicious of this idea that by doing something other than regulating, giving people information and paying money for stuff, so taxing or spending, you can achieve substantive policy ends. So they are naturally sceptical – and they should be.
There is also a really good reason to be sceptical, which is psychology. The academic discipline that many of my colleagues come from is currently on fire. We have a replication crisis in which a whole series of studies that have been conducted over the last 40 years have turned out not to be true, because studies conducted on 30 female undergraduates at the University of Central Florida do not replicate to larger populations than that. Who knew? If only there was a way we could have seen this coming.
These are the reasons why we focus on evidence and why we do these large-scale RCTs. Many things do not work; but many do work. We have run, as at the end of last year, about 450 RCTs. We have just over a hundred this year so far.
There is also not a natural relationship. If I convinced you that there is a natural relationship between behavioural insights, behavioural science and evidence, there is not a natural relationship necessarily between psychologists and data scientists. So why do we think that there is?
We think about a data scientist. We imagine someone who is either very happy or very eccentric and perhaps a little bit more removed from people.
Our working definition in BIT is: a data scientist is someone who knows more about computer science than your average statistician, and someone who knows more about statistics than your average computer scientist. It is someone who is bringing together these two fields.
You also find in a large number of organisations that a data scientist is somebody who thought that was a cool job title and has a copy of Excel on their computer. So beware of that.
Why do we put these two things together? Perhaps more emotive; perhaps more understanding of human beings than some individual-level studies of psychology and behavioural science. Why do you put that together with data science?
The simple answer is as Richard Thaler said, “we cannot do evidence-based policy making without evidence.” We cannot make policy; we cannot give advice that is good and based on evidence without that evidence; and we cannot have evidence without data. I do not mean data necessarily in the sense of columns and rows in spreadsheets. Qualitative data are still data.
Many areas do not have much data. My wife is a child protection social worker. They are basically in a data black hole. They have tons and tons of text and very little else. That text might be useful, but certainly up until recently it has not been something which we can get traction on in order to make evidence-based decisions in social care.
What do we do in the data science function? We were set up in January, now 9 months ago. That is when James, Paul and Dan joined us. We have 12 months. We have a commission from the Cabinet Office to produce in 12 months data science exemplars that demonstrate the value of data science for public policy. I am basically on a ticking clock. I can hear it constantly.
The goal is to do three types of projects. First, using new tools on old data, things like machine learning which I will talk about in a little bit; Second, using new types of data, things that we did not use to be able to process. When I was training, running a locally weighted regression smoothing plot would take a couple of days on the datasets that I was using. The idea that we could take all of those social worker case notes that my wife writes – 5,000 words typically per child; and she has a caseload at any given point in time of 50 kids – that we could take that and use that in a computer sensibly in order to produce meaningful outputs was laughable. Now it is very, very easy.
The third thing is making RCTs better. RCTs will remain my bread and butter for many years to come because they are the gold standard of evidence-based policy-making. They also, from a statistical point of view, are the simplest ways of getting evidence.
I am going to focus on using new tools and using new data today. Most public policy seems to be where actuaries were in the 17th century.
David Halpern is the national adviser for what works, and he says that we have good evidence, which is to say usable evidence, for about 1% of government spending.
We are still a little bit reliant on anecdote and “Oh well, he is a good sort. We can trust him.” I imagine that is where you were before you discovered that numbers exist.
We are into questions like how “risky is a school or a hospital or a doctor or a child if you are insuring them or if you are running a government department where your job is to try to minimise risk?” Much of that depends on professional judgement.
One area where perhaps some of you may be interested, and where certainly the government is interested, is how do we work out how risky a given driver is? We care about it and obviously you care about it for many reasons.
However, professionally some of you may be interested in caring about it because you work in the insurance business. We care about it because we are generally in the business of trying to avoid people dying in fires, for example. Government has a breadth of activities.
We worked with East Sussex County Council to reduce the number of people killed and seriously injured on their roads, to understand why it is people are being killed and seriously injured on their roads. These rates have been going up in East Sussex, while going down nationally, despite very little change in the collision rates in East Sussex. That goes against the downward trend generally in the country. Any vehicle hitting any other vehicle, any vehicle hitting a person or vehicles hitting trees, and so on count as collisions.
East Sussex is a bit of an outlier. There may be good reasons, for example East Sussex is quite rural, with no motorways there.
What we wanted to do was work out what it was to predict a collision containing somebody who was killed or seriously injured (KSI). We produced two models, one national and one local using what is called stats 19 data. Unlike most other countries, we have a very good amount of data on almost every collision that occurs in the UK because if you crash into something you are supposed to tell someone. You have no legal obligation in New Zealand, for example to tell anybody that you have crashed, even into another person, unless they are injured and need to go to hospital or are killed.
In East Sussex, we have all these rich data which we get from policemen’s notes and so on. What is it that predicts deaths or serious injuries? We went into some of the initial hypotheses that we obtained from people who are interested in road safety in East Sussex.
“Occupational journeys are big problems. It is not people in cars, it is people driving lorries and vans. They cause all the deaths.” That turns out from our analysis not to be true. Also, “it is not from people round here not local people who cause accidents, it is people from far away.”
As it turns out the occasional person who drives through East Sussex is not typically causing that many deaths. Most of the KSIs are locals occurring on narrow rural roads. The fact that there are not any motorways is causing the problem and that seems to be the case we get from the model.
The majority of the factors that explain the difference between an accident in which nobody is KSI and those accidents in which people are KSI are behavioural factors. It is what the drivers are doing in the seconds or moments before they crash. About 31% of the predictive value of our model is in that. Motorcyclists are a high-risk group nationally but they are particularly a high-risk group in East Sussex, perhaps because they cannot be on motorways, and so we can quantify that they are about 26 times as likely for a given amount of miles to cause an accident.
So motorcycles are dangerous. Young people are more likely to cause accidents. Old age pensioners for each mile driven, or for each licence issued, are not that dangerous, perhaps because they drive incredibly slowly. Even if they are involved in collisions, perhaps because they are low-speed collisions, they tend not to lead to people being injured although they are more likely to be victims. What we do find is that if you are in your early 40s, and if you are in a collision, you are much less likely to be causing an accident that is fatal for somebody else, or at least somebody else being seriously injured than if you are later than your 40s. It seems that when you hit about 45, you lose patience with the world, you put your foot down, you just want to get to wherever it is in East Sussex you are going, and you are just more likely to kill people. If you are 45 to about 55–60, while driving through rural roads in East Sussex you are between 10% and 20% more likely if you are in the collision to kill somebody than you were a few years ago.
The major findings from our model are that cars interacting with vulnerable road users are a big problem and the 40- to 55-year-olds are more likely to kill people than other people are, including killing young people driving a motorcycle.
Some of the other things we have been working on have been about inspections. Inspections are most useful when we are identifying areas for improvement. State inspections are carried out by bodies such as Ofsted, the office for standards in education, the schools’ inspectorate and the Care Quality Commission, which is the healthcare facility inspectorate. People who work in the institutions they inspect are typically not delighted to hear that they are turning up. However, we all recognise inspections are a good thing if we are able to and do detect things that are failing before bad events occur. These inspections are more useful when they are targeted.
We start by identifying all GP practices and look at health care. Then we are going to move on to schools, which are likely to fail a subsequent inspection.
For GP practices, we can take data and train the machine learning algorithm, in this case a gradient boosted tree, to identify practices which have succeeded in the past, so they have a good or an outstanding record in the past in their inspection but they are likely to fail next time.
What we use for that is publicly available data from the Care Quality Commission, which is the healthcare inspectorate. We also take in characteristics of the patients, which is from the publicly available Health and Social Care Information Service and contains the age ranges of patients, their health characteristics, their gender and that kind of thing. We are including where they are in the country, because that might be relevant. The interesting information, where we are getting extra value, is in datasets we could not have processed previously.
We look at prescriptions data. Every GP in England and Wales and every single thing they prescribe is on the Internet. I can tell you that if you have a 30-pack diazepam that this GP prescribed these many units of it in this month. If you have a 15 pack of diazepam I can see how many of those are prescribed. We do this analysis for all kinds of things. We did it recently for a trial trying to combat antimicrobial resistance, which could ultimately kill us as a species if nuclear war does not.
All of that data exist and are an enormous dataset. It is 5GB of data and it is a wonderful example of government transparency both in so far as it is on the Internet and because it is almost entirely unusable, because it is structured in exactly the opposite way you would structure it if you wanted to use it for anything.
In my team, we have only had the technology to use these data, and to twist it into the shape we would like it to be in, for about a year and a half.
We are also looking at NHS Choices information. If you go to your GP practice and you decide that you are not pleased with the care you receive, or if you are pleased you can go on to NHS Choices. It is like Trip Advisor but for doctors. You can say: “I saw Dr Smith today. He was great. He gave me all the drugs I wanted.” Or, as is more common, you complain about Dr Smith’s receptionists.
We gather all of this data off of the Internet and use that in our analysis. We “scrape” or clean some data to be more useful as shown in Figure 2.
“Cleaned” text.
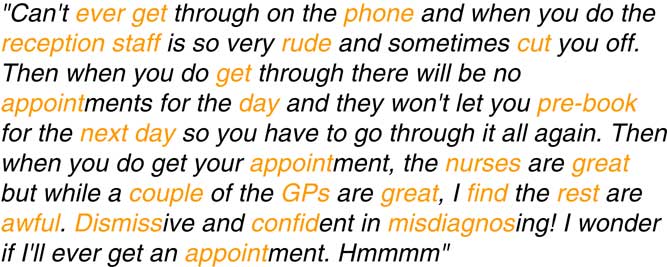
We get reviews that look like this. We could use that but it is probably not a good idea. It will give us an answer but that answer would not be useful because we could only throw unsupervised learning at that.
So what we do is clean the text and then we find things that are reasonably common, so a word that only appears once is not actually that useful for prediction because it is either perfectly predictable or not predictable. We take out all of the words that you can see in orange. After cleaning the data “misdiagnosed” becomes “misdiagnosis.” We think these are broadly similar. We do not care about the difference between them. We have about 195 word stems resulting from this process. We put that as well as the prescription data and the practice characteristics data into our model. We are going to use a standard gradient boosted tree, which is like a normal decision tree; but where it fails it goes back and tries again so we end up with many little trees built on top of each other but it looks a little bit like (Figure 3).
Example tree.

So, what do we find? We find that text is the most predictive factor for our model. These are reviews data. What the patients are telling us in more or less real-time is happening in practice.
Demographics are important. If you are a certain type of person living in a certain area, then you are probably getting a poor quality doctor.
The clinical indicators, which the Care Quality Commission (CQC) are using, are not as predictive as they might be. This could be because the CQC are deliberately not putting on the Internet for us to find the actual thing that they are using to target their inspections. If they did that doctors would take advantage of it. I am not going to give you too much detail on prescription data for reasons which will become apparent in a moment.
For prescription data some things that we thought were really important are not important at all; and some things that we had not thought of are surprisingly important.
One of the items I am going to show you is the gain curve (Figure 4). As we move from left to right on a gain curve, we are conducting more inspections. As we move from bottom to top, we are capturing more of the practices that are going to go from good to failing. We want it to be as far above the diagonal line as we can. That is the blue line. The one you can see on the left is good and one on the right is less good. If your model is appearing below the diagonal line, you have over fitting, and you will do better by only inspecting places at random.
Gain curves and predictive power.

You can see in Figure 5 what our gain curve looks like for predicting “requires improvement” or “inadequate” practices from ones which were “good.” We can substantially beat the CQC’s model, based only on the data they make publicly available. I do not know what the actual model is. If we inspect about 30% of practices, which is about what the CQC can expect, then we can find just over 50% of the practices that are going to fail, which means that we are beating what would be random chance where we would get 30% of the failures, which is pretty good.
Accuracy (fail = inadequate + RI).Notes: While the CQC currently inspect about ½ their clinics each year, they want to cut this level of inspections down now that they are reconfiguring their system, so we have chosen 30% as a cutoff.
We did fit a model with text only, but it does worse than the CQC model.

That would allow us to target inspections and use our resources more effectively and perhaps target those resources in the practices that are most likely to fail so we can help them to improve. That is what we do with CQC.
We also do this for Ofsted, the school inspectorate, and again we are targeting places that got good last time to see whether they fail next time around. Most of them do not. We are not doing this so we can be punitive to teachers and schools. After Ofsted inspections take place and schools fail, schools usually get better because of the intervention they receive and the support that they received after the inspection.
We are looking at the school Workforce Census that tells us who is working in a school, what they are qualified to teach, how long they have been teaching to a certain extent, and also whether or not there is a lot of “cycling through,” that is staff turn-over. We are looking at that census data; we are looking at the information on the school type and obviously previous inspection, which is pretty predictive, and we can also look at the finances of the school, so where the money comes from and how much money they are spending, and we can look at performance data, which is to see how well students are doing in school.
We use gain curves. Many people presenting their results of algorithms will tell you that it is X percent accurate, and say, for example that it is 95% accurate. But if I am trying to predict a variable, say, maleness in this room, I could predict all men, and I am going to be more than 50% accurate.
I can be very accurate if I am predicting something that has a very high incidence. Most schools that were given a good inspection last time will get a good inspection next time, because there is something good about them.
If my predictor model just says every school that passed last time, passes next time, 76% of my algorithm is going to be accurate, even if it is not an algorithm. What is evident here is we can predict school failure of inspection much more readily than we can detect the failure of GP practices. So we can predict about 65% of failures from about 10% inspection. If we have a 20% inspection rate we can detect 87% failure, which is substantial. This work is carried out on held out data, so I am validating it to make sure that I am not just spuriously saying that I can predict things really well.
Those are a few examples of the things that we can use data science for. The big question that we then have to ask ourselves is: then what? We organised a conference on data science and government a year or so ago. We had an amazing speaker, who has looked at the geographical spread of people who tweeted hashtag cats for Hillary versus hashtag cats for Trump. Statistically that appeared clever, but did not tell us what to do next, or who was going to win the election. Certainly, his analysis pointed in a direction, as did everyone else’s analysis, which was not the direction that we ended up going in.
The question is what do we do now? How are we supposed to think about these things? The first thing that we have to do is to beware of what we call the narrative klaxon. My colleague, Alex Gyani, who heads our research team in our Australia office, has one of these air horns now. You hear it occasionally in our office because he periodically dials in. I can say: I find that the number of units of diazepam that a GP prescribes is really predictive of GP practice failure. That is because GPs who prescribe lots of diazepam are more likely to be lazy or maybe they are older; in other words I try and attach a narrative to the finding and data. There is no reason to try to do that and it may be actively harmful. But there appears to be a series of correlations. There is no causal analysis here. We have to resist the natural urge as human beings to try to attach a narrative to every single thing the data tells us.
The second thing that we need to do is to be very cautious about gaming. If you imagine that I have just told you that the number of units of diazepam a GP prescribes is the thing that is going to predict best them failing in the next inspection, even though this is not based in fact or findings. I then tell doctors that, and I also tell doctors that the CQC is basing their inspection on only this algorithm next time, what is every doctor going to do? They are going to prescribe less diazepam because nobody wants to be inspected.
As soon as I tell you what I would see behind the prediction or curtain, people will start gaming it, which is the next thing we need to worry about. How do we maintain the integrity and the fidelity of our models as we move through life without giving it away, and also being transparent at the same time? That is a serious problem that we are likely to run into in the next few years as people want to know what is going on in their algorithm. Any GP could afford to hire somebody to run our model on their practice and work out how risky our algorithm thinks that they are and what they would have to do in order to make it seem less risky in the data. People can always start gaming these things almost as soon as we get them going. Because we are not looking at causal relationships, there is nothing that fundamentally ties the number of doses of diazepam prescribed or the practice list or any of these things to the outcome measures; these are all correlations. They can become untethered as soon as somebody knows that they are the things that we are using to target our inspections.
The other thing we need to worry about is practitioners. I have focused on things that we can do to target inspections. However, we are currently working on a project to help predict decision-making failures by social workers. Social workers work out which cases are most likely to require no further action, so we say they are low risk. But some cases end up coming back as high-risk cases quite soon afterwards. So we can try and take remedial action sooner rather than later.
In order to address these issues, we need to develop and get social workers to use algorithms and to be informed by these. There is algorithm aversion where people do not want to be told what to do by an algorithm. They do not want to say: you, sir, are wrong; this machine – which workings you cannot see, and I will not tell you how it works because I am worried that you will game it – can do the job better than you. No one wants to be told that.
How do we get practitioners to use these tools? This becomes a behavioural science rather than a behavioural science problem. The best statistics in the world, which practitioners are not buying into, are useless. It is a box that sits in the corner, which no one ever turns on, or feeds into so no one learns from it. That is a serious problem.
A lot of the work planned over the next 2 years, is going to be a challenge for a lot of scientists to try actively and substantively to alter the world rather than just describe things that happen on Twitter with cats. How do we put this in the hands of people who should be able to use it in a way that they use it well?
Finally, there are ethical concerns in using these techniques, many of these are about privacy and data security.
So far we have looked at using publicly available data, that the government has already put onto the Internet, and we are looking at professional behaviour, and have already signed up to codes of conduct and practice and who are basically paying us to do something.
We could, however, look at individuals. We could look at the obesity crisis. We could say that we want to predict who aged 18 is going to go from being very thin and having all of their hair to being obese and having none of their hair. In terms of predicting health insurance premiums, pensions and all the rest of it, actuaries care who is going to become fat and unwell. We could start gathering data, for example when someone signs up for a health insurance plan or for a pension, we could ask “Who has a Fitbit? We will give you a little bit off of your insurance premium if you give us access to all of your Fitbit data.” They do not know really what they are giving you.
I have access to my own Fitbit data. I have access to everybody in my company’s Fitbit data. I can tell you almost everything. If I was able to identify who was who, I could tell you what happens after the Christmas party based on sudden spikes of activity from two Fitbits that are co-located.
The things that you can get from these data that people are unknowingly giving you are astonishing.
If we are going to be thinking about actually predicting for people who are actually making your jobs easier and my job easier, we need to get much more data from them. We need to think about the ethics of taking something from somebody that they can consent to, but are not meaningfully consenting to if they do not know what data they are giving you. That may place a burden on us to do something.
We often think about whether or not data is destiny. If you go back to our Ofsted report, my old school turned out a very, very high-risk factor. I knew this about 8 months ago when we started doing this data work. Should I call up Ofsted and say: Ofsted, please inspect immediately “This is a school that means something to me,” or should I give them a call and say: I know about teaching, not in schools because I teach adults, but I know something, how can I help? Please let me be useful.
Should I call them and say: by the way, you guys have a 90% chance of failing your next inspection?
If I do that, what do I expect them to do? If I tell you that you have a 90% chance of failing the next inspection because of some product of an algorithm with 5,000 components to it, what are you supposed to do? How are you supposed to act on that? You cannot.
My school actually went into special measures. I knew in advance that that was very likely to happen. Clearly whatever I did was not the right thing as the school went into special measures: a new head; many teachers leaving; and parents pulling their kids out of school and moving them elsewhere. That is going to place burdens on other schools nearby in terms of class sizes. This is problematic.
Whatever I have done, it was not the right thing. Could we have intervened? Could we have stopped it? Could we say that this person when they are 18 years old has a high-risk factor for becoming obese because of what we know about their current Fitbit activity, about everything about them, everything about their parents. Do we have to accept that? Do we have to say: okay, what we will do is just increase the insurance premiums from now on? Should we give them probably a cheaper pension because they are not going to get there? Do we do that or do we do something else? I do not understand how. Is that basically what you would do?
Is there something that we can do about that? We are moving from a world which is the one we get taught about in first-year microeconomics, where I have much more information about my characteristics than you do. You are a principal, I am an agent, let us say. I am trying to sell you my services on the job market. I am telling you that I am brilliant but I know that I am mediocre. You cannot assess me from somebody else. You cannot tell the difference between me and somebody else who graduated from the same university so we have the pooling of risk. Then you have to take a punt.
We move from that world where you have no information about my health other than what I tell you, and I can choose not to tell you that I smoke; I can choose not to tell you that I drive a motorcycle although maybe I would void the policy; but certainly there are things that I can conceal from you that are relevant.
We are now moving into a world where the tables are turned. If I give my health insurer information on my health history, access to my Fitbit, access to the little red light on my Fitbit that captures my blood pressure and everything else, then my private information is worth less than the information that you guys have. You guys actually know me better than I know me. So in a world before where the advantage in the game was with the player, with the person who was trying to get insurance, trying to get a pension, because they had the private information, then it is appropriate for there to be, for want of a better phrase, rent seeking on the other side of the equation. Because it is a market.
In a world where you know when I am going to drop dead, and when the government knows when I am going to drop dead better than I do, do we then have a moral duty as actuaries, as public servants, to tell people and try to make them better rather than just taking the information as we have and use it for the purposes that we have already used it for?
I do not know what is incumbent on us. I do not know what the answer to that question is. What I propose is a deliberative forum; this is what we have done in the past trying to test out new things in behavioural research on the edge of appropriateness; a good example of this would be sugar taxes; taxes on sugary drinks and what is an appropriate level to charge?
How much do people think it is okay for the government to intervene on the food that people are eating and drinking?
Rather than just nudging people, we brought together a whole bunch of people from broadly representative society and we paid them a bit of money to spend time learning about it. We gave them lectures; we gave them reading material; we check that they were engaged; we checked that they were engaging; and we checked that they were picking up the facts.
Then we asked them: what do you think? What is an appropriate level for a sugar tax in drinks? You get together a bunch of people, some fat; some thin; some rich; some poor; some well-educated; some less well-educated. You actually find out what they think. It allows you to come to a conclusion: where does that moral incumbency lie? What should the government be doing try to protect people and what should they not be doing to try to protect people? At what point do we have to allow people to make their own mistakes?
The same question is for insurance companies. What do they have to do? What should they be doing? Should they be telling people: you are a very high-risk person and advising some things that you could reduce the risk? Or do they not have to do that?
So, I believe that we will have to have these discussions in order to assess what society thinks our incumbency is. For a government we should be intervening everywhere because government is good at intervening. Nobody ever said: do nothing. The question always is: what can we do?
For the private sector, similarly. Maybe the default setting of some employers is that you should do your jobs and actually fixing problems is not your job. Maybe some people think that, I do not know. We are not going to come to the right answer by ourselves. We are going to require people outside who have not perhaps as much expertise as we do but have much more interest in the outcome.
That is what I propose, a deliberative forum to answer these questions. I am not advocating, however a referendum.
The Chairman: Thank you, Michael, for a fascinating lecture. You have given us a lot of food for thought with some fascinating examples, particularly on the ethics front.
Dr L. M. Pryor, F.I.A.: I was very interested in some of your comments on ethics and how difficult it all is. Something that struck me is that you said how difficult it is for people to give informed consent about the availability of their data. That is probably particularly difficult because allowing one bit of your data to be used by somebody may not actually be very helpful to them or very bad for you.
If you give lots of different permissions, for all sorts of different data, then it becomes much more of a problem. So, how would you characterise this aspect that it is not a single one by one decision, it is the sum total of your decisions that makes the difference?
Mr Sanders: That definitely is an issue. Every single attack on my privacy almost, every single data selection, happens a couple of dollars at a time. A good example of this is the unified Facebook log on, which you can use to log on almost everything. Facebook knows who I am friends with and when my wife puts photographs and everything that happens in my life onto the Internet. I log into Ocado using Facebook. My Fitbit data are attached to Facebook as is my in home Fitbit scale. Facebook knows everything that I eat and drink inside the home; it knows how much I weigh and how much I exercise.
Again, there is not an easy way around that. In addition, Facebook are also monitoring my browser history and I end up buying products via Facebook.
It is probably an insoluble question except to find a way of making it visible to people in small numbers and then limiting the ability of Facebook to do this kind of thing or limiting what they can use it for. We could impose legal restrictions on Facebook, like not getting the Fitbit data and the weight data, and Ocado data. We could impose legal restrictions to the extent that they can merge datasets. Government activity is hamstrung constantly by the laws that we have created to prevent ourselves from bridging one dataset to another. That seems like probably the most sensible approach we can go with, providing statutory restrictions. One of the things we have learnt from behavioural science is people are not capable of processing large quantities of complex information. This is a very large amount of very complex information and it is not fully understood.
At the time when you are consenting to it, and when Facebook added the ability to login to your Fitbit using Facebook, they did not know what they were going to use it for. It is difficult for them to ask my permission for some future use.
Probably, new laws are very appropriate but also a deliberative forum with someone telling me whether I am right or wrong.
The Chairman: Let me start with one of the questions that has come through on twitter. This was in relation to something that you mentioned around the possibility of people gaming the algorithms once they knew enough about them.
The question asks: surely gaming can be in the public interest where it encourages positive behaviour?
Mr Sanders: Absolutely. A good example of this is also research by Deborah Wilson, Rebecca Allen and Simon Burgess. The Welsh government decided to get rid of school league tables. The argument was teachers said we need to get rid of league tables because they encourage gaming and so Deborah Wilson, Rebecca Allen and Simon Burgess looked at what happens to grades in schools, not just in the things that are measured but across other things as well as Ofsted inspections, in other words a holistic view. Not just the five-star A to C category that goes into league tables, but everything else that the school does, what happens after you abolish league tables.
It turns out that in Wales, after league tables were abolished grades get worse and behaviour gets worse in schools. Ofsted inspections are failed more often because, as the teachers were saying, the teachers were gaming the league tables. Unfortunately, gaming the league tables looks quite a lot like teaching. There are some types of gaming we do want to encourage and there are other types that we do not. It is difficult to tell whether or not one instrument is going to be gamed well and one is going to be gamed badly.
However, when you have a complicated process like one of these algorithms where you have hundreds of components to it, people will typically find the path of least resistance for the gaming, so in order to avoid inspection, in order to avoid failing, they will probably try to change the things that do not cost them anything to change rather than changing things that are hard to change.
I would imagine that if we say that one of the things that predicts a good school is how many board markers they buy to, say, imagine a causal chain. The narrative klaxon goes off.
If you buy more board markers it means the teachers are really energetic with their writing and that is a one thing with some predictive power and so is the amount of money you spend on after-school clubs.
If I tell you that those are the two things which will mean your school is less likely to be inspected if is likely you will spend more money on after-school clubs or board markers. You will probably buy more board markers!
So, there is good gaming and there is bad gaming and you probably want to be selective about what it is that we release.
Question from the audience: I have a question about paradigm shifts. What I was struck by was that you had stated that you wanted this narrative-free representation of your conclusions. I wanted to parallel that with similar movements in machine learning and also perhaps what is happening in mathematics. There is actually a term called “equation-free solution” for problems.
The question is to what extent do you take part in a paradigm shift within your community?
Mr Sanders: It seems like it would be grandiose of me to say I was taking part in a paradigm shift.
There does seem to be a change happening. In economics, we have a move towards theory-free things. Partially a reflection of the rise of machine learning and economics, but also partially a reflection of empirical economics taking control and us being less concerned with the minutiae of preferences and more with what people actually do.
I hope I am not part of a paradigm shift that looks like that. The things that are legitimately narrative should not be narrative-free. We should not give up on the quest for narratives.
In the example I gave you of the children’s social care data analysis that we are doing, my colleagues James Lawrence, Dan and Paul have built an algorithm that allows us to predict these failures of decision-making with reasonably good accuracy. We have some things that are reasonably predictive and some things that are not. I cannot say X causes that because of Y.
That is a problem because if we do not know what the causal relationship is, it is difficult to design interventions to solve that problem.
The end of that project is when we get our gain curve and we see what is happening, and then all is handed over to our colleague Jess Heal, who is a sociologist. She is the head of qualitative research, and she and her team go and interview social workers. They interview children in care and they interview parents: they are trying to develop hypotheses to enable them to rule out some things because there is no hypothesis there that makes sense and they are trying to form a theory off of the back of insight from data.
You form that theory. If you have a theory that the board markers are really effective, there is an actual causal relationship between the number of board markers because if there are tons of board markers available teachers are not wasting time looking for them – let us say that; a sort of a scarcity argument, so no board markers is bad – you form the hypothesis, it is a good hypothesis. Then what you can do is you can say we have a hypothesis that having lots of board markers is good. We think that will cause something else, and then the next thing to do is to hand it back over to me and mine and the behavioural insights people and say: okay let us design an intervention where we solve this scarcity problem by just buying tons of board markers because we now think we have a causal hypothesis about what leads to that.
Then we should run a RCT in which we give half of the schools a ton of board markers, and half of them we do not, and we actually find whether the hypothesis is true.
Within any given discipline it is fine for us to be having a paradigm shift instead of moving towards or away from narrative. However, overall, the paradigm shift that I am hoping we are going to see over the course of the next 20–30 years of my career is away from the distinction between different disciplines: I am a data scientist. I do data science over here and I just put that out to the world. But actually we need a much more joined up process. For want of a better phrase, less siloing across academic disciplines, so that we can actually start to take insights from one place and move them into another, and then move them into another.
Once we have got results or a good RCTs, we can throw that back into algorithms and try to repredict whether or not there are particular types of school for which the intervention works better or less well.
The paradigm shift should not overall be a move towards a narrative-free analysis, but towards a more inclusive model of research.
The Chairman: You raised questions about the ethics, particularly insurers, of capturing data from Fitbit and the like. What should they do with it? Somebody on Twitter is asking for some answers on that. What are the implications?
There is another question: is there a role for insurers to intervene if a policyholder is identified as high risk over and above the deterrent of high premium?
Mr Sanders: The history of the world, which is marked with periods of unpleasantness, certainly from a very egocentric point of view, is characterised by people telling others that we have the answers and we know what is best for them.
More recent history, it looks like people from my discipline engaging with governments along the lines “do not worry, economics has fixed everything.” Then Northern Rock fails, then Lehman Bros fails and recessions set in, which we had reliably assured the world would never happen.
There are not any clear answers, so I will not be drawn there.
In terms of do we have a responsibility, my answer on that is we should be intervening. We have carried out some experiments using Fitbits to try to get people to do more exercise. We have built a platform based on our research, which we are working with insurers and other companies on to try to encourage people, who have higher risk profiles, to do more exercise and be healthier.
The question is not should we intervene but how to. Telling people they are higher risk probably does not do anything. Over 50s are now invited every 5 years to have health checks on the NHS. NHS take blood pressure and tell you you have a 4% chance of getting diabetes at some point in the next 20 years. You say: 4%? That is nothing. They do not report it distributionally and say you are in the top 1% of risk factors with a 4% chance because you are 50 and relatively healthy.
What we have learned from the health checks, which have been reviewed is that they do not work. Telling people how risky they are does not work. The question is: what can we do to make it better? I do not have the answer to that. It seems that there are things we can do to get people to get fitter or healthier and be more energetic.
There is a role for insurers there. There is an interesting question about the role for government in that which could be around trying to create an environment where the incentives of insurers are not just to charge higher premiums, but to actually make their customers healthier.
Mr I. J. Rogers, F.I.A.: Picking up on that last point about the potential desire of government to legislate to prevent the potential abuse of access to large datasets by organisations. That in itself raises an interesting ethical question about whether the risk of allowing private sector organisations to merge datasets and to derive insights potentially for profitable purposes outweighs the risk of losing those potentially useful correlations if such activity is prohibited, and government could potentially be destroying potential future values of humanity by preventing it happening in the perfectly laudable aim of trying to avoid immediate harm.
Do you have any thoughts on how to balance that one out?
Mr Sanders: It is a very difficult thing to balance. Legislation is quite a blunt tool. You always run the risk of running down the line where you are cutting off some benefit to some people to prevent harm from coming to other people.
It is a difficult issue to balance.
There is potentially, not in legislation, but in statutory instruments and secondary powers. In the digital economy, there is a power being awarded to the National Statistician John Pullinger to certify that some organisations are working in the public interest or working for good. So you could see that being used.
You could also see, as we see in the smart meter market, the use of derogations. Derogation is when a partial exemption to a law is made possible, typically by action of a Secretary of State or a Minister. You could have a derogation where you say to Facebook, “you have all this data. We have said you are not legally allowed to use it. What is the problem you are trying to solve? Then we will give you a six-month period for 100,000 of your customers where you can see whether or not machine learning actually can achieve that. Then you come back to us. If you can do that, then we will make the derogation permanent and larger.”
To the extent that that derogation, specifically for one firm or another in a competitive marketplace, would give a firm a competitive advantage, then what you are essentially doing there is creating a pseudo-market administered by a Secretary of State and you are creating a pseudo-market for public good innovation in data science.
It is a little bit clunkier than Wild West capitalism where everyone can do what they want and we hope that Mark Zuckerberg is a good guy and everybody working for him is as well. It feels like a potential way round it. Obviously, this is not a statement of government policy. I do not know what the thinking about that is. This is just an off-the-cuff response to your question.
The Chairman: In your research, and in your team’s work, have you gained any insights that might help to solve the problem of under-saving for retirement or indeed saving at all?
Mr Sanders: We have not done any data science work on saving. David Laibson, Brigitte Madrian, James Choi and John Beshears are doing work on increasing saving in the United States.
On the behavioural science side, there is the foundation work in applying empirical behaviour in economics around saving behaviour The biggest example of this is use of defaults to encourage saving. We have NEST in the UK and we have a growing number of opt out 401 K plans in the United States. That is the simplest thing that we can do.
We are reasonably good at getting people to save relatively small amounts more for retirement but not to get them to the stage where they are actually saving enough. Almost nobody in the developed world is. It feels as though all of the progress we have made in getting people to save more is simply taking the decision out of their hands and relying on automatic processes like opt-outs, which is a partial answer to your question.
The Chairman: Another question that has come through on Twitter. You talked a bit about public information versus private information. The question is around the predictive power, whether there is any more predictive power in private information versus public information.
Mr Sanders: It depends on the dataset.
The Chairman: The subsequent part of the question is: what factors does this depend on?
Mr Sanders: There are some areas. At the moment we have done a piece of work on predicting the failure of care homes for the elderly.
What we find is the publicly available data is much less predictive than it is for GP practices, partially because people are not going on line to leave reviews of their care home.
My colleague, Michael Luca, who is at Harvard Business School, does a lot of work on predicting inspections in the United States, typically in private sector environments. He is considering predicting restaurant food hygiene ratings, using data from Yelp and Trip Advisor. It varies from city to city how effective that is.
In New York and Los Angeles it seems as though everybody who goes out for dinner immediately goes on Yelp “excellent, five stars” or “terrible, four stars.” Nobody ever gives a one-star review. This is heavily censored.
In that case, the public information, the stuff that is not held by the Food Standards Authority equivalent, is of very high quality in those cities.
In places like Chicago, people are not leaving these reviews. So it is of very little additive value.
The fact of the matter is whether people are providing their data. I have a Fitbit. Are you happy to provide data from my Fitbit for the last 6 months because I am not wearing it so the data from that is useless?
If we have passive data collection, are people actually allowing you to passively collect data from them? In some cases they are; in some cases they are not. We then run into a risk about the value of our algorithm.
You might offer me very high insurance premiums for my health insurance or very low premiums, depending on how your algorithm is treating the fact that I am not providing you with any data. As to giving you information, it looks like it is information because an algorithm cannot tell me whether or not doing zero steps a day for the last six months is because I left my Fitbit in a hotel room and forgot to go and pick it up. It cannot tell you that, because I am clumsy or because I am basically dead and have not moved for six months, you should offer me a very cheap pension or very expensive life insurance.
Data quality is the thing, and probably the richness of data. So it is breadth rather than necessarily the number of people.
The Chairman: One thing which struck me about data when you took us through your example about driving in East Sussex is you mentioned that there is a lot of data on every accident that happens.
One of the things that actuaries learn a lot about when they start their training is the so-called exposed to risk. Getting data on all the trips that people do which do not end up in accidents is much harder.
Mr Sanders: That is why we are predicting death or serious injury on being in a collision because we cannot see how many cars are on the road. So the population you are sampling from is probably the biggest limitation of your ability to predict.
Mr A. Burnett, MSP: I am a member of the Scottish parliament. My question focusses on gaming, good gaming and bad gaming. You talked about doctors who might employ people to analyse the data.
Would behavioural science not lead you to think that those who were self-analysing were going to be improving? Would that not be a good thing?
Mr Sanders: That is unclear. It is probably going to have mass points at either end of the distribution. If you think about people who file their tax returns exactly on time: these are people who are really diligent and who want to make sure that they are paying all of their tax.
The other people who fill in their tax return exactly on time are Amazon and Al Capone; people who are trying to obey all the rules and people who are trying to obey none of the rules are people who try and game the system. It is sometimes very difficult to tell which one of them is which.
Miss C. H. Midford, F.F.A.: Coming back to the ethics point, you talked about protecting people from themselves through legislation, and so on. That assumes a benign regime.
What about the possibility that we cease to live in a benign regime? If I have given up lots of information and say have done lots of kosher shopping in Europe in the 1930s I might not have seen what was going to happen but it could have been used against me. What can be done to protect against things like that, for example forced anonymisation of data, and when does it then become the responsibility of the individual for people doing work like yourselves because the regime is no longer benign?
Mr Sanders: That is an important question and a very difficult one
My sense is that anonymisation is difficult. We can anonymise data really well if we want to strip out all of its usefulness. The more you make it, the easier it is going to be for someone with malign intent to stitch it back together again to work out who it is that they like or do not like.
Probably the solution I slightly favour is having automatic destruction of data after a certain period of time baked into the hardware. So if I give the government – broadly defined – access to identifiable data about me through my Fitbit and all the rest of it, all of the components of that data that make it identifiable and hence useful are automatically erased at reasonably brief intervals.
It makes it much harder for people like me to do research. This is very much in the domain of ethics, morality and law, and I am not speaking as an expert here.
If you were to make it that data would automatically be destroyed at fairly frequent intervals or at least anonymised to the point where it is no longer useful, then you could try to prevent the data that were historically given to a benign force being subsequently used by a malign force to take control of that entity. If you were to look at it from a governmental point of view, you might say that one of the things that happens at the beginning of purdah – the period we have before elections during which government is not really allowed to do anything – the thing that we are allowed to do is to set fire to all of our servers. We destroy all our data so that the next government is not given access to a whole bunch of useful things for malign purposes. However, that would be an enormous constitutional issue. As well as not being an actuary, I am also not a lawyer – certainly not a constitutional lawyer.
The Chairman: A quick follow up Twitter question: could increased cyber security issues lead to changes in behaviour and less sharing of data?
Mr Sanders: To the extent that people are aware of them, yes. If people are very concerned about what their data are being used for and where it is going and the risk of civil servants leaving laptops on trains or companies being hacked, then you could start seeing people making changes in their behaviour. People’s trust in government declines immediately after people leave laptops on trains, people have a flight to safety away from the company that has just been hacked to other companies, which is entirely irrational because after you have hacked that company, you are unlikely to go and re-hack it. Probably that is the only safe company.
At the moment, effectively the shocks appear to be reasonably transitory. We have not seen a culture shift. If we were to see a culture shift against data sharing then we would end up having a public discussion probably, as a few people have mentioned, about whether or not we are comfortable sharing the data and what are we getting out of it.
When I give Facebook the login to my Ocado, what I am getting out of that is convenience. I am happy to do it now when I think Facebook is secure but may not be happy about it if Facebook becomes insecure.
However, I may also make the trade-off that actually if Julian Assange really wants to know how many courgettes I buy, I do not really care. I care if he gets my account details where he can buy his own courgettes.
If we have a broad cultural awareness of cyber security, you could see a change. However, David Halpern is on record as saying the response of the average person to a large change in government policy or legislation would deeply affect their life in myriad untold ways. So maybe; maybe not.
The Chairman: You have given us an awful lot to think about here, Michael. There were things that we did not have time to get into around some of the judgements around the data that gets used in the first place, which is something actuaries will have been thinking a lot about in insurance for a long time.
In terms of the output, you also gave us quite a lot to think about in terms of the idea about resisting narratives and actually trying to impose too much model on what the results were actually telling you.
Thank you particularly for a fascinating presentation.


 Open access

