Introduction
The ice- and vegetation-free surfaces on the Transantarctic Mountains (TAM) are some of the most pristine geologic surfaces on Earth (e.g. Sugden et al. Reference Sugden, Denton and Marchant1995). These landscapes contain a wealth of information regarding the underlying geology of the Antarctic continent, including the long-term evolution of landscapes in hyper-arid and hypo-thermal environments and the physical erosion and chemical weathering of lithologies in the absence of pervasive biological activity, serving as a unique control for understanding the biological impact on surface processes everywhere else on the Earth. As a result, these locations have been attractive destinations for geologists since the earliest continental Antarctic expeditions in the early 1900s (e.g. Taylor Reference Taylor1914).
Synoptic-scale geologic mapping of the TAM was completed at a scale of 1:1 000 000 in the 1960s (e.g. McGregor & Wade Reference McGregor and Wade1969), with additional 1:50 000 geologic maps produced for the McMurdo Dry Valleys (MDV) by the New Zealand Institute of Geological and Nuclear Sciences (e.g. McElroy & Rose Reference McElroy and Rose1987). These maps, as well as more than 140 additional data sources, were included in the most recent 1:250 000 quarter-million map (QMAP) series of the MDV published by the New Zealand Institute of Geological and Nuclear Sciences (Cox et al. Reference Cox, Turnbull, Isaac, Townsend and Smith Lyttle2012). This comprehensive digital mapping product synthesizes previous mapping efforts and localized geologic studies throughout the MDV into a single consolidated repository.
Unfortunately, geologic mapping is typically performed at coarse spatial scales, grouping local heterogeneities and geologic diversity into broad lithologic units. Bedrock geology is often the primary focus of these maps, while surficial deposits are seldom discussed in detail. For these reasons, traditional geologic mapping is commonly inadequate when studying local geochemical trends and surficial processes.
Multispectral datasets obtained using orbital instruments can provide high-resolution (up to 1 metre per pixel, or m pix-1) compositional information of the uppermost surface over large geographical expanses. Variations in the physical properties and composition of a surface will influence the resultant spectral signatures by changing the reflection or emission of electromagnetic radiation at different wavelengths. Visible/near-infrared (VNIR) reflectance and thermal infrared (TIR) emission spectroscopic techniques have been utilized in geologic investigations of both terrestrial and planetary surfaces. Recently, such compositional remote sensing techniques have been applied to the MDV (Salvatore et al. Reference Salvatore, Mustard, Head III, Marchant and Wyatt2013a).
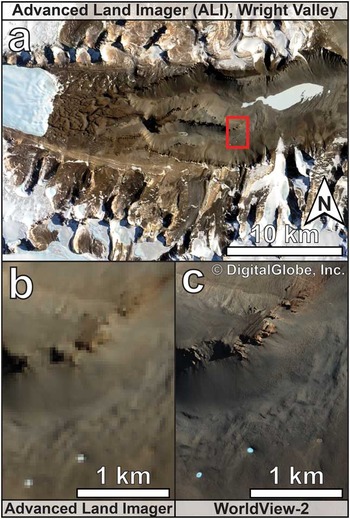
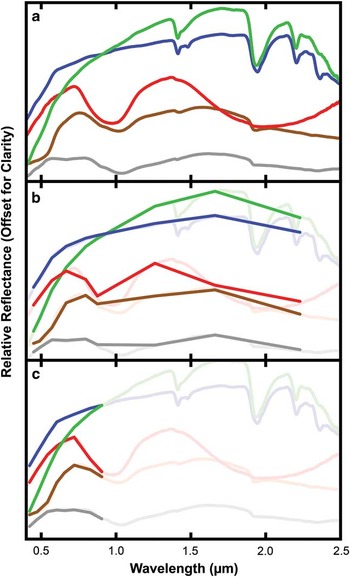
Salvatore et al. (Reference Salvatore, Mustard, Head III, Marchant and Wyatt2013a) were the first to show the utility of multispectral compositional mapping in the MDV and focused on primary igneous and secondary alteration signatures associated with the Ferrar Dolerite. However, this study utilized multispectral datasets with spatial resolutions on the order of tens of metres, precluding outcrop- and field-scale geologic investigations (Fig. 1) (Salvatore et al. Reference Salvatore, Mustard, Head III, Marchant and Wyatt2013a). The WorldView-2 (WV2) satellite, launched and operated by DigitalGlobe, is capable of multispectral (eight band) imaging at a spatial resolution of roughly 2 m pix-1, which has an areal spatial resolution roughly 225 times greater (as compared to 30 m pix-1) than the VNIR imaging datasets used in Salvatore et al. (Reference Salvatore, Mustard, Head III, Marchant and Wyatt2013a). The spectral range of WV2 is 0.427–0.908 µm and does not include longer wavelength imaging capabilities that were pivotal in the surface–atmosphere separation algorithm developed by Salvatore et al. (Reference Salvatore, Mustard, Head III, Marchant and Wyatt2013a) (Fig. 2). Therefore, the effects of this limited wavelength range on atmospheric removal are currently unknown.
Comparison of the spatial resolutions of orbital multispectral datasets. a. A contextual true-colour image of Upper Wright Valley by the Advanced Land Imager (ALI) instrument. The red box indicates the location of b. and c. b. A demonstration of the 30 m pix-1 spatial resolution of ALI near the eastern edge of the Dais. c. A demonstration of the 2 m pix-1 spatial resolution of WorldView-2 data. WorldView-2 image WV02_10NOV052052194_1030010007BD3000.

Comparison of the spectral range and resolution of a. laboratory visible/near-infrared measurements, b. the Advanced Land Imager and c. WorldView-2. The limited wavelength range of WorldView-2 presents uncertainty in both the atmospheric correction techniques as well as the unique identification of surface compositions. Original spectra are from Salvatore et al. (Reference Salvatore, Mustard, Head III, Marchant and Wyatt2013a).

The goal of this study was to apply the techniques used in Salvatore et al. (Reference Salvatore, Mustard, Head III, Marchant and Wyatt2013a) at broad spatial scales to these new high-resolution data from the WV2 sensor to provide outcrop- and field-scale geochemical information throughout the TAM, complementing traditional geologic mapping techniques and providing valuable high-resolution resources for deep field geologic and biological investigations. Hyperspectral laboratory reflectance measurements of samples from the MDV are utilized to verify and guide our remote spectral characterization and parameterization (Fig. 2). Using these methodologies, similar spectral mapping techniques are applied to the remote central TAM (CTAM) region surrounding Shackleton Glacier, which is the location of the proposed 2015–16 deep field logistics hub co-ordinated by the National Science Foundation (NSF). The efficacy of the hybrid dark object subtraction and regression (DOS-R) atmospheric removal algorithm (Salvatore et al. Reference Salvatore, Mustard, Head III, Marchant and Wyatt2013a) was also explored, utilizing multispectral data with limited long wavelength capabilities. This study shows that remote geologic investigations are possible using the WV2 sensor and subtle geochemical signatures can be measured, which complement traditional geologic mapping, field work and laboratory analyses. These data provide synoptic and consistent coverage over the entire TAM using resources currently archived by the NSF. The WV2 dataset also provides spatial and compositional context for traditional field investigations, which aids in maximizing the scientific and logistical efficiency of field work in these remote locations.
Methods
Utilizing WV2 data for geologic investigations requires the calibration and conversion of these data to a geologically applicable format. Reflectance measurements of rocks, minerals, materials and landscapes have been obtained and extensively studied for decades for comparison to remote spectral datasets. For direct comparison to laboratory measurements and to previous studies, WV2 data must be converted to atmospherically corrected surface reflectance. This technique and the rationale behind the derivation of surface reflectance are described in the following section. In addition, the comparison of these remote data to laboratory-derived reflectance data, and the methodologies behind these laboratory measurements, are described below.
WorldView-2: conversion to top-of-atmosphere spectral radiance
The WV2 data were obtained from the Polar Geospatial Center (PGC) at the University of Minnesota. First, 16-bit data were converted from a radiometrically corrected digital number (DN) to radiance derived from the top of the Earth’s atmosphere (W m-2 µm-1 sr-1) using the following equation (Updike & Comp Reference Updike and Comp2010):
 $${\rm L}_{{\rlambda \{\rm P,B\} }} =({\rm q}_{{\{ {\rm P},{\rm B}\} }} {\times}{\rm K}_{{\{ {\rm B}\} }} )/(\Delta \rlambda _{{\{ {\rm B}\} }} ),$$
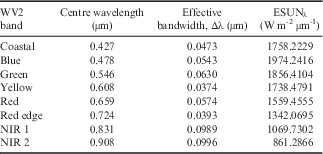
where Lλ{P,B} is the spectral radiance of a given pixel {P} in a given band {B} at the top of the Earth’s atmosphere (W m-2 µm-1 sr-1), q{P,B} is the radiometrically corrected 16-bit data for a given pixel {P} in a given band {B}, Κ{B} is the absolute radiometric calibration factor (W m-2 sr-1 count-1) for a given band {B} and Δλ{B} is the effective bandwidth (µm) for a given band {B}. The absolute radiometric calibration factors are provided in the metadata for each image (termed ‘absCalFactor’) and represent the relative spectral radiance response for that given band (Updike & Comp Reference Updike and Comp2010). The effective bandwidth of each WV2 band is provided in Table I.
Centre wavelength, effective bandwidth and ESUNλ values for each of the eight multispectral WorldView-2 (WV2) bands. Data retrieved from Updike & Comp (Reference Updike and Comp2010).
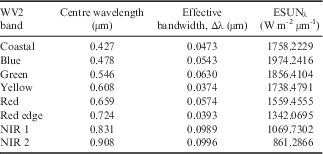
NIR = near-infrared.
WorldView-2: surface–atmosphere separation: dark object subtraction and regression
Due to the lack of real-time weather information, the frequent spatial and temporal heterogeneity of weather conditions and the increased contributions from atmospheric scattering (due to the high latitudes and, hence, low solar elevations) throughout the TAM, traditional atmospheric correction methods using radiative transfer modelling (e.g. MODTRAN; Kneizys et al. Reference Kneizys, Shettle, Abreu, Chetwynd and Anderson1988) have been shown to be largely ineffective (Salvatore et al. Reference Salvatore, Mustard, Head III, Marchant and Wyatt2013a). Salvatore et al. (Reference Salvatore, Mustard, Head III, Marchant and Wyatt2013a) utilized a hybrid DOS-R technique to atmospherically correct VNIR data in Antarctica. This technique derives an atmospheric spectrum from each scene using localized shadowed areas. Top-of-atmosphere radiance data are obtained over a range of illumination conditions along topographical slopes and in shadowed areas. Data from each band are plotted against the last spectral band (0.908 µm) and regression lines are fitted to derive the y-intercept, where the contributions from direct solar illumination are assumed to be zero. Using this technique, the contributions of atmospheric scattering are derived for each band and subsequently subtracted from each pixel, resulting in atmospherically corrected surface radiance (W m-2 µm-1 sr-1) values.
Two major assumptions are made when applying the DOS-R technique to remove atmospheric contributions. First, atmospheric scattering is assumed to be negligible in the last spectral band. When using Advanced Land Imager (ALI) data, whose last spectral band is located at 2.215 µm, Salvatore et al. (Reference Salvatore, Mustard, Head III, Marchant and Wyatt2013a) showed that atmospheric scattering is less than 0.1 W m-2 µm-1 sr-1 in shadowed regions and consistent with the 0.03% scattered radiance predicted by Rayleigh scattering. However, because the last WV2 band is located at 0.908 µm, Rayleigh scattering predicts that 1.1% of downwelling radiance is scattered at this wavelength. The potentially incomplete removal of scattered atmospheric contributions could influence the overall magnitude of calculated reflectance values, but this probably has little effect on the derived spectral shapes or resultant calculation of spectral parameters.
The second assumption is that the surfaces used to derive the scattered atmospheric contributions are compositionally homogeneous. Compositional diversity within the area used for atmospheric correction would result in poor spectral relationships and significant inter-band variability, resulting in an incorrect proxy for atmospheric contributions. However, this assumption can be typically avoided by deriving spectral parameters (discussed below) from the spectral radiance values prior to the derivation of atmospheric constituents. A lack of variability observed in the spectral parameters would indicate a similar lack of compositional variability.
The incomplete removal of atmospheric contributions, or the erroneous modelling of atmospheric scattering, can result in derived surface spectral signatures that are not indicative of the actual surface compositions. For example, because atmospheric scattering is more prevalent at shorter wavelengths than at longer wavelengths, minor imperfections in the atmospheric removal algorithm could result in over- (or under-) estimating the influence of ferric absorption features at short wavelengths relative to the ferrous absorption features at longer wavelengths. Other atmospheric removal techniques that can be applied to the WV2 dataset to prevent these types of errors include in situ ‘ground truthing’ using portable field spectrometers, which derive the spectral signature of surfaces from the ground where atmospheric components can be directly removed through the measuring of reflectance standards. Laboratory measurements of Antarctic samples can also be used to approximate the spectral signatures of different surfaces, although these pure spectral endmembers may not be representative of the mixed surfaces observed at the scale of the orbital measurements. Furthermore, these laboratory measurements do not preserve the textural, slope and azimuthal properties of the surfaces under investigation, making such measurements only semi-quantitative in nature. However, in remote regions these laboratory measurements are extremely valuable checks on scene-derived atmospheric removal techniques.
WorldView-2: conversion from surface radiance to surface reflectance
Following the subtraction of the derived atmospheric scattering spectrum from the top-of-atmosphere radiance data, surface radiance values are converted to surface reflectance using the following equation (Chander et al. Reference Chander, Markham and Helder2009):
 $${\rrho _{\rlambda }} =(\rpi {\times}{\rm L}_{\rlambda } {\times}{\rm d}^{{\rm 2}} )/({\rm ESUN}_{\rlambda } {\times}{\rm sin}(\rtheta_{{\rm s}})),$$
where ρλ is the surface reflectance (unitless), Lλ is the spectral surface radiance (W m-2 µm-1 sr-1), d is the Earth–Sun distance on the date of acquisition (astronomical units), ESUNλ is the mean exoatmospheric solar irradiance at each wavelength (W m-2 µm-1) and θs is the solar elevation angle (degrees). The θs values are provided in the metadata of each WV2 image, d values for each day of the year can be found in table 6 of Chander et al. (Reference Chander, Markham and Helder2009) and ESUNλ values are provided in Updike & Comp (Reference Updike and Comp2010; listed in Table I). With the derivation of surface reflectance, WV2 data can be directly compared to reflectance measurements of relevant surface materials measured in laboratory settings, assuming all calibration and correction methodologies are sound.
Laboratory measurements of Antarctic samples
Rock and sediment samples from the MDV were collected during the 2009–10 and 2010–11 summers for the purposes of ground truthing remote spectral datasets. These samples were measured using both the Brown University Reflectance Experiment Laboratory (RELAB) and a FieldSpec-3 portable VNIR spectrometer (developed by Analytical Spectral Devices) in a laboratory configuration described in Salvatore et al. (Reference Salvatore, Mustard, Head III, Marchant and Wyatt2013a). Bidirectional reflectance was measured in RELAB between 0.32 µm and 2.55 µm at a 5 nm spectral sampling interval using a photomultiplier and InSb detectors (Mustard & Pieters Reference Mustard and Pieters1989). FieldSpec-3 measurements were obtained using an external light source and a bare fibre optic configuration, and calibration was performed using a Spectralon white reference calibration target. Both RELAB and FieldSpec-3 measurements were performed with illumination and emergence angles fixed at 30° and 0°, respectively.
Additional spectral measurements were made of lithologic samples from the CTAM region. These samples, which are currently stored at the United States Polar Rock Repository (USPRR) at the Ohio State University, help to characterize the true lithologic diversity observed throughout the TAM and allow us to qualitatively assess the performance of atmospheric separation techniques in regions where in situ surface calibration is not currently possible. These samples were measured using a FieldSpec-3 portable field spectrometer under the same observation geometries mentioned above.
Spectral parameterization
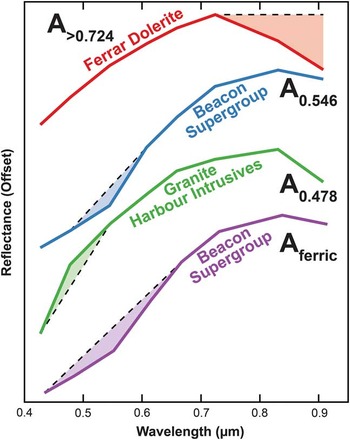
Analysis of the spectral signatures measured under laboratory conditions reveals a wealth of lithologic and spectral diversity observed throughout both the MDV and the CTAM regions. However, when the data are degraded to the spectral resolution of the WV2 bandpasses, the spectral diversity between lithologies becomes more difficult to identify (Fig. 2). This is particularly true for lithologies that are compositionally similar, yet geologically diverse. For example, granites, granodiorites, gneisses and schists are difficult to distinguish spectrally because their mineralogy is essentially identical; the same can be true for sedimentary rocks. As such, deriving spectral parameters that can unequivocally identify unique lithologies using only eight spectral bands is not feasible. Fortunately, some broader trends can be identified and exploited based on previous field and laboratory experiences and, when applied to remote data, appear to accurately identify major lithologic groups. Four such parameters that have been proven successful in identifying compositional variations are described below, in addition to our interpretation of why these parameters are successful (Fig. 3). These parameters include one that measures the presence and strength of a mafic absorption feature, two that measure the shape and structure of the short wavelength ferric iron absorption feature and one that measures the overall magnitude of the ferric iron absorption.
The four spectral parameters for WorldView-2 data defined and utilized throughout this manuscript. Dashed lines represent calculated continua lines, while filled areas represent the spectral features being measured.

First, igneous compositions associated with the Ferrar Dolerite and the Kirkpatrick Basalt exhibit a strong spectral downturn at wavelengths beyond 0.724 µm. This absorption feature is indicative of Fe2+ present in the M2 co-ordination site of pyroxenes, resulting in a crystal field absorption feature centred near 1 µm. In the case of the Ferrar Dolerite, these pyroxenes are in the form of orthopyroxene (opx) (Marsh Reference Marsh2004, Salvatore et al. Reference Salvatore, Mustard, Head III, Marchant and Wyatt2013a). The abundance of opx within these lithologies has been shown to vary substantially and is most enriched in the coarse-grained mafic cores of the lowermost dolerite sills that are exposed in the MDV (Marsh Reference Marsh2004, Salvatore et al. Reference Salvatore, Mustard, Head III, Marchant and Wyatt2013a). The strong spectral downturn at beyond 0.724 µm is unique to these igneous lithologies, visible even when the data are degraded to WV2 bandpasses and parameterized using the following equation:
 $${\rm A}_{{\gt 0.{\rm 724}}} ={\rm 1}-({\rm R}_{{0.{\rm 9}0{\rm 8}}} )/({\rm R}_{{0.{\rm 724}}} ),$$
where A>0.724 is the strength of the absorption feature at wavelengths beyond 0.724 µm, and R0.908 and R0.724 are the measured reflectance values at 0.908 µm and 0.724 µm, respectively. While other mineral species, including amphiboles and phyllosilicates, sometimes exhibit ferrous absorption features at these wavelengths, laboratory measurements have confirmed that pyroxenes are the primary cause for strong absorptions in this region, despite the presence of amphibole-bearing lithologies present throughout the MDV (Salvatore et al. Reference Salvatore, Mustard, Head III, Marchant and Wyatt2013a).
Second, oxidized ferric iron can be spectrally (and visually) identified by the presence of a strong absorption feature at wavelengths shorter than ~0.7 µm, resulting in the characteristic red ‘rust’ colour and caused by an electronic charge transfer between adjacent Fe2+ and Fe3+ atoms (Glasby et al. Reference Glasby, McPherson, Kohn, Johnston, Keys, Freeman and Tricker1981, Campbell & Claridge Reference Campbell and Claridge1987). This absorption feature was shown to dominate the spectrum of fine-grained doleritic clasts upon extended exposure to the hyper-arid and hypo-thermal Antarctic climate (Salvatore et al. Reference Salvatore, Mustard, Head, Cooper, Marchant and Wyatt2013b). This absorption is also observed to be much weaker in coarser and more opx-enriched dolerites, probably due to their greater susceptibility to physical erosion through aeolian abrasion, freeze–thaw cycling and salt wedging (Marchant & Head Reference Marchant and Head III2007, Salvatore et al. Reference Salvatore, Mustard, Head III, Marchant and Wyatt2013a). These processes prevent rock surfaces from chemically weathering for extended durations and limit the development of this strong absorption feature at short wavelengths.
Sedimentary rocks associated with the Beacon Supergroup have also been shown to exhibit reddening due to iron oxidation (Glasby et al. Reference Glasby, McPherson, Kohn, Johnston, Keys, Freeman and Tricker1981, Campbell & Claridge Reference Campbell and Claridge1987). These studies showed that the causes of this discoloration in sedimentary rocks, particularly hard quartzites, are derived from two primary sources. Staining of iron that is inherent within sedimentary rocks can occur in the same fashion as that observed in the igneous Ferrar Dolerites. Additionally, surface staining can occur through the precipitation of ferric iron-bearing coatings on the surfaces of these lithologies. Regardless of the specific source of this discoloration, sedimentary rocks have been shown to be more susceptible to surface discoloration than coarser grained granitic and metamorphic rocks of the basement complexes because of their hardness and resistance to physical erosion.
In addition to the decrease in reflectance at wavelengths shorter than 0.7 µm, our laboratory measurements also indicate that the shape of the spectrum is diagnostic of lithology. For example, quartz-rich sedimentary lithologies typically exhibit a concave-up shape at these shorter wavelengths, while less quartz-rich granitic and metamorphic rocks exhibit flat or concave-down spectral shapes. While commonly observed throughout the sample suite, exceptions have been found in quartz-rich basement rocks in addition to mafic-bearing sedimentary lithologies. Nonetheless, the overall spectral trends are useful first-order indications of the dominant surface lithology.
We have developed two spectral parameters to characterize the shape of this short wavelength absorption feature. The first parameter assesses the spectral shape near 0.546 µm:
 $${\rm A}_{{0.{\rm 546}}} ={\rm 1}-({\rm R}_{{0.{\rm 546}}} )/({\rm R}^{{\asterisk}} _{\,\ {0.{\rm 546}}} ),$$
where A0.546 is the depth of the absorption at 0.546 µm, relative to a predicted reflectance value at 0.546 µm measured along a linear continuum fit between the spectral values measured at 0.608 µm and 0.478 µm (R* 0.546). Positive parameter values indicate that the spectral shape is concave-up at this location, while negative values indicate a concave-down shape.
The second parameter assesses the shape of the spectrum near 0.478 µm:
 $${\rm A}_{{0.{\rm 478}}} ={\rm 1}-({\rm R}^{{\asterisk}} _{\,\ {0.{\rm 478}}} )/({\rm R}_{{0.{\rm 478}}} ),$$
where A0.478 is the height of the spectral peak at 0.478 µm, relative to a predicted reflectance value at 0.478 µm measured along a linear continuum fit between the spectral values measured at 0.546 µm and 0.427 µm (R* 0.478). Positive parameter values indicate that the spectral shape is concave-down at this location, while negative values indicate a concave-up shape.
In all spectral measurements made in the laboratory, spectral reflectance decreases with decreasing wavelength short of roughly 0.7 µm (Fig. 2). However, the spectral shape in this wavelength region was largely observed to vary with lithology and the above parameters tend to be an effective means of quantifying this variability.
The fourth spectral parameter was designed to identify variations in the overall strength of this ferric iron charge-transfer absorption at short wavelengths. Although it is more sensitive to variations in topography and albedo than those that simply assess the shape of the spectra, this parameter has proven effective at identifying variations in the extent and strength of oxidation signatures.
This spectral parameter fits a linear continuum between reflectance values at 0.427 µm and 0.659 µm, and measures the depth of the absorption feature at 0.478 µm, 0.546 µm and 0.608 µm relative to the predicted reflectance values along this continuum:
 $$\eqalignno{{\rm A}_{{{\rm ferric}}} =\,&(({\rm R}^{{\asterisk}} _{\,\ {0.{\rm 478}}} /{\rm R}_{{0.{\rm 478}}} ){\plus}({\rm R}^{{\asterisk}} _{\,\ {0.{\rm 546}}} /{\rm R}_{{0.{\rm 546}}} )\cr &{\plus}({\rm R}^{{\asterisk}} _{\,\ {0.{\rm 6}0{\rm 8}}} /{\rm R}_{{0.{\rm 6}0{\rm 8}}} ))-{\rm 3}.0,$$
where Aferric is the additive depth of the ferric absorption feature, R0.478, R0.546 and R0.608 are the measured reflectance values at 0.478 µm, 0.546 µm and 0.608 µm, respectively, and R* 0.478, R* 0.546 and R* 0.608 are the predicted reflectance values at 0.478 µm, 0.546 µm and 0.608 µm, respectively, along the calculated continuum.
While countless spectral parameters can be vetted through the laboratory-derived data after resampling to WV2 bandpasses, these four parameters were found to be highly effective at identifying the majority of spectral variability (Fig. 3). These parameters are also rooted in fundamental geochemical and electronic principles (e.g. Burns Reference Burns1993), making their application to remote datasets extremely useful for broader petrological, mineralogical and geochemical investigations.
Results
Chemical and physical characteristics of ice-free surfaces can be investigated following the atmospheric correction and parameterization of these orbital data. In the MDV, these spectral signatures have been validated through field work and laboratory analyses, which can be used to confirm these spectral interpretations. These analyses reveal that i) the compositional diversity associated with major lithologic units is identifiable from orbit, ii) the presence and abundance of pyroxene within the sills of the Ferrar Dolerite can be identified and quantified remotely, iii) intra-lithologic heterogeneities in the spectral dominance of ferric iron oxides is indicative of surface stability and resistance to physical erosion, and iv) the spatial and temporal distribution of algal communities can be mapped based on the unique spectral signatures associated with photosynthetic compounds. These four observations confirm the utility of these remote analytical datasets for the investigation of surface properties and processes in the TAM.
In addition to compositional variability observed between major geologic units, variability within a given lithology can be indicative of both primary and secondary processes. For example, the Ferrar Dolerite has been shown to exhibit compositional and spectral variability as a result of both surface oxidation (due to exposure to the hyper-arid Antarctic environment) as well as magmatic evolution (Salvatore et al. Reference Salvatore, Mustard, Head III, Marchant and Wyatt2013a). Although these resultant compositions are the products of fundamentally disparate geologic processes, both oxidation products and iron-bearing mafic minerals are spectrally dominant in the VNIR spectral region and can be characterized from orbit using WV2. Coloured pigments found in many photosynthetic materials are also spectrally identifiable due to their absorption features present in visible wavelengths.
Lithologic identification
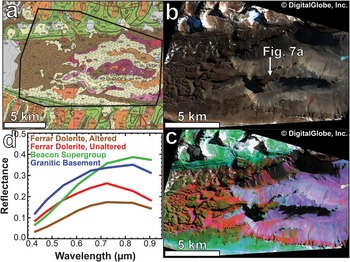
Following conversion to radiance, the implementation of the DOS-R surface–atmosphere separation technique and the conversion to surface reflectance, remotely acquired data can be directly compared to laboratory-derived reflectance data. These techniques and the subsequent results were tested in Wright Valley, which contains a range of lithologic diversity, as well as intra-lithologic variability. When applying the A>0.724, A0.546 and A0.478 parameters to the red, green and blue image channels, respectively, the major lithologic variations observed in this region are clearly highlighted (Fig. 4c).
WorldView-2 (WV2) spectral mapping of Upper Wright Valley and comparison to traditional geologic mapping. a. Geological map from Cox et al. (Reference Cox, Turnbull, Isaac, Townsend and Smith Lyttle2012), with the WV2 study area outlined in black. Sedimentary lithologies of the Beacon Supergroup are shown in green, intrusive dolerites are shown in brown, basement granites are shown in pink and purple, and glacial tills are shown in orange, tan and yellow. b. A true-colour WV2 image of Upper Wright Valley. c. A false-colour parameter map of the same region, with A>0.724, A0.546 and A0.478 mapped in red, green and blue, respectively. In this colour scheme, granitic lithologies map as purple, sedimentary lithologies map as green and doleritic lithologies map as red/yellow. d. Representative atmospherically corrected surface reflectance spectra derived from this scene. WorldView-2 image WV02_10NOV052052194_1030010007BD3000.

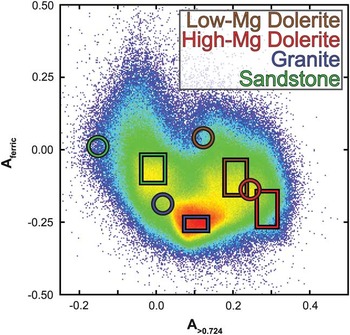
Figure 5 shows a plot of all image pixels in terms of their A>0.724 and Aferric values, and shows that these different lithologic groups are spectrally separable in Wright Valley. Parameter values for averaged laboratory measurements (circles) are generally consistent with, although offset from, the parameter values measured remotely (rectangles). All orbital data are offset to larger A>0.724 and smaller Aferric values than their laboratory counterparts.
Aferric values plotted against A>0.724 values derived from WorldView-2 image WV02_10NOV052052194_1030010007BD3000, with warmer colours representing a higher pixel density than cooler colours. Average, scene-derived values for the four major lithologic groups are shown as rectangles, with heights and widths representative of one standard deviation. Parameter values derived from averaged laboratory measurements of each lithologic group are shown in circles. Orbital-derived data consistently exhibit higher A>0.724 and lower Aferric values than their laboratory counterparts.

These observed offsets are expected as a result of the differences in spatial scale measured using laboratory and orbital techniques. For example, the offset of granite- and quartzite-dominated landscapes to higher A>0.724 values in orbital data is probably the result of mixing with more doleritic surface components. The offset observed in the doleritic units suggests that the dolerite lithologies measured in the laboratory are not as mafic as those that are present throughout the landscape. The offset of orbital data to lower Aferric values suggest that the individual rocks measured in the laboratory are more oxidized than the mixture of clasts and sediments observed throughout the landscape.
The observed offsets are probably not caused by incomplete or improper removal of atmospheric constituents from the WV2 data. The DOS-R atmospheric correction technique subtracts a single derived atmospheric spectrum from all pixels and, thus, an incorrect atmospheric spectrum would result in linear offsets between laboratory and orbital measurements regardless of composition. Although the observed offsets between all laboratory and orbital measurements are in the same direction, the differences in the magnitude of these offsets indicate that a simple atmospheric correction error is unlikely to be the cause of the observed offsets.
The sedimentary Beacon Supergroup, which consists largely of quartzites and coarse-grained sandstones in this locale, appears green in the colour composite shown in Fig. 4c; this is indicative of an oxidized ferric component but a lack of longer wavelength absorptions associated with mafic minerals (Figs 4 & 5). The minimal mixing with other lithologic units (e.g. dolerites) is largely because the Beacon Supergroup is the uppermost lithologic unit in this region; any physical redistribution of materials by aeolian or glacial processes would result in the downhill transport of materials, keeping the sedimentary lithologies relatively free of contamination.
The coarse-grained amphibole-bearing granites and granodiorites that comprise the basement lithologies exposed in Wright Valley appear purple in colour, indicating a combination of long wavelength absorption features and short wavelength concave-down spectral shapes (Fig. 4). The presence of an absorption feature beyond 0.724 µm is probably due to both the presence of amphibole in the parental lithology as well as physical mixing with doleritic soil components. The concave-down shape measured at 0.478 µm indicates that oxidation is relatively weak in these materials, which is consistent with coarse-grained basement rocks and field observations. The coarse-grained nature of these lithologies results in relatively rapid physical erosion, which prevents the formation of oxidation rinds that are common in the more resistant doleritic and sedimentary lithologies. As shown in Fig. 5, the majority of image data are classified as granitic in spectral character. This classification is due to the largely homogenized surface sediments that are pervasive along the valley floor and walls. Continuous transport and sedimentary reworking of these materials largely prevent the preservation of oxidative weathering products at the upper surfaces of these rocks and sediments, and the presence of ferrous mineral components from the nearby doleritic and granitic lithologies result in slightly positive A>0.724 values (Fig. 5).
The quartz-normative and pyroxene-bearing Ferrar Dolerite appears both yellow and red, respectively, throughout the scene (Fig. 4). Both regions exhibit an absorption feature beyond 0.724 µm, which is consistent with the presence of pyroxene. This absorption feature is particularly strong in some areas and is discussed in more detail below. The regions appearing in yellow are also strongly concave-up at 0.546 µm, indicative of a well-developed oxidation rind in addition to the long wavelength absorption feature (Fig. 5). The well-developed alteration rinds on these dolerites indicate their resistance to physical erosion and are indicative of only fine-grained dolerites. Conversely, dolerites that appear red lack these well-developed oxidation rinds, which is most consistent with coarse-grained dolerites that are more susceptible to physical erosion.
Intra-lithologic compositional variability: primary igneous processes in the Ferrar Dolerite
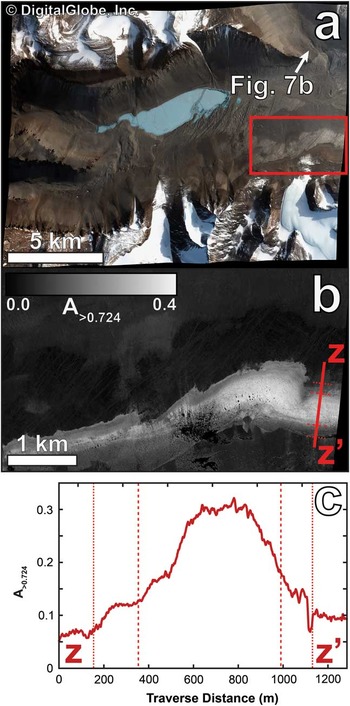
The WV2 instrument has the spatial resolution and spectral capabilities required to identify and quantify the geochemical variations observed throughout the Ferrar Dolerite (Fig. 6), providing an unprecedented means of identifying these otherwise cryptic geochemical properties at high spatial resolutions and over large spatial extents. The spectrally unique signatures of the dolerites, as well as the ability to detect variations in mafic mineral abundances and the extent of chemical weathering, result in sharp and easily discernible boundaries between the dolerites and the surrounding non-doleritic lithologies, as well as intra-sill cryptic geochemical variations. Given the difficulty in identifying and measuring these geochemical signatures in the field, the efficacy of these remote identifications and measurements provides a powerful method for rapidly quantifying such geochemical variations.
a. WorldView-2 true-colour image of central Wright Valley. The red box indicates the location of b. b. An A>0.724 parameter map of the southern valley wall showing a prominent exposure of an opx-enriched mafic core. The cross-section from z to z’ is shown in c. c. A cross-section of A>0.724 values from z to z’. Dotted and dashed lines indicate and correspond to regions of observed differences in b. The opx-enriched mafic core is clearly observed in these remote spectral observations. WorldView-2 image WV02_10OCT252052210_10300100079ABF00.

Figure 6 highlights one particular location along the southern wall of Wright Valley where a mafic magmatic slurry was intruded into the Basement Sill of the Ferrar igneous complex. Using spectral parameters alone, it is possible to observe and quantify the spectral contributions of more opx-rich dolerites relative to the opx-poor sill margins. These results are in remarkable agreement with previous field-based studies of these geochemical trends (e.g. Marsh Reference Marsh2004) and highlight the value of high-resolution remote sensing in identifying and studying primary geochemical trends in these remote environments.
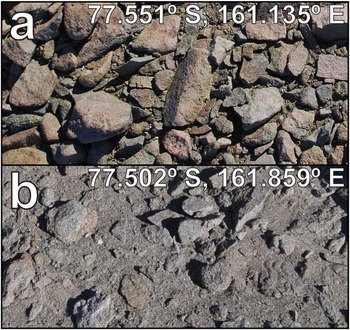
This spectral and geochemical variability is also manifested as textural and visible differences that can be observed from the ground. Two quintessential locations that highlight the range of this observed variability are the Dais of Upper Wright Valley (Fig. 7a) and the western wall of Bull Pass (Fig. 7b). In Upper Wright Valley, the MgO-poor margins of a doleritic sill are exposed and are characterized by fine-grained lithologies that are more resistant to physical erosion. This resistance to physical erosion results in larger boulder sizes, dominance of oxidation rinds on rock surfaces and a relative dearth of sediments derived from the dolerites. On the other hand, the opx-rich dolerites exposed in Bull Pass are much coarser and more susceptible to physical erosion, resulting in smaller and more rounded boulders with an abundance of sediments derived from these lithologies, in addition to an overall grey colour from the lack of preserved surface oxidation.
Typical doleritic landscapes a. on the Dais of Wright Valley (see Fig. 4b for location) and b. in Bull Pass (see Fig. 6a for location). Wright Valley exhibits finer-grained, less mafic dolerites that preserve oxidation rinds much better than the coarse-grained, more mafic dolerites in Bull Pass. Each photograph is one metre in width.

Intra-lithologic compositional variability: post-emplacement modification processes
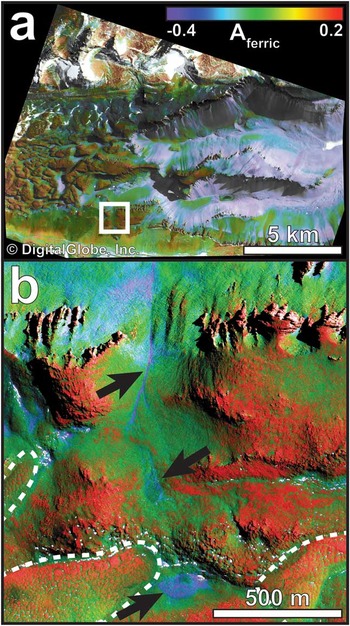
As discussed above and in previous studies, oxidized surfaces form on all exposed lithologies in the MDV, although they are best preserved on fine-grained rocks of considerable hardness. As such, rinds are most mature in fine-grained dolerites and sedimentary lithologies, while coarse-grained dolerites and basement rocks are more readily susceptible to physical erosion and removal through dominantly aeolian processes. When mapping the Aferric parameter throughout Wright Valley, the affinity of oxidation rinds for dolerite- and quartzite-dominated landscapes becomes clear (Fig. 8, as compared to Fig. 4), although small yet important exceptions are also apparent. For example, areas that serve as localized catchments or transport pathways for snow and meltwater exhibit weaker oxidation signatures than their surroundings (Fig. 8b). These surfaces undergo more extensive physical erosion facilitated by freeze–thaw cycling, salt wedging and flaking during these episodic hydrological episodes than the surrounding terrain, preventing the maturation of oxidation rinds (Allen & Conca Reference Allen and Conca1991, Marchant & Head Reference Marchant and Head III2007). These isolated patches are common throughout Wright Valley, are typically associated with channelized morphologies or topographical depressions and probably play significant roles in the local hydrological system (Dickson et al. Reference Dickson, Head, Levy and Marchant2013).
a. Aferric parameter map of Upper Wright Valley. The white box indicates the location of b. Warm colours represent more oxidized surfaces, while cool colours represent less oxidized surfaces. b. A high-resolution subset of the Aferric parameter map. Outlined in white are areas of polygonally patterned terrain, which exhibit stable (and more oxidized) polygon centres relative to their less stable (and less oxidized) polygon margins. Areas influenced by frequent snowmelt are also more susceptible to physical erosion and prevent the maturation of oxidation rinds on rock surfaces; such areas include topographical depressions and channels (indicated by black arrows). WorldView-2 image WV02_10NOV052052194_1030010007BD3000.

Polygonally patterned terrain, formed by the thermal cracking and sublimation of subsurface ice and permafrost, is indicative of stable, cold and dry climatic conditions (Marchant et al. Reference Marchant, Mackay, Lamp, Hayden and Head2013). While the margins of these metre-scale polygons are geologically active regimes, the polygon centres represent areas of long-duration surface stability. In Beacon Valley, many of these surfaces have been dated at greater than 106 years using cosmogenic nuclide dating techniques (Sugden et al. Reference Sugden, Denton and Marchant1995, Schäfer et al. Reference Schäfer, Baur, Denton, Ivy-Ochs, Marchant, Schluchter and Wieler2000). In Wright Valley, polygonally patterned ground is observed in the colder and more geologically stable higher elevations where sedimentary lithologies of the Beacon Supergroup are common. The centres of these stable polygons show greater amounts of oxidation than their margins (Fig. 8b), supporting the model that polygon margins are less geologically stable than their centres.
The spectral and geochemical signatures observed from orbit are clearly associated with other physical and chemical processes that dominate throughout the MDV. The ability to measure these signatures remotely enables researchers to better understand the processes of surface evolution and geochemical cycling, and to develop working hypotheses that can be supplemented by subsequent field and laboratory investigations. Therefore, remote spectroscopic datasets, such as WV2, provide a valuable and complementary addition to traditional geologic mapping efforts.
Biological applications of WorldView-2 in the Transantarctic Mountains
The bandpasses of the WV2 instrument are also ideal for the identification of photosynthetic materials, which exhibit low reflectance values at red wavelengths relative to green and near-infrared wavelengths due to the presence of photosynthetic pigments. Vascular plants are absent in the polar desert environments of the TAM due to the extremely low temperatures, inadequate amounts of liquid water and severely uneven distribution of incoming solar radiation (Marchant & Head Reference Marchant and Head III2007). Nonetheless, ecological niches have been observed throughout the TAM that are home to floral and faunal species adapted to such extreme environments (e.g. McKnight et al. Reference McKnight, Niyogi, Alger, Bomblies, Conovitz and Tate1999 and references therein). Recent work has focused on understanding the specific climatic (e.g. Fountain et al. Reference Fountain, Lyons, Burkins, Dana, Doran, Lewis, McKnight, Moorhead, Parsons, Priscu, Wall, Wharton and Virginia1999) and biogeochemical environments (e.g. Gooseff et al. Reference Gooseff, Barrett, Doran, Fountain, Lyons, Parsons, Porazinska, Virginia and Wall2003) associated with these niches. One particular ecological environment that has been extensively studied is Taylor Valley in the MDV, which hosts algal communities that are adapted to the seasonal melting of nearby glaciers (Alger et al. Reference Alger, McKnight, Spaulding, Tate, Shupe, Welch, Edwards, Andrews and House1997, McKnight et al. Reference McKnight, Niyogi, Alger, Bomblies, Conovitz and Tate1999). We utilized WV2 imagery of Taylor Valley obtained in January 2013 to investigate whether such algal communities can be observed from orbit using the diagnostic spectral signatures of photosynthetic species.
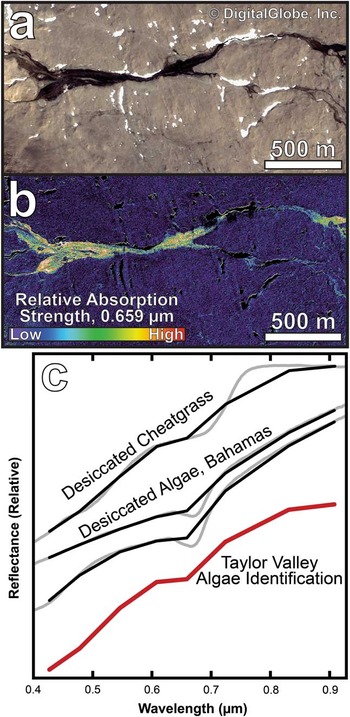
The spectral analyses show that WV2 is able to identify photosynthetic species present in freshwater melt channels in Taylor Valley (Fig. 9). A parameter was derived to identify the deviation of the WV2 0.659 µm band from a continuum line fit between 0.608 µm and 0.724 µm. Areas exhibiting a high value in this parameter are concentrated in these channels and around the thawing margins of the perennial lakes in Taylor Valley. These detections are confirmed through atmospherically corrected reflectance data, which show the presence of a spectral absorption feature near 0.659 µm that is common in laboratory- and field-derived spectra of algae and stressed vegetation. These detections are primarily identified in dark channelized features, which are dampened seasonal meltwater streams. This distribution is largely consistent with previous studies that describe how such algal communities are present where liquid water is most commonly present on annual (or longer) timeframes (McKnight et al. Reference McKnight, Niyogi, Alger, Bomblies, Conovitz and Tate1999).
a. A true-colour image of a subset of Taylor Valley showing a segment of an active glacial melt stream. WorldView-2 image WV02_13JAN052130307_103001001D642400. b. A parameter map of the same area shown in a. indicating the relative depth of an absorption feature centred near 0.659 µm. Strong absorptions are confined to the active stream, although not all areas in the active stream show strong absorptions. c. Atmospherically corrected surface spectra derived from this stream channel (red spectrum), as compared to desiccated cheatgrass (sample AMX33, obtained from the USGS digital spectral library (Clark et al. Reference Clark, Swayze, Wise, Livo, Hoefen, Kokaly and Sutley2007)) and desiccated algae spectra obtained from the RELAB spectral database at http://www.planetary.brown.edu/relab/ (samples C1SG70 and C1SG71), originally reported in Gaffey & Bronnimann (Reference Gaffey and Bronnimann1993).

While the specific family or classification of algae cannot be constrained without more extensive field investigations, the presence of these materials, the spectral character and the spatial distribution can be easily measured as a function of time. Given this utility, the WV2 instrument is a potentially significant contributor to Antarctic ecosystem studies, which are inherently limited in spatial scale, temporal duration and manpower.
Remote characterization of the central Transantarctic Mountains
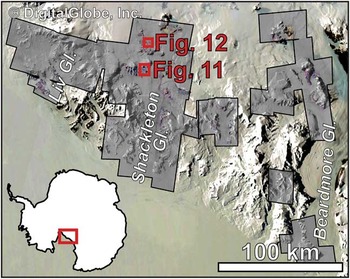
Having established the methodology for remote geologic and biological analyses using WV2 data, these analyses can now be applied to more remote locations throughout the TAM where the scope of traditional field work has been limited or absent. To date, our analyses have focused solely on the CTAM region in the vicinity of Shackleton Glacier, where a deep field logistics hub has been proposed by the NSF during the 2015–16 summer. Supported by the methodologies developed in the MDV, WV2 analyses have contributed to the scientific investigation of this location through the development and release of the ‘SpecMap’ online mapping product (available at http://pgc.umn.edu/about/research/specmap/; Fig. 10).
The geographical coverage of the ‘SpecMap’ product, consisting of ninety-two individual WorldView-2 images over geologic exposures throughout the Shackleton Glacier region. Background imagery is derived from the Moderate-Resolution Imaging Spectroradiometer (MODIS) instrument.

The SpecMap data product is an interactive and scalable web-based interactive map that combines ninety-two individual WV2 images into a single georeferenced mosaic. Each image is individually georeferenced, corrected to surface reflectance, removed of all shadowed or ice/snow/cloud components and parameterized to highlight geologic variability within the scenes. Mapped in the red, green and blue channels are the A>0.724, A0.546 and A0.478 parameters, respectively, which have been shown to be effective in the MDV (e.g. Fig. 4).
This region of the CTAM was last geologically mapped in the late 1960s by McGregor & Wade (Reference McGregor and Wade1969) at a scale of 1:1 000 000. Our spectral mapping product, which has been standardized to a mean resolution of 5 m pix-1, has a higher spatial resolution than this original mapping product by more than a factor of fifty. However, this spectral product is not directly comparable to the original bedrock geologic mapping efforts, as spectral mapping is sensitive to only the uppermost optical surface (<1 mm depth). This dynamic surface layer is typically dominated by sediments and regolith derived from the underlying geologic materials, materials transported from elsewhere and the products of physical erosion and chemical weathering. In tandem, geologic mapping, traditional field work and remote spectral analyses are complementary, and together provide robust compositional and geologic information regarding both the surface and subsurface at large spatial extents.
Application: sedimentary sequences on Collinson Ridge
Collinson Ridge has been extensively studied by sedimentary geologists and palaeoecologists for its spectacular exposures of Permian and Triassic bedforms (e.g. Collinson & Hammer Reference Collinson and Hammer1996, Hammer et al. Reference Hammer, Hickerson and Collinson1996, McManus et al. Reference McManus, Taylor, Taylor and Collinson2002). The Permian-aged Buckley Formation strata are composed primarily of Carboniferous mudrock (Collinson & Hammer Reference Collinson and Hammer1996, McManus et al. Reference McManus, Taylor, Taylor and Collinson2002) and have been thermally altered by the intrusion of Jurassic-aged doleritic sills. The overlying Triassic-aged Fremouw Formation is composed of medium- to fine-grained sandstones and mudrocks with preserved logs, roots and fossilized skeletal remains throughout this sequence (Collinson & Hammer Reference Collinson and Hammer1996, Hammer et al. Reference Hammer, Hickerson and Collinson1996). This sedimentary sequence is most consistent with a transition from a cooler and wetter environment to a warmer and seasonally dry environment (McLoughlin et al. Reference McLoughlin, Lindström and Drinnan1997, McManus et al. Reference McManus, Taylor, Taylor and Collinson2002).
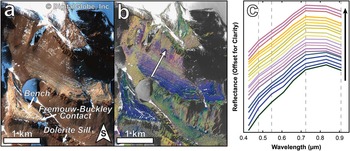
Several hundred metres of this stratigraphic sequence is exposed to the south of the prominent bench on Collinson Ridge near 85.2°S, 175.4°E (Fig. 11). Variations in spectral signatures can be assessed as a function of location through the stratigraphic column. For example, a stronger spectral downturn at wavelengths beyond 0.724 µm is observed while travelling up-section, indicating a larger spectral contribution from Fe2+-bearing phases of primary and/or secondary nature (Gaffey et al. Reference Gaffey, McFadden, Nash and Pieters1993) (Fig. 11c). This transition is consistent with the stratigraphic column published in Collinson & Hammer (Reference Collinson and Hammer1996), which indicates a transition from brighter fine- to medium-grained sandstones lower in the section to darker and finer greenish-grey mudrock higher in the section. Therefore, these darker mudrocks, which are likely to be more Fe-clay-bearing than the brighter underlying strata, should exhibit a stronger absorption feature at wavelengths beyond 0.724 µm.
a. WorldView-2 true-colour image of Collinson Ridge near Shackleton Glacier, with major geologic contacts and units identified. WorldView-2 image WV02_13NOV281547473_103001002A243800. b. A spectral parameter map consisting of A>0.724, A0.546 and A0.478 mapped in red, green and blue, respectively. The arrow indicates the upslope direction through the sedimentary sequence exposed in this region, as well as the approximate location of the individual spectra in c. c. Averaged spectra from each layered sequence identified along the transect shown in b. The colours of each spectra represent a combination of their individual A>0.724, A0.546 and A0.478 parameters mapped in the red, green and blue channels, respectively. The layers transition to more oxidized and more mafic compositions from bottom to top.

Similarly, the spectral complexity observed at shorter wavelengths (<0.724 µm) decreases while travelling up-section, possibly indicating a stronger contribution from amorphous Fe3+-bearing phases, which are characterized by smoothly increasing reflectance with increasing wavelength ahead of ~0.724 µm (Morris et al. Reference Morris, Golden, Bell, Lauer and Adams1993). The presence of crystalline ferric oxides would result in diagnostic Laporte-forbidden transitions between 0.6 µm and 0.9 µm (Gaffey et al. Reference Gaffey, McFadden, Nash and Pieters1993), which are not observed in the WV2 spectra obtained from Collinson Ridge (Fig. 11c). Interestingly, despite the significant contribution from mass wasting and scree deposits, spectral variations are still readily observed throughout this stratigraphic column (Fig. 11b), and spectral mapping can be used to identify similar exposures or sequences throughout the CTAM region.
Although the limited spectral range of the WV2 sensor might prohibit the quantification of mineralogical or geochemical variations, it is clear that diagnostic and explicable spectral variations are observed between sedimentary strata exposed at Collinson Ridge. These spectral signatures confirm the transition to more ferric oxide- and Fe-phyllosilicate-bearing lithologies from the base to the top of the stratigraphic units. The utility of WV2 data to identify these spectral trends and similar sequences elsewhere throughout the TAM makes WV2 a valuable resource when trying to characterize stratigraphic sections in such isolated locations. Additionally, ground truthing at Collinson Ridge, or the measurement of samples with well-constrained geographical and stratigraphic information, would be invaluable to understand the nature of the observed spectral variability. Are the observed long wavelength variations due to the presence of primary mafic minerals or secondary alteration products, such as smectite clays? Is the structure observed at shorter wavelengths the result of post-exposure oxidation or inherent to the iron-bearing minerals present within the sedimentary sequence? These questions can be readily answered through field or laboratory spectral measurements.
Application: glacial processes near Schroeder Hill
Glacial moraines, the depositional records of past glacial advances, have been widely used to reconstruct the history of ancient ice sheet and climate stability and dynamics. Cosmogenic nuclide and isotopic dating of glacial moraines and buried ash deposits have proven successful in reconstructing palaeoglacial activity in Arena Valley of the MDV (e.g. Brook et al. Reference Brook, Kurz, Ackert, Denton, Brown, Raisbeck and Yiou1993, Marchant et al. Reference Marchant, Denton and Swisher III1993). Staiger et al. (Reference Staiger, Marchant, Schaefer, Oberholzer, Johnson, Lewis and Swanger2006) also showed that surface weathering of dolerite clasts are directly correlated with exposure and moraine ages, proving that these surface properties are good indicators of surface stability and history of glacial overprinting. Isotopic and petrographic analyses of glacial till samples from the CTAM region were used to reconstruct ice flow patterns of Byrd Glacier and to identify lithologies buried beneath the East Antarctic Ice Sheet (Licht & Palmer Reference Licht and Palmer2013). These studies confirm that glacial moraines contain a wealth of information regarding palaeoglacial activity.
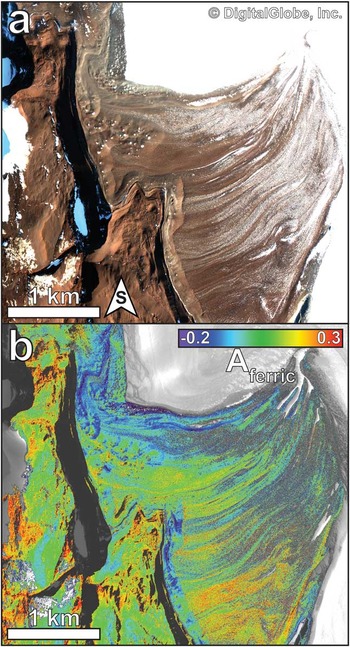
A large sequence of glacial deposits along the south-western margin of Schroeder Hill (85.4°S, 175.4°E) exhibits unique spectral signatures related to one such banded moraine complex (Fig. 12a). This moraine complex is more than 2.5 km in length and is associated with Zaneveld Glacier, which flows to the north into Shackleton Glacier. When applying the Aferric spectral parameter to the WV2 data, significant yet coherent variations can be seen throughout the moraine complex (Fig. 12b). The deposits near the toe of Zaneveld Glacier are dominated by lower Aferric values, suggesting less oxidized rock surfaces. In contrast, regions furthest from the toe exhibit more oxidized signatures. These trends are consistent with older, more stable and more chemically weathered lithologies located furthest from the toe of Zaneveld Glacier, while more recently disturbed materials are present closest to the toe of the glacier. The range of Aferric values observed here are also comparable to those observed throughout Wright Valley, indicating a wide range of surface oxidation associated with this glacial moraine sequence. A similar spectral pattern is observed along the hillslope running northward from the centre of the image. This slope appears less oxidized than the surrounding non-sloped landscapes suggesting that mass wasting processes create unstable surfaces that are unable to develop and preserve oxidation rinds as readily as the horizontal and stable surfaces nearby.
a. WorldView-2 true-colour image of a glacial moraine sequence south-west of Schroeder Hill. WorldView-2 image WV02_13DEC061553002_1030010029874500. b. Aferric parameter map of this moraine sequence, showing less oxidized surfaces closest to the glacier and more oxidized surfaces further from the glacier. Warm colours represent more oxidized surfaces, while cool colours represent less oxidized surfaces. These observations are consistent with more stable surfaces exhibiting more oxidized spectral signatures.

The strong agreement between these spectral observations and the observed glacio-chronologic sequence corroborates our remote methodologies and our ability to translate parameters perfected in the MDV to the more remote and spectrally uncorroborated CTAM region. Our orbital observations are also consistent with the work of Staiger et al. (Reference Staiger, Marchant, Schaefer, Oberholzer, Johnson, Lewis and Swanger2006), who identified trends between surface weathering, oxidation and the surface stability and age of glacial moraines. The ability to perform similar analyses remotely can help to identify regions of interest, and to formulate and test hypotheses related to surface and ice sheet stability, as well as the influences and rates of glacial activity throughout the TAM. As with the spectral measurements of Collinson Ridge, in situ or laboratory analyses of well-documented samples must be performed to determine any true compositional variations associated with these observed spectral trends.
Issues and complications with the current SpecMap product
Unlike the spectral mapping of the MDV, which was accompanied by two field seasons dedicated to the ground truthing of orbital datasets, the spectral mapping of the CTAM region has not been complemented by accompanying field work. Numerous spectral measurements of altered and unaltered rock samples and sediments were analysed at the USPRR, providing a suite of spectral measurements that are directly relevant to lithologies present in the CTAM region. However, most of these samples lack robust geographical information, creating difficulty in accurately matching these spectral signatures to specific geologic units. In addition, the removal of these samples from their original geologic context complicates the direct comparison to remote spectral measurements, which are sensitive to variations in surface properties and the abundance and composition of surrounding sediments. Future field work dedicated to in situ spectral measurements and ground truthing will be necessary to accurately calibrate this dataset to the level that has been completed for the MDV.
Some possible complications associated with our spectral mapping of the CTAM region have been identified during the course of our analyses. First, imaging these high latitudes often results in extremely low solar illumination angles and significant off-nadir spacecraft pointing. These geometric effects can result in significant variability in atmospheric contributions to a given image. While the DOS-R atmospheric removal technique has been proven effective, we caution that even minor errors in the identification and removal of atmospheric constituents can result in potentially significant spectral artefacts. This potential source of error can be significantly reduced through future laboratory and in situ ground truthing.
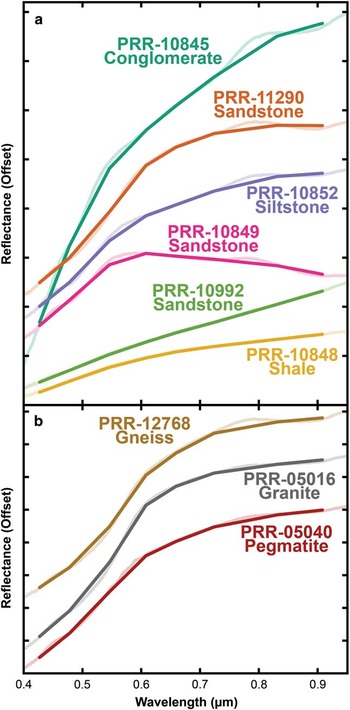
Second, the sedimentary lithologies present throughout the CTAM region exhibit mineralogical diversity that is not observed as extensively in the MDV. The majority of sedimentary exposures in the MDV are associated with the Devonian-aged Taylor Group of the Beacon Supergroup, which consists primarily of quartz-rich sandstones with interbedded siltstone and shales (e.g. Barrett Reference Barrett1981, Cox et al. Reference Cox, Turnbull, Isaac, Townsend and Smith Lyttle2012). Meanwhile, the Victoria Group is composed of a diverse suite of glacial beds, sandstones, shales, conglomerates, ash deposits and coal beds of Carboniferous, Permian and Triassic age (Barrett Reference Barrett1981), and are the dominant sedimentary lithologies exposed in the CTAM. This geochemical and mineralogical diversity presents a challenge when trying to detect unique lithological groups from orbit using only eight spectral bands (Fig. 13a).
Laboratory spectra obtained from samples returned from the Antarctic and currently stored at the US Polar Rock Repository at the Ohio State University. The IDs are unique to each individual sample. a. Spectral variability in sedimentary lithologies derived from the central Transantarctic Mountains (CTAM). b. Spectral similarities between heterogeneous basement rocks obtained from the CTAM. These basement rocks are also spectrally similar to some of the sedimentary rocks shown in a.

Lastly, the mineralogical similarity between many plutonic and metamorphic lithologies could result in spectral ambiguity between these different rock types. Similar spectral properties have been observed between varying lithologies (Fig. 13b) and some of these lithologies even share spectral similarities to some mafic-bearing sedimentary lithologies (Fig. 13a). While in situ ground truthing would reduce some of this ambiguity, the limited spectral capabilities of WV2 may not be capable of distinguishing between these phases, limiting the efficacy of spectral mapping throughout the CTAM region using this dataset.
To date, positive identifications of algal communities have not been identified in the CTAM region. It is possible that the CTAM are too cold for ecological communities to thrive at the uppermost surface, making their detection impossible from orbit. Alternatively, the areal extent of these communities may be smaller than the spatial resolution of WV2 (~4 m2), which would also preclude their identification from orbit. It is also possible that such algal communities are completely absent from these locales due to the harsh environmental conditions and/or lack of sufficient amounts of meltwater on an annual timeframe. Any combination of these possibilities is plausible and field work is required to investigate whether productive ecological niches are present and, if so, whether the scale of ecological activity can be identified from orbit.
Means of improving SpecMap
The current SpecMap product can be improved in three fundamental ways. First, spectral ground truthing and verification can significantly improve our ability to match calibrated surface spectra to those derived from orbit using remote calibration and correction techniques. Second, improvements to atmospheric correction techniques can provide better association to spectral measurements made in the field or in the laboratory, further reducing ambiguity and inconsistencies. Third, extending the spectral resolution of the current SpecMap product through the utility of other spectral datasets will help to identify unique spectral features associated with otherwise spectrally ambiguous lithologies, in addition to improving current atmospheric correction techniques.
Ground truthing remote datasets can be done in many ways. One possible method is to derive in situ spectral measurements of undisturbed surfaces, as was completed in three different locations in the MDV in 2010 and described in Salvatore et al. (Reference Salvatore, Mustard, Head III, Marchant and Wyatt2013a). During this successful ground truthing campaign, 100 m by 100 m grids were established in areas that appeared spectrally homogeneous from orbit. Using a portable field spectrometer, measurements were made at ten metre intervals throughout this spectral grid, using ambient lighting conditions and measuring a calibration target after every ten measurements. All of these spectral measurements were then averaged to obtain a calibrated and corrected surface reflectance measurement over that geographical location, which was used to validate the remote DOS-R atmospheric correction technique applied to ALI data (Salvatore et al. Reference Salvatore, Mustard, Head III, Marchant and Wyatt2013a). Similar principles can be utilized in the CTAM region, where spectral ground truthing can be used to validate the remote DOS-R technique or to force the remote spectra to match the ground truthed spectral measurements.
To a lesser extent, collaborating with researchers who have collected and returned samples from the CTAM region to measure their sample suite can also be helpful in the calibration of remote data. A more accurate understanding of where individual samples were collected can help to match laboratory-derived spectra to atmospherically corrected surface spectra derived from orbit. Comparison between these two techniques will help to validate our remote atmospheric correction techniques. Currently, most of the geographical controls on the samples measured at the USPRR are typically limited to the vicinity of individual mountains, glaciers or nunataks. Without more detailed control on the precise location of outcrops or surface materials, the individual samples can only be used to gauge the range of spectral diversity observed in that geographical vicinity, but not to improve the accuracy of atmospheric correction techniques.
Improved atmospheric correction techniques would allow for the more confident detection and interpretation of subtle spectral features present within the data. Scene-derived atmospheric corrections, such as the DOS-R methodology, are dependent upon fundamental assumptions to approximate an atmospheric spectrum. Radiative transfer techniques utilize fundamental atmospheric principles (including illumination and viewing geometries, estimations of dust and aerosol contributions, and atmospheric variability with altitude) to derive a synthetic atmospheric spectrum for each scene. Improvements to radiative transfer modelling can be attained through frequent atmospheric monitoring in the region of interest, including vertical atmospheric profiles measured using weather balloons. While this level of atmospheric monitoring may be possible near permanently manned deep field logistics hubs, it is not feasible to expect this level of data throughout the remote regions of the TAM. As such, scene-derived atmospheric correction algorithms or the use of in situ ground truthing data are the two most likely options for atmospheric correction, although they suffer from their own limitations as well.
The recent launch of the WorldView-3 (WV3) instrument will provide extended spectral capabilities to those currently available through WV2. In addition to eight spectral bands at wavelengths shorter than 1.0 µm, WV3 has an additional eight spectral bands in the near-infrared between 1.2 µm and 2.4 µm. This spectral range is ideal for the characterization of broad spectral shapes as well as the identification of specific hydrated mineral species. The four bands located between 2.1 µm and 2.4 µm are well selected to characterize the overtones and combination tones of metal-hydroxyl vibrational modes (Clark Reference Clark1999). The location of these absorption features vary as a function of chemistry, with Al-OH, Fe-OH and Mg-OH absorptions present at 2.21 µm, 2.29 µm and 2.32 µm, respectively. The ability to unambiguously identify these specific molecular bonds and their corresponding mineral structures will greatly improve our ability to map and investigate spectrally unique surfaces. For example, the ability to identify the composition of clay minerals in sedimentary exposures throughout the CTAM can help to constrain the extent of chemical leaching or maturity of these palaeosedimentary environments. In basaltic and mafic lithologies, the presence, position and shape of a broad Fe2+ electronic absorption feature near 2 µm can help to determine the composition of primary phases present in a given lithology. For example, laboratory spectra of the Ferrar Dolerite have used this wavelength region to confirm the spectral dominance of opx in unaltered samples. However, as dolerites weather in the hyper-arid and hypo-thermal Antarctic environment, the shape of this broad 2 µm band readily changes to a negative spectral slope (Salvatore et al. Reference Salvatore, Mustard, Head III, Marchant and Wyatt2013a, Reference Salvatore, Mustard, Head, Cooper, Marchant and Wyatt2013b). This spectral change is the result of a strengthened absorption feature near 3 µm caused by water in the mineral structure. This intense absorption feature influences the shape of the reflectance spectrum well into the range that will be observed by WV3.
In addition to these improved mineral detection and lithologic characterization capabilities, the extended wavelength range will also improve the ability to atmospherically correct individual images using in-scene correction methods. In utilizing the last WV2 spectral band (0.908 µm) to perform the DOS-R atmospheric correction technique, it is assumed that the Rayleigh predicted 1.1% atmospheric scattered light is a negligible contribution to the overall spectral signature. With the last WV3 spectral band located at 2.330 µm, the Rayleigh predicted atmospheric scattering component at this wavelength is 0.025%, which is a factor of forty-three better than WV2. Such a small predicted scattered component will ensure that scene-derived atmospheric contributions are not related to signatures from the underlying surface. Therefore, the assumption of negligible atmospheric scattering is appropriate using WV3.
Conclusions
The WV2 multispectral orbital sensor is an effective tool for investigating the remote compositional analyses of ice-free regions throughout the TAM. The calibration techniques, atmospheric correction, parameterization and scientific capabilities of WV2 as applied in Antarctica were first developed in the MDV, where a long history of field investigations has provided the necessary geologic and ecological context for subsequent remote analyses. These spectral analyses show that i) the compositional diversity associated with major lithologic units is identifiable from orbit, ii) the presence and abundance of pyroxene within the sills of the Ferrar Dolerite can be identified and quantified remotely, iii) intra-lithologic heterogeneities in the spectral dominance of ferric iron oxides is indicative of surface stability and resistance to physical erosion, and iv) the spatial and temporal distribution of algal communities can be mapped based on the unique spectral signatures associated with photosynthetic compounds.
Based on the successes of these techniques and spectral analyses throughout the MDV, subsequent analyses of the more remote CTAM region have proved valuable and have identified a similar range of spectral variability. Spectral variations in the vicinity of Collinson Ridge can be directly associated with stratigraphic units identified in previous field investigations. In addition, these analyses show that it is possible to characterize palaeoglacial activity and surface stability using the strength of ferric oxide absorptions identified in glacial moraine complexes. Areas closest to the glacial toe exhibit the weakest ferric iron oxide signatures, while areas furthest from the glacial toe exhibit the strongest signatures. This observation confirms that mature oxidation rinds have been unable to develop in regions of more recent glacial modification. To date, no regionally extensive areas of biological materials have been identified in the vicinity of Shackleton Glacier, probably due to their lower abundance and presence on much smaller spatial scales.
Without sufficient ground truthing or laboratory measurements of geographically referenced samples, the accuracy of these remote analytical techniques cannot be fully appreciated or assessed in the CTAM. The inability to confirm the utility of the DOS-R atmospheric correction algorithm prevents the necessary technical validation of these methodologies, as was shown for the MDV. In addition, without a full spectral library of surface compositions found throughout the CTAM, it is difficult to properly interpret these remote spectral signatures. Future ground truthing and sample collection will allow for more accurate, robust and comprehensive spectral mapping throughout the entirety of the TAM.
Even with such an extensive spectral library, the limited spectral capabilities of WV2 prohibit the definitive identification of many lithologies that are probably present. The utilization of the improved capabilities of WV3 will assist with the spectral and compositional interpretation of lithologies and surface materials present throughout the TAM. Intra-lithologic variations, particularly the geochemical variations observed within the sedimentary layers of the Beacon Supergroup, will be of particular interest to study the palaeoenvironmental record preserved in these sedimentary packages. Improved atmospheric correction capabilities will also be provided through the extended wavelength range measured by WV3. Based on Rayleigh scattering theory, the DOS-R atmospheric removal algorithm will also be dramatically improved by using the extended wavelengths capabilities provided by WV3.
The demonstrated capabilities of the WV2 instrument to detect geochemical variations observed within geologic surfaces provide a new and unprecedented ability to update and improve upon the earlier geologic maps published throughout the TAM. The SpecMap data product represents one such improvement in the vicinity of Shackleton Glacier. Future work to validate these orbital products and to expand upon the geographical range of SpecMap is currently being designed. Together with the noted improvements to our remote techniques and capabilities, the analysis of remote spectral datasets will provide a critical complement to traditional geologic mapping, field work and laboratory analyses.
Acknowledgements
MRS would like to acknowledge the assistance of his collaborators, particularly P. Morin, G. Roth and other staff at the Polar Geospatial Center at the University of Minnesota. Helpful discussions and revisions by P. Christensen, J. Dickson, C.R.M. Jackson, E.G. Rivera-Valentin, J. Smellie, the editorial staff and the anonymous reviewers were greatly appreciated. MRS would also like to thank J. Bell, J. Mustard and M. Tedesco for assistance with spectral measurements, and A. Grunow and the Polar Rock Repository at the Byrd Polar Research Center at the Ohio State University for their generosity and assistance with sample analyses. This work was funded by National Science Foundation grant ANT-1414378 to MRS, with preliminary spectral measurements and ground truthing performed under ANT-0739702 (J.W. Head, Brown University). MRS was the sole contributor to the content of this manuscript.