INTRODUCTION
Patterns of species co-occurrence have been widely investigated by ecologists (Jackson et al. Reference JACKSON, SOMERS and HARVEY1992, Peres-Neto Reference PERES-NETO2004). Fish communities are structured by effects working at a regional scale, where abiotic factors limit the species distributions; and at a local scale, where biotic factors determine species survival within a system (Gaston Reference GASTON2000, Thompson Reference THOMPSON2009). However, in highly variable aquatic systems, abiotic factors appear to be more important with little or no influence of biotic factors (Fisher & Lindenmayer Reference FISHER and LINDENMAYER2002, Granado-Lorencio et al. Reference GRANADO LORENCIO, LOBÓN CERVIÁ and ARAÚJO LIMA2007, Snodgrass et al. Reference SNODGRASS, LAWRENCE, LIDE and SMITH1995, Suárez et al. Reference SUÁREZ, PETRERE and CATELLA2004, Taylor & Warren Reference TAYLOR and WARREN2001). In large tropical rivers, rainfall-driven hydrology is a key factor in the seasonality of aquatic environments (Sanderson et al. Reference SANDERSON, EYRE and RUSHTON2005). The flood-pulse concept (FPC) identifies seasonal hydrology as the major force structuring stream–fish assemblages (Araújo et al. Reference ARAÚJO, PINTO and TEXEIRA2009, Junk et al. Reference JUNK, BAYLEY, SPARKS and Dodge1989). During the flood pulse, the majority of water bodies become interconnected (floodplains) and the fish are free to disperse throughout the floodplain (Godoy et al. Reference GODOY, PETTS and SALO1999). Floodplain lakes connected with the river by channels are open systems (Saint-Paul et al. Reference SAINT-PAUL, ZUANON, VILLACORTA-CORREA, GARCIA, FABRÉ, BERGER and JUNK2000), and are typical ecotopes of large lowland rivers (Schomaker & Wolter Reference SCHOMAKER and WOLTER2011).
In Neotropical floodplains, the flood cycle (pulse) associated with alteration of dry and rainy seasons produces major changes in fish communities (Rodríguez & Lewis Reference RODRÍGUEZ and LEWIS1994), and it acts as an intermediate disturbance. Because of high environmental variability, species assemblage organization has been portrayed as highly stochastic, without any apparent overall organizational pattern (Lowe-McConnell Reference LOWE-MCCONNELL1987, Lowe et al. Reference LOWE, LIKENS and POWER2006). However, more recent studies have seemingly found non-random associations of fishes within the floodplain (Petry et al. Reference PETRY, BAYLEY and MARKLE2003, Winemiller Reference WINEMILLER, Cody and Smallwood1996). Studies on the structure and dynamics of fish assemblages of permanent water bodies in different floodplain river systems indicate that these assemblages are structured by a combination of environmental variables, as well as by the pool of species available during the period in which the water bodies are permanently connected to the river (Fernandes et al. Reference FERNANDES, MACHADO and PENHA2010). Certain environmental variables (hypoxia, depth, transparency, local-scale habitat, size and drainage area) have been considered to be good predictors of the richness of local associations of fish, within the floodplain (Montaña & Winemiller Reference MONTAÑA and WINEMILLER2010).
A study of the factors that control species richness in floodplain lakes requires information about the taxonomy and distribution of the species. Information is more extensive on fish species from temperate rivers and big tropical rivers than on fish species of floodplain lakes. Therefore, the first aim of this study was to catalogue fish species (ichthyofauna survey) and examine the fish richness in tropical floodplain lakes, during the high-water season. For this study, we selected 27 lakes from the Magdalena river, which vary in morphological and limnological characteristics. The fish caught were identified taxonomically and the sampling data were used to calculate the total abundance. The second aim was to determine the main factors that control local species richness (lake community). We test the following hypotheses: (1) there is an relationship between abundance and regional occupancy (%) in fish species of the floodplain lakes, (2) the area is related to the species richness of the lake (species–area relationship, SAR), (3) the distance to the main river (connectivity) is a predictive variable of local richness, and (4) the geographical distance between lakes has a relationship to the similarity in fish assemblages found in them (community similarity decay).
METHODS
The Magdalena River is 1612 km long and drains a 257 438-km2 basin. The principal tributaries are the Cauca, Sogamoso, San Jorge and César Rivers. The average precipitation for the valley measured in run-off is 2050 mm y−1. The lowest values are recorded for the December–January and July–August periods, and the highest between April–May and October–November (twice-yearly peak flooding). The annual mean discharge (data for 1975–1995) from the Magdalena River in the locality of Calamar (112 km upstream of the estuary) is 7200 m3 s−1 (Restrepo & Jerfve Reference RESTREPO and JERFVE2000). The physical structure of the system comprises a meandering river channel with numerous connected and isolated lakes (lakes vary in size and degree of connection). The main types of habitats in floodplain lakes are herbaceous vegetation (aquatic macrophytes) and open water. The relative proportion of the habitats varies both regionally and seasonally. The whole middle and lower Magdalena River is not fragmented by dams and is still characterized by highly variable hydrological conditions.
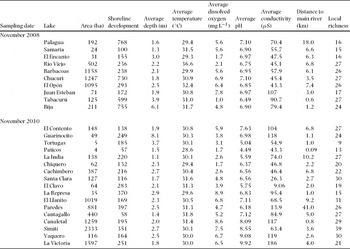
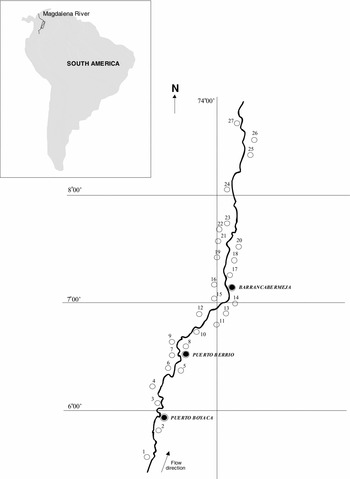
While some floodplain lakes become permanently cut off from the main flow of the river and remain closed (isolated), others remain open with perennial connection with the river. Twenty-seven connected lakes were studied, all in the midsection of the Magdalena River basin, between the localities of Puerto Boyacá and Barrancabermeja (840.92 km; Figure 1). The study area is centred at 6°04′N–7°26′N, 73°57′W–74°31′W (GPS derived). The selection was based on lake surface area and permanent connectivity with the main river. These lakes were selected to represent a range of size (4–2300 ha) and degree of human impact (Table 1).
Sampling date, name and average of some hydrological and limnological characteristics of floodplain lakes studied in the Magdalena Basin, in the 2008 and 2010 sampling campaigns.

Magdalena River floodplain lakes studied along the transect (841 km) between Puerto Boyacá and Barrancabermeja, Colombia. The lakes (from upstream to downstream) are: Guarinocito (1), Tortugas (2), Paticos (3), La India (4), Chiquero (5), Cachimbero (6), Samaria (7), Palagua (8), El Encanto (9), Río Viejo (10), Santa Clara (11), Barbacoas (12), El Clavo (13), Chucuri (14), El Opón (15), La Represa (16), Juan Esteban (17), El Llanito (18), Cantagallo (19), Paredes (20), Tabacurú (21), Bija (22), Canaletal (23), Simití (24), El Contento (25), Vaquero (26) and Victoria (27).

Lakes were sampled during the wet season, because of its near-maximum species richness and stability in water level. Ten lakes were sampled at the beginning of November 2008 (Palagua, Samaria, El Encanto, Rio Viejo, Barbacoas, Chucurí, El Opón, Juan Esteban, Tabacurú, Bija) and the remaining 17 in 2010, at the same month, coinciding with the second peak flooding. The sampling method was the same for all the lakes. Water parameters were measured for 24 h every 4 h. At each fishing site, dissolved oxygen concentration (DO in mg L−1), water temperature (T in °C) and conductivity (μS) were measured in situ. DO (dissolved oxygen) and temperature were measured in the water column every metre. The maximum depth (m) of lakes was determined by sonar.
For each lake, the area and perimeter length were calculated for the period of high water level. An index used to quantify this is called the shoreline development (Dl). This index compares the minimum possible circumference of the lake, given a specific surface area (i.e. a perfect circle), to the actual circumference of the lake and its surface area. A value of 1 for shoreline development is a perfect circle and a larger value means that the shoreline is highly dissected. Lakes with high shoreline development are often naturally productive relative to those with low shoreline development.
The shortest distance between lakes and the river were measured on maps (1: 100 000) from Google Earth. We use the length of the channel (measured in the field) that links the lake to the main river as a measure of connectivity; Tockner et al. (Reference TOCKNER, SCHIEMER, BAUMGARTNER, KUM, WEIGAND, ZWEIMULLER and WARD1999) consider that this distance is a good predictor for this structural variable.
Prior to statistical analyses, all variables except pH and temperature were logarithmically transformed in order to approximate normal distributions. The measurements for environmental variables were analysed using a one-way ANOVA with the aim of discovering differences between periods, as well as between habitats for each period (Bonferroni correction included). Pearson's correlation analysis was used to explore the possible correlations between the environmental variables measured.
In order to estimate the total species richness, sampling was designed for each of the various existing habitats. In all the lakes, one sampling station was chosen within each of these four macrohabitats: littoral with trees, littoral without trees, open water, and the connecting channel between the lake and main river. All were sampled simultaneously. Because sampling effort was constant across samples, it was not necessary to adjust richness estimates using rarefaction or other techniques to account for different sampling techniques or sample sizes. The fish were collected using experimental multifilament gillnets, formed from panels measuring 100 × 3 m, in nine different sizes (from 2 to 10 cm stretched mesh). This kind of technique for capture has been used in the studies of associations of fish in oxbow lakes (Winemiller et al. Reference WINEMILLER, TARIM, SHORMANN and COTNER2000). The nets were set out for 24 h, and checked every 4 h, with the intention of avoiding phenomena such as predators and decomposition due to the high temperature of the water. Fishes were classified as sedentary or short-distance migrant species based on available regional information. Catch per site was standardized according to the length of bank fished and the catch per unit effort (CPUE) determined as fish caught per 100 m. The standardized fish densities were used to calculate basic fish-assemblage metrics, like relative abundance (%) of species and richness. In all analyses for a lake, only the abundances and richness of taxa present at that lake were used. We used the Spearman's rank correlation coefficient to test the occupancy-abundance relationship. We define the richness of species in a lake as local richness (LR, α-diversity), and the analysis of all the lakes taken together as regional richness (RR, γ-diversity).
We analysed the similarities of assemblages using only presence–absence data. Previous studies have shown that taxonomic patterns may differ when using the presence–absence or abundance data (La Sorte & McKinney Reference LA SORTE and MCKINNEY2007). In order to analyse whether the geographical distance between lakes has any relationship to the similarity in associations of fishes found in them (community similarity decay; Nekola & White Reference NEKOLA and WHITE1999), the Sørensen index was applied (S = C/α; where C represents common species and α the average richness for the two lakes), and the geographical distances between lakes were also calculated (using Google Map).
Distance decay often is examined using linear geographic distance (Maloney & Munguia Reference MALONEY and MUNGUIA2011). Distance decay is used to describe the decay in ecological similarity of assemblages between two sites as a function of their distance apart along an environmental gradient. Regression distance-decay models are fitted by calculating the ecological similarity between each pair of sites on a scatterplot of similarity vs. distance (x-axis). As the pairwise similarity values and distances are not truly independent in a statistical sense (each fish community is used in more than one pairwise comparison), we use average similarity and average distance for each lake. The significance of each regression model was tested using a randomization approach. The general model was conducted using software package Statistica 6.0.
The study of species–area relationships (SARs) has a long tradition in ecology and the construction of SARs is one of the most frequently used methods to estimate species number at different spatial scales (Lomolino Reference LOMOLINO2000). In this study, the data were fitted to the power model (ln (S) = z ln (A) + c).
RESULTS
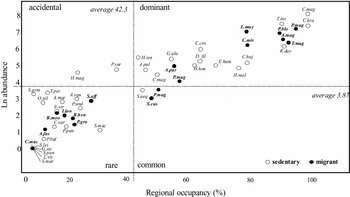
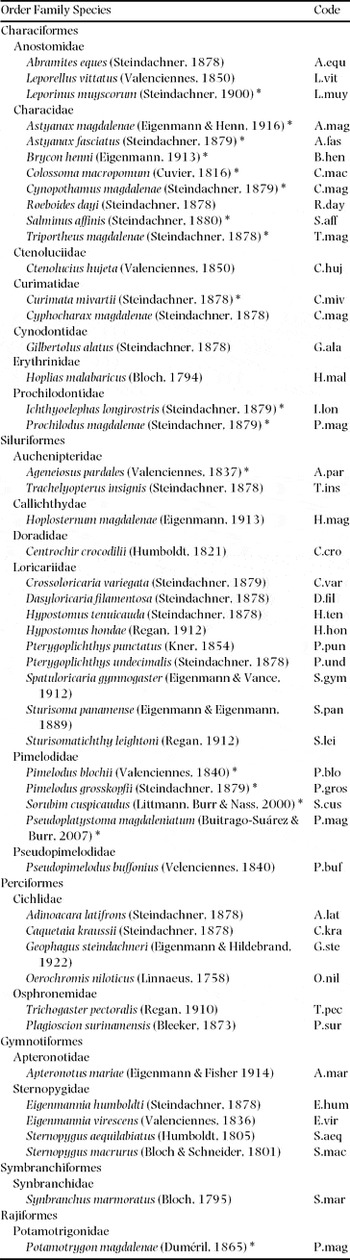
A total of 18 237 individuals were recorded representing 50 species (regional richness). Characiformes (38%) and Siluriformes (36%) were the best represented orders. We observed 50 fish species (Appendix 1). The most frequent species in all catches were Cyphocharax magdalenae (29.3%) and Roeboides dayi (20.3%), followed by Caquetaia kraussii (14.6%) and Trachelyopterus insignis (12.8%), all of them with a sedentary life style. The range of richness of species (local richness) varied between 9 and 39 species. In Figure 2, the species caught were ordered on the basis of their overall Ln regional abundance and geographical range (% of lakes occupied). We observed 50 species, of which 22 were dominant, two were accidental, three common and 23 were rare (in relation to the mean values of the total number of species and lakes, 3.87% and 42.3%, respectively). The species found in all the lakes studied (100% incidence) were sedentary species: Caquetaia kraussii and Cyphocharax magdalenae.
Scatterplot of abundance (Ln) versus regional occupancy (%) of the fish species collected. Names in bold represent migratory fish species. The figure was divided in relation to the mean values for each variable for the total number of species and lakes. Fish species are represented using the codes from Appendix 1.

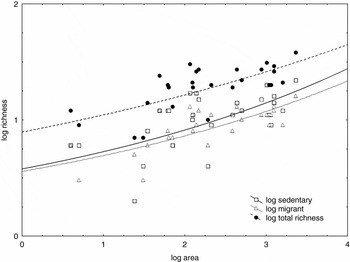
At the local scale, the relationship between migratory and sedentary species was significant and positive in all the lakes in terms of local richness (r = 0.79, P = 0.0009). A significant relationship was observed between the total abundance of each species (ln-transformed) and the number of lakes where they were found (n = 50, rs = 0.93, P = 0.000001). Out of all the measurements taken in the lakes, only lake size (log(Area) was significantly correlated to the local richness of species (n = 27, r = 0.69, P = 0.0009) (Figure 3). We found that lake shoreline development had significant effect on species richness (n = 27, r = 0.48, P = 0.0068). The other environmental variables (including connectivity) were not significant in any of the multiple regressions; many habitat characteristics were significantly correlated.
Species–area curves for the 27 floodplain lakes of the Magdalena River, from November 2008 to 2010. The fitted power curve (local richness versus area) for the whole sampling area is presented for all fish species, migrant species and sedentary species. Total richness plot regression is a dashed line, sedentary plot regression is represented by a solid line, and migrant plot regression is a dotted line. The slope of the regression line is steeper for the sedentary plot as compared with the migrant plot.

Similarity in fish communities decreased with distance. A linear regression provided a good fit to these data (averaged for each lake). Our results show that the similarity between local assemblages depends on the distance between lakes (n = 27, r = −0.51; P = 0.006); with apparently greater significance if the analysis was undertaken on migrant species only (n = 27, r = −0.61, P = 0.0006).
DISCUSSION
The Neotropical region harbours the world's richest freshwater ichthyofauna, with more than 2500 species (Böhlke et al. Reference BÖHLKE, WEITZMAN and MENEZES1978). The ichthyofauna of South American rivers is dominated by ostariophysan fishes (Characiformes over Siluriformes and Gymnotiformes). The families Anostomidae, Chilodontidae, Curimatidae and Prochilodontidae inhabit most river systems throughout tropical and subtropical South America and southern Central America (Albert & Reis Reference ALBERT and REIS2011, Carolsfield et al. Reference CAROLSFIELD, HARVEY, ROSS and BAER2004). In the present study, the most diverse order was Characiformes with seven families and 20 species, followed by Siluriformes, six families and 19 species. Characidae and Loricaridae were the most diverse (seven genera). It is interesting to observe that there is a maximum of three species within each genus, and that most genera are represented by only one species. Lowe-McConnell (Reference LOWE-MCCONNELL1987) explained high dominance of small characiformes in tropical fish communities mainly by the capacity of these species to use oxygen in the upper portion of the water column.
Two variables were consistently related to the species richness: area and shoreline development. Other variables such as depth, DO, conductivity, temperature and distance to the main river were not significant in any of the multiple regressions. The lack of relationship between these variables and the fish richness in floodplain lakes could be accounted for by sampling limitations (type II error) or could represent a real lack of effect. Since we studied 27 lakes, the statistical resolution was reasonable despite the variability in catch. A more probable hypothesis is that these variables had a weak effect, if any, on species richness.
Lake depth is often an important variable to explain fish richness and fish abundance. Winemiller et al. (Reference WINEMILLER, TARIM, SHORMANN and COTNER2000) found a direct relationship between these variables in oxbow lakes of the Brazos River, USA. Suárez et al. (Reference SUÁREZ, PETRERE and CATELLA2004) and Tejerina-Garro et al. (Reference TEJERINA GARRO, FORTIN and RODRIGUEZ1998) reported depth as one of the main environmental structuring factors of fish communities of the Pantanal and Araguaia River. Lake depth had a weak effect on the species richness of lakes in our study.
Even if the connectivity (distance) to the main channel can be considered a predictive variable, indicating the richness of a lake, or at least in relation to migratory species as has been demonstrated in certain Amazon floodplain lakes (Granado-Lorencio et al. Reference GRANADO LORENCIO, ARAÚJO LIMA and LOBÓN CERVIÁ2005), in our study it has not been possible to demonstrate this. In the lakes studied by Bertolo & Magnan (Reference BERTOLO and MAGNAN2006) connectivity had little effect on fish species richness; and Tejerina-Garro et al. (Reference TEJERINA GARRO, FORTIN and RODRIGUEZ1998) verified that connectivity had no apparent effect on community structure. This may be because of the varying hydrological behaviour of the river, or the different capacities of diverse species to colonize or simply that the range of lengths of the connecting channels was not sufficient.
Comparisons of tropical fish community structure in lake surveys conducted at regional or supra-regional scales have detected predictable links between community structure and environmental variation (Tejerina-Garro et al. Reference TEJERINA GARRO, FORTIN and RODRIGUEZ1998). Principally, the structure of fish assemblages can be produced by two different processes: species-specific colonization and/or dispersal potential and species-specific vulnerability to extinction. If it was generated through colonization, then species colonize sites located at different distances from the common source (main river). Species with greater capacity for dispersal are able to cover longer distances, and colonize more distant sites, than those which are either less mobile or sedentary. The similarity between species at sites demonstrates a more or less strong negative relationship to the geographical distance between them. This pattern has been observed in freshwater ecosystems (Taylor & Warren Reference TAYLOR and WARREN2001). McAbendroth et al. (Reference MCABENDROTH, FOGGO, RUNDLE and BILTON2005) indicate that the species with more limited capacity for dispersal occupy fewer sites than the migrant species. In our study, the two most abundant species (Caquetaia kraussi and Cyphocharax magdalenae) are present in the 27 lakes in the study; they are floodplain specialists but are not migratory species (both have sedentary behaviour; Galvis & Mójica Reference GALVIS and MÓJICA2004). This admits the possibility that species-specific, non-biological factors exist.
Our results show that the similarity between the local assemblages depends on the distance between lakes; possibly relating to the colonization processes. Thomaz et al. (Reference THOMAZ, BINI and BOZELLI2007) recorded that during the flood season some fish species migrate from upper reaches to the floodplain after spawning, and fish communities tend to be more similar among the lakes that comprise a floodplain system.
The area hypothesis refers to the existence of a positive relationship between the number of species present in a given area and the size of this area (McArthur & Wilson Reference MCARTHUR and WILSON1963). Lubinski et al. (Reference LUBINSKI, JACKSON and EGGLETON2008) verified that lake surface area was one of the most important factors in the structuring of fish communities and local richness (Liu & Wang Reference LIU and WANG2010, Minns Reference MINNS1989, Sondergaard et al. Reference SONDERGAARD, JEPPESEN and JENSEN2005). Larger areas have higher rates of speciation and immigration, and lower rates of extinction. Neotropical freshwater faunas conform well to the species–area relationship (Tedesco et al. Reference TEDESCO, OBERDORFF, LASSO, ZAPATA and HUGUENY2005). In our study, the local richness manifest significant relationships with the size of the lake and shoreline development, possibly indicating that the dispersal assembly (through hydrological connectivity) is an important ecological factor.
A pattern consistently shown in biogeographic studies is a decrease in community similarity with increasing distance between two sampled sites (Qian Reference QIAN2010, Rosindell et al. Reference ROSINDELL, HUBBELL and ETIENNE2011). This decay is a manifestation of processes controlling community composition that operate across a gradient of scales. Community similarity at large scales tends to decrease environmental similarities, dispersal limitation and niche-width differences (Nekola & White Reference NEKOLA and WHITE1999). This relationship obtained suggested that seasonal colonization processes play an important role in fish floodplain assembly.
Lakes with a larger surface area comprise greater fish richness than smaller ones, and small lakes contain species with ample regional distribution and abundance. As already shown by Taylor & Warren (Reference TAYLOR and WARREN2001), species with high local abundances were better colonizers. The regularities observed in our study permit introduction of ecological aspects into the communities in these Neotropical floodplain rivers for purposes of development and planning strategies for biodiversity conservation (Gaston & Blackburn Reference GASTON and BLACKBURN2000).
ACKNOWLEDGEMENTS
This study was financed by the Spanish Agency for International Cooperation in Development (AECID, D/7500/07). We are grateful to CORMAGDALENA for supplying data and helping with fieldwork. We also thank ASOPESCA (Puerto Berrio, Colombia) and other fishermen of Magdalena Basin for field assistance. We are thankful to two anonymous reviewers for valuable comments on the manuscript.
Fish species collected (and codes used for Figure 2) during all sampling lakes of Magdalena River from November 2008 to 2010. Species with asterisks are migrant.