



%20--%3e%3c!DOCTYPE%20svg%20PUBLIC%20'-//W3C//DTD%20SVG%201.0//EN'%20'http://www.w3.org/TR/2001/REC-SVG-20010904/DTD/svg10.dtd'%3e%3csvg%20version='1.0'%20id='Layer_1'%20xmlns='http://www.w3.org/2000/svg'%20xmlns:xlink='http://www.w3.org/1999/xlink'%20x='0px'%20y='0px'%20width='64px'%20height='64px'%20viewBox='5.5%20-3.5%2064%2064'%20enable-background='new%205.5%20-3.5%2064%2064'%20xml:space='preserve'%3e%3cg%3e%3ccircle%20fill='%23FFFFFF'%20fill-opacity='0'%20cx='37.785'%20cy='28.501'%20r='28.836'/%3e%3cpath%20fill='%23595959'%20d='M37.441-3.5c8.951,0,16.572,3.125,22.857,9.372c3.008,3.009,5.295,6.448,6.857,10.314%20c1.561,3.867,2.344,7.971,2.344,12.314c0,4.381-0.773,8.486-2.314,12.313c-1.543,3.828-3.82,7.21-6.828,10.143%20c-3.123,3.085-6.666,5.448-10.629,7.086c-3.961,1.638-8.057,2.457-12.285,2.457s-8.276-0.808-12.143-2.429%20c-3.866-1.618-7.333-3.961-10.4-7.027c-3.067-3.066-5.4-6.524-7-10.372S5.5,32.767,5.5,28.5c0-4.229,0.809-8.295,2.428-12.2%20c1.619-3.905,3.972-7.4,7.057-10.486C21.08-0.394,28.565-3.5,37.441-3.5z%20M37.557,2.272c-7.314,0-13.467,2.553-18.458,7.657%20c-2.515,2.553-4.448,5.419-5.8,8.6c-1.354,3.181-2.029,6.505-2.029,9.972c0,3.429,0.675,6.734,2.029,9.913%20c1.353,3.183,3.285,6.021,5.8,8.516c2.514,2.496,5.351,4.399,8.515,5.715c3.161,1.314,6.476,1.971,9.943,1.971%20c3.428,0,6.75-0.665,9.973-1.999c3.219-1.335,6.121-3.257,8.713-5.771c4.99-4.876,7.484-10.99,7.484-18.344%20c0-3.543-0.648-6.895-1.943-10.057c-1.293-3.162-3.18-5.98-5.654-8.458C50.984,4.844,44.795,2.272,37.557,2.272z%20M37.156,23.187%20l-4.287,2.229c-0.458-0.951-1.019-1.619-1.685-2c-0.667-0.38-1.286-0.571-1.858-0.571c-2.856,0-4.286,1.885-4.286,5.657%20c0,1.714,0.362,3.084,1.085,4.113c0.724,1.029,1.791,1.544,3.201,1.544c1.867,0,3.181-0.915,3.944-2.743l3.942,2%20c-0.838,1.563-2,2.791-3.486,3.686c-1.484,0.896-3.123,1.343-4.914,1.343c-2.857,0-5.163-0.875-6.915-2.629%20c-1.752-1.752-2.628-4.19-2.628-7.313c0-3.048,0.886-5.466,2.657-7.257c1.771-1.79,4.009-2.686,6.715-2.686%20C32.604,18.558,35.441,20.101,37.156,23.187z%20M55.613,23.187l-4.229,2.229c-0.457-0.951-1.02-1.619-1.686-2%20c-0.668-0.38-1.307-0.571-1.914-0.571c-2.857,0-4.287,1.885-4.287,5.657c0,1.714,0.363,3.084,1.086,4.113%20c0.723,1.029,1.789,1.544,3.201,1.544c1.865,0,3.18-0.915,3.941-2.743l4,2c-0.875,1.563-2.057,2.791-3.541,3.686%20c-1.486,0.896-3.105,1.343-4.857,1.343c-2.896,0-5.209-0.875-6.941-2.629c-1.736-1.752-2.602-4.19-2.602-7.313%20c0-3.048,0.885-5.466,2.658-7.257c1.77-1.79,4.008-2.686,6.713-2.686C51.117,18.558,53.938,20.101,55.613,23.187z'/%3e%3c/g%3e%3c/svg%3e)
%20--%3e%3c!DOCTYPE%20svg%20PUBLIC%20'-//W3C//DTD%20SVG%201.0//EN'%20'http://www.w3.org/TR/2001/REC-SVG-20010904/DTD/svg10.dtd'%3e%3csvg%20version='1.0'%20id='Layer_1'%20xmlns='http://www.w3.org/2000/svg'%20xmlns:xlink='http://www.w3.org/1999/xlink'%20x='0px'%20y='0px'%20width='64px'%20height='64px'%20viewBox='5.5%20-3.5%2064%2064'%20enable-background='new%205.5%20-3.5%2064%2064'%20xml:space='preserve'%3e%3cg%3e%3ccircle%20fill='%23FFFFFF'%20fill-opacity='0'%20cx='37.637'%20cy='28.806'%20r='28.276'/%3e%3cg%3e%3cpath%20fill='%23595959'%20d='M37.443-3.5c8.988,0,16.57,3.085,22.742,9.257C66.393,11.967,69.5,19.548,69.5,28.5c0,8.991-3.049,16.476-9.145,22.456%20C53.879,57.319,46.242,60.5,37.443,60.5c-8.649,0-16.153-3.144-22.514-9.43C8.644,44.784,5.5,37.262,5.5,28.5%20c0-8.761,3.144-16.342,9.429-22.742C21.101-0.415,28.604-3.5,37.443-3.5z%20M37.557,2.272c-7.276,0-13.428,2.553-18.457,7.657%20c-5.22,5.334-7.829,11.525-7.829,18.572c0,7.086,2.59,13.22,7.77,18.398c5.181,5.182,11.352,7.771,18.514,7.771%20c7.123,0,13.334-2.607,18.629-7.828c5.029-4.838,7.543-10.952,7.543-18.343c0-7.276-2.553-13.465-7.656-18.571%20C50.967,4.824,44.795,2.272,37.557,2.272z%20M46.129,20.557v13.085h-3.656v15.542h-9.944V33.643h-3.656V20.557%20c0-0.572,0.2-1.057,0.599-1.457c0.401-0.399,0.887-0.6,1.457-0.6h13.144c0.533,0,1.01,0.2,1.428,0.6%20C45.918,19.5,46.129,19.986,46.129,20.557z%20M33.042,12.329c0-3.008,1.485-4.514,4.458-4.514s4.457,1.504,4.457,4.514%20c0,2.971-1.486,4.457-4.457,4.457S33.042,15.3,33.042,12.329z'/%3e%3c/g%3e%3c/g%3e%3c/svg%3e)
1. Introduction
Open cavity oscillations occur in many ground and airborne transport vehicles, like wheel casings or bogeys, and significantly contribute to aerodynamic drag and noise. Active model-based control has been applied with large success to the stabilization of these oscillations (Rowley & Williams Reference Rowley and Williams2006; Sipp et al. Reference Sipp, Marquet, Meliga and Barbagallo2010). In this study, we aim at fast self-learning feedback which simplifies the development of control and extends the applicability to nonlinear dynamics. Encouraged by results for wake stabilization (Cornejo Maceda et al. Reference Cornejo Maceda, Li, Lusseyran, Morzyński and Noack2021), we apply gradient-enriched machine learning control to an experiment.
Open cavity flows typically feature mono-mode and multi-frequency regimes depending on the configuration. The oscillatory dynamics gathers most of the mechanisms responsible for nonlinear turbulence interactions. Yet, the self-organization of the spatial structures is still highly coherent and driven by global instability (Huerre & Rossi Reference Huerre and Rossi1998). Our configuration has a moderate Reynolds number ( $Re_L\approx 10^4$). The length-to-depth ratio is approximately 1.7 and thus between a shallow and deep cavity. With increasing incoming velocity an open cavity successively features, first an intra-cavitary centrifugal instability then self-sustained oscillation of the mixing layer (Rowley & Williams Reference Rowley and Williams2006; Basley et al. Reference Basley, Pastur, Lusseyran, Soria and Delprat2014; Feger, Lusseyran & Pastur Reference Feger, Lusseyran and Pastur2019). The dynamics of the interaction between an incoming boundary layer and a rectangular cavity depends on six parameters: the ratios of the three spatial dimensions of the cavity (in particular the length
 $L$ and depth
 $D$ of the cavity), the momentum boundary layer thickness
 $\theta _0$ at the upstream edge, the incoming velocity
 $U_\infty$ and the Mach number for compressible flows. By focussing on the two main characteristic numbers,
 $L/D$ and
 $Re_L=U_\infty L / \nu$ it is possible to scan a wide range of dynamics, from a single mode regime to spectra with rich dynamics including coupled modes (Kegerise et al. Reference Kegerise, Spina, Garg and Cattafesta2004). This, in addition to the practical implications, is the reason for the repeated interest in this flow pattern from pioneering work (Rossiter Reference Rossiter1964; Gharib & Roshko Reference Gharib and Roshko1987) to the present day.
Current studies of the cavity focus on a wide range of industry applications. In the transport field, due to engineering and manufacturing constraints, most ground and airborne transport vehicles include cavities, e.g. wheel casings and bogeys, whose interaction with low- or high-speed flows is responsible for parasitic drag and flow-induced noise. For German high-speed trains, the underbody with cavities account for 61 % of the aerodynamic drag and the gaps between the wagons for another 5 % (Hucho Reference Hucho2002). At high speeds such as 300 km h $^{-1}$, noise is increased by more than 14 dB due to cavity fluctuations (Wang et al. Reference Wang, Sun, Guo and Tang2014). Landing gear bays on passenger airplanes produce strong noise and represent up to 30 % of the total noise (Li et al. Reference Li, Ye, Wan, Liu, Sun and Lu2020). For low-speed transports such as cars, the airflow can excite flow oscillations in the cavity to form resonance and noise sources, resulting in body resistance and noise nuisance for the passengers (Kook et al. Reference Kook, Mongeau, Brown and Zorea1997). Hence, cavity flow control is of large engineering interest.
The control of the cavity relies on the mitigation of the mixing layer by suppressing the feedback mechanism between the vortex formation and the impinging vortex recirculation flow. The control can be achieved in a passive manner by modifying the geometry of the configuration or in an active manner by injection energy to the flow. Passive devices for control include fences, spoilers, ramps, cylinders, rods (Stanek et al. Reference Stanek, Ross, Odedra and Peto2003; Ukeiley et al. Reference Ukeiley, Ponton, Seiner and Jansen2004; Keirsbulck et al. Reference Keirsbulck, El Hassan, Lippert and Labraga2008; Panickar & Raman Reference Panickar and Raman2008; El Hassan & Keirsbulck Reference El Hassan and Keirsbulck2017). Modifications of the cavity leading edge affect the shear-layer formation (Ahuja & Mendoza Reference Ahuja and Mendoza1995) and also the trailing edge to reduce the sound wave generation at the impinging point (Pereira & Sousa Reference Pereira and Sousa1994). Porous walls have also been employed to reduce the feedback excitation near the leading and trailing edges (Wilcox Reference Wilcox1988; Stallings et al. Reference Stallings, Plentovich, Tracy and Hemsch1994). However, most passive devices imply parasitic drag during cruise.
On the other hand, active control may improve performance with low intrusion into the flow, a large frequency bandwidth and the ability to adapt to the flow response. Noteworthy examples of model-free open-loop control include the stabilization of the laminar flow with high-frequency forcing (Sipp Reference Sipp2012; Kreth & Alvi Reference Kreth and Alvi2020) and pressure fluctuation mitigation for supersonic flows based on resolvent analysis (Liu et al. Reference Liu, Sun, Yeh, Ukeiley, Cattafesta and Taira2021). In contrast, most closed-loop controls rely on models as a simple representation of the dynamics. For instance, Barbagallo, Sipp & Schmid (Reference Barbagallo, Sipp and Schmid2009) develop a Galerkin model with global modes of the flow that preserves the input–output behaviour. As a further example, Nagarajan et al. (Reference Nagarajan, Singha, Cordier and Airiau2018) achieved noise reduction with a reduced-order model including the control effect. For quasi-periodic dynamics, an iterative method for weakly nonlinear modelling was able to completely stabilize the flow (Leclercq et al. Reference Leclercq, Demourant, Poussot-Vassal and Sipp2019).
Feedback controllers based on linear models have also been successfully employed to mitigate the oscillations of the flow (Illingworth, Morgans & Rowley Reference Illingworth, Morgans and Rowley2012) and noise suppression (Rowley et al. Reference Rowley, Williams, Colonius, Murray and Macmynowski2006). Finally, we note one of the very first and remarkable closed-loop control studies by Gharib, Roshko & Sarohia (Reference Gharib, Roshko and Sarohia1985) on an open cavity in a water canal. We refer to Cattafesta et al. (Reference Cattafesta, Song, Williams, Rowley and Alvi2008) for a review of past successes of active flow control on the cavity. A well-known effect of linear control is the shift of the oscillations of the cavity to other Rossiter modes (Williams et al. Reference Williams, Drazen, Iwanski and Morrow2000; Cabell et al. Reference Cabell, Kegerise, Cox and Gibbs2002) resulting in multi-frequency regimes. Mode-switching regimes present a challenge for control design as it needs to include large bandwidths and an adequate time response (Samimy et al. Reference Samimy, Kim, Kastner, Adamovic and Utkin2007b). Linear closed-loop control on an experimental cavity for multi-frequency control has been achieved by augmenting the controller with well-placed zeros (Yan et al. Reference Yan, Debiasi, Yuan, Little, Ozbay and Samimy2006). Samimy et al. (Reference Samimy, Kim, Kastner, Adamovic and Utkin2007b) manage to control multiple frequencies by incorporating several models in linear–quadratic optimal controllers.
Building a control-oriented model is often limited due to the nonlinearities of the flow including frequency cross-talk and time delays between the actuation and sensing. Therefore, we choose model-free approaches based on machine learning to achieve multi-modal control. Machine learning control (Duriez, Brunton & Noack Reference Duriez, Brunton and Noack2017; Cornejo Maceda, Lusseyran & Noack Reference Cornejo Maceda, Lusseyran and Noack2022, MLC) based on genetic programming (Dracopoulos Reference Dracopoulos1997) is employed to build feedback control laws mapping the outputs of the system (sensor signals) to its inputs (actuation commands). The MLC is a function optimizer able to optimize both the structure of the control law and its parameters. In an evolutionary process, new mechanisms (exploration) are found and are improved (exploitation). The MLC has been successfully applied in dozens of experiments, each time outperforming optimized control methods often by exploiting unexpected nonlinear mechanisms (Noack Reference Noack2019). The MLC achievements include drag reduction of the Ahmed body with and without yaw angle (Li et al. Reference Li, Noack, Cordier, Borée, Kaiser and Harambat2018, Reference Li, Borée, Noack, Cordier and Harambat2019), jet mixing enhancement (Zhou et al. Reference Zhou, Fan, Zhang, Li and Noack2020) and mixing layer control (Parezanović et al. Reference Parezanović, Cordier, Spohn, Duriez, Noack, Bonnet, Segond, Abel and Brunton2016), separation control of a turbulent boundary layer (Debien et al. Reference Debien, von Krbek, Mazellier, Duriez, Cordier, Noack, Abel and Kourta2016), recirculation zone reduction behind a backward facing step (Gautier et al. Reference Gautier, Aider, Duriez, Noack, Segond and Abel2015), reduction of vortex-induced vibration of a cylinder (Ren, Wang & Tang Reference Ren, Wang and Tang2019; Ren, Hu & Tang Reference Ren, Hu and Tang2020) and pitch control for floating offshore wind turbines (Kane Reference Kane2020). Recently, MLC has been augmented with intermediate gradient descent steps for a fast descent into minima (Cornejo Maceda et al. Reference Cornejo Maceda, Li, Lusseyran, Morzyński and Noack2021, gMLC).
This study constitutes, to the best of the authors’ knowledge, the first self-learning model-free control for the stabilization of open cavity flows. We employ our fastest optimizer, gradient-enriched MLC (gMLC), to address the challenge of robust multi-frequency stabilization. For this, feedback control laws are learned in two regimes: a narrow-bandwidth one and a mode-switching one. The second regime constitutes a challenging problem as gMLC needs to learn a control law able to control two modes simultaneously. The robustness of the laws is tested by cross-evaluating each law in the other regime.
The article is organized as follows. Section 2 introduces the cavity experiment set-up including the wind tunnel, sensing, actuation and details the characteristics of the unforced dynamics. Section 3 describes the control problem, including the cost function and the ansatz for the control law and outlines gMLC. Moreover, two methods to interpret the control mechanisms are presented: an analytical approximation based on an affine regression and a cluster-based visualization method based on representative flow states. In § 4, the results of the control of the open cavity are described, from steady forcing as a benchmark to gMLC feedback. Section 5 discusses the robustness of the gMLC laws, highlights the necessity for feedback and comments on the global nature of the achieved stabilization. Section 6 summarizes the results and indicates directions for future research. Table 1 lists all the acronyms used in the article.
Table of acronyms.

2. The open cavity experiment
This section details the characteristics of the wind tunnel, the means of sensing and actuation, the control unit and finally the unforced dynamics for the two regimes studied in this article: the narrow-bandwidth regime and the mode-switching regime.
2.1. Wind tunnel set-up
The cavity is inserted into the rectangular cross-section duct of a 0.075 m high and 0.30 m wide wind tunnel. The cavity, inserted as a depression to the floor, is  $D = 0.05$ m deep,
 $S=0.30$ m wide and
 $L = 0.075$ m or
 $L = 0.0875$ m long following the studied regime. The resulting aspect ratios are
 $R = L/D = 1.5$ for the narrow-bandwidth regime and
 $R = L/D = 1.75$ for the mode-switching regime. A schematic of the wind tunnel is depicted in figure 1. The walls are made of anti-reflection treated glass. A Blasius-type boundary layer develops from an elliptical edge located 0.30 m upstream. Laser Doppler velocimetry (LDV) measurements of the velocity upstream of the cavity show that the standard deviation of the incoming flow is less than 1 %.
Diagram of the cavity with the position of the DBD actuator (in red) and the velocity sensor (in green). The magnified region depicts the velocity profiles of the incoming velocity ( $U(y)$ in blue) and the ionic wind produced by the DBD actuator (
 $U_p(y)$ in red).

An anemometer is located at the exit of the open wind tunnel vein. Measurements show that the free-stream velocity  $U_{\infty }$ and the velocity measured at the exit of the tunnel vein are linearly related to the rotation speed of the wind tunnel fan motor. Thus, in this study,
 $U_{\infty }$ is estimated from the anemometer measurements. For the narrow-bandwidth regime, the incoming velocity is set to
 $U_{\infty } = 2.13$ m s
 $^{-1}$, resulting in a Reynolds number equal to
 $Re_L = 1.04 \times 10^4$. The momentum boundary layer thickness is estimated at
 $\theta _0/L=1.17 \times 10^{-2}$. Great care has been taken to calibrate and regulate the incoming velocity regarding LDV measurements. However, we have observed a 2 % variation of the incoming velocity for the narrow-bandwidth regime over the 24 hours necessary for the longest learning sessions. The velocity variations are caused by the temperature variation,
 $T\approx 23.14 \pm 2\,^\circ$C and very low cycle frequencies in the wind tunnel at this low-velocity operating point. The incoming velocity variations reach 5 % for the mode-switching regime. Finally, the flow is in the incompressible range with a Mach number less than
 $10^{-2}$. A more detailed description of the set-up can be found in Lusseyran, Pastur & Letellier (Reference Lusseyran, Pastur and Letellier2008) and Basley et al. (Reference Basley, Pastur, Delprat and Lusseyran2013).
2.2. Hot-wire sensor
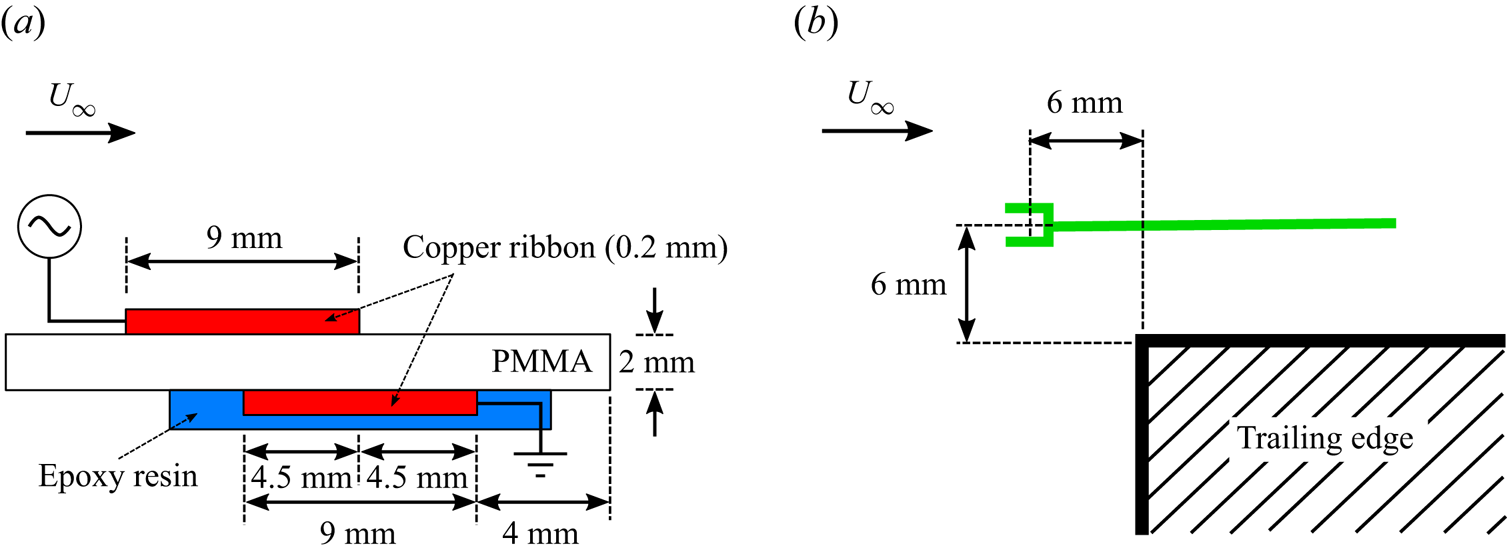
For sensing, we use a constant temperature anemometer (DANTEC hot-wire probe 55P16 and miniCTA54T30 converter) with a single one-dimensional (1-D) hot-wire sensor,  $5\ \mathrm {\mu }$m in diameter and 1 mm length. The hot-wire is located at 6 mm above the cavity and 6 mm upstream of the trailing edge, as sketched in green in figures 1 and 2(b). The position of the hot-wire sensor has also been chosen to limit the velocity drops in the mode-switching regime, see § 2.5. The hot-wire output signal
 $E_{w}(t)$ is converted into streamwise velocity information
 $u$ according to King's law
 \begin{equation} E_{w}^2 = A + Bu^n, \end{equation}
where  $A = 1.28$,
 $B = 0.70$ and
 $n = 0.48$ are determined by calibration of the hot-wire using an LDV anemometer. Before conversion, the signal
 $E_{w}$ is temperature corrected by the multiplicative factor
 $(T_w-T_0)/(T_w-T)$, where
 $T$ is the room temperature,
 $T_0$ is the calibration temperature and
 $T_w$ is the wire temperature (Jørgensen Reference Jørgensen2005);
 $T$ and
 $T_0$ are both measured with a
 $P_{t100}$ platinum sensor with
 $0.02\,^\circ$C accuracy. The velocity measured
 $u$ is then employed in three ways: first, it serves to compute the performance of the tested controllers (§ 3.1); second, it closes the feedback control loop (§ 3.2); third, it is used to analyse the control mechanisms (§ 3.4). All the following spectra and spectrograms are computed from this velocity measurement.
The actuation is performed with a DBD actuator placed upstream (a) and the current state of the flow is given by a hot-wire probe downstream (b).
2.3. Plasma actuator
The actuation is carried out with a dielectric barrier discharge (DBD) actuator to locally force the boundary layer at the entrance of the cavity, near the separation edge where the receptivity of the shear layer is maximum (Cattafesta et al. Reference Cattafesta, Garg, Choudhari and Li1997) (see figure 1). The DBD consists of two conductive blades placed on either side of an insulating plate and is subjected to a high alternating voltage. The streamwise shift between the two blades (see figure 2a) creates an electric field parallel to the plate and is responsible for an ionic wind in the streamwise direction. The principle and the adjustment of the parameters for an application as a fluid actuator are thoroughly detailed in Moreau (Reference Moreau2007), Forte et al. (Reference Forte, Jolibois, Pons, Moreau, Touchard and Cazalens2007) and Benard et al. (Reference Benard, Moreau, Griffin and Cattafesta2010). In our experimental set-up, the dielectric is made of 2 mm-thick acrylic glass or poly(methyl methacrylate) (PMMA) and the electrodes are made of 9 mm-wide, 26 cm-long and  $200\ \mathrm {\mu }$m-thick copper ribbons. The downstream edge of the lower electrode is placed at
 $x=4$ mm upstream to the leading edge, see figure 2(a).
To produce an ionic wind, a carrying signal  $E(t)$ at high frequency
 $f_p$
 $({\approx }3\ {\rm kHz})$ is sent to the active electrode. The signal
 $E(t)$ is produced by an Agilent Function Generator and amplified (
 $\times 3000$) by a Trek high-voltage amplifier. The expression of the carrying signal is
 \begin{equation} E(t) =A(t) \sin(2{\rm \pi} f_pt), \end{equation}
with  $A$ being the amplitude of the carrying signal. The control is then achieved by modulation of the amplitude
 $A$ through the actuation command
 $b \in [-1,1]$. In practice,
 $A$ is an affine function of
 $b$ such as
 $A|_{b=-1} = A_{min}$ and
 $A|_{b=1}=A_{max}$;
 $A_{min}$ is the ionization voltage, the threshold above which an ionic wind is produced. The generated wind acts then as a localized body force whose intensity increases with the voltage and thus with
 $b$. The increasing level of the body force results in the reduction of the main peak of the power spectrum until the dynamics is completely modified. A steady actuation forcing study of the open cavity flow is reported in § 4.1;
 $A_{max}$ is defined as the maximum voltage that ensures that the main resonance of the cavity is present in the power spectrum.
In practice,  $A_{min}$ and
 $A_{max}$ are measured before each experiment as they are sensible to the atmospheric pressure, room temperature, moisture and number of hours of use of the electrode. To make the control robust against these variations, the range of the actuation command
 $b$ is set independent of
 $A_{min}$ and
 $A_{max}$.
Forte et al. (Reference Forte, Jolibois, Pons, Moreau, Touchard and Cazalens2007) and Moreau (Reference Moreau2007) describe the typical velocity profile generated by a DBD actuator with LDV measurements. In particular, Forte et al. (Reference Forte, Jolibois, Pons, Moreau, Touchard and Cazalens2007) show that for a voltage of  $20$ kV and a carrying frequency of
 $1\ {\rm kHz}$ applied between
 $0.1$ mm-thick,
 $20$ cm-long aluminium electrodes, the velocity profile displays a maximum at
 $y=0.5$ mm from the wall. As the velocity profile moves downstream, the value of the maximum velocity decreases, and its height increases up to
 ${\sim }1$ mm. For our experiment, Pitot measurements indicate that, for a tension equal to
 $6$ kV, the maximum velocity is around
 $0.8$ m s
 $^{-1}$ and is reached at
 $y=1.25$ mm of the wall. Unfortunately, the tension value is not significant as
 $A_{min}$ and
 $A_{max}$ have changed between two experiments.
2.4. Control unit
In our experiment, the signal acquisitions and actuation command are carried out by a dSPACE real-time controller, including a DS1600 4 core processor board and a DS2201 input/output (I/O) board with 12 bits on a  ${\pm }10$ V range analogue-to-digital converter. Only two inputs of the I/O board are exploited, one for the hot-wire signal and one for the voltage delivered by the
 $P_{t100}$ platinum sensor. The hot-wire signal
 $E_w$ is translated and amplified (
 $\times 40$) before analogue-to-digital conversion. All signals are sampled at
 $250$ Hz such that the Nyquist–Shannon sampling theorem is respected up to three times the highest frequency of interest
 $f^+\approx 40$ Hz, also avoiding aliasing of the second harmonics. One output of the I/O board is employed to send the command signal to the Agilent Function Generator.
The control optimization process includes two loops: a fast evaluation loop and a slow learning loop, see figure 9. The fast evaluation loop is managed by the ControlDesk software and Simulink. For our study, the evaluation loop operates at the sampling frequency ( $250$ Hz). For each control law tested, the time series of the actuation command and the hot-wire signal are recorded and post-processed with MATLAB. The slow learning loop includes the post-processing of the control and the control law update; it is automated with Python and MATLAB scripts. Finally, the whole control unit is supervised by a PowerShell script that automates all the steps of the control optimization.
2.5. Unforced dynamics
As described in § 1, the cavity allows a wide range of complex intra-cavity dynamics by tuning the two remaining cavity flow parameters, namely the upstream speed  $U_\infty$ and the width
 $L$. We recall that the width
 $S$ and the depth
 $D$ of the cavity are fixed throughout this study and that the flow is incompressible (Mach number
 ${<}10^{-2}$). In this article, we aim to stabilize two different flow regimes of different dynamical complexity. For both regimes, the power spectrum is mainly organized within five frequency bands: the very low frequencies, not considered here, a low frequency
 $f_b$ and the three peaks directly reflecting the resonance of the mixing layer
 $f^-$,
 $f_a$ and
 $f^+$, see figure 3. These frequencies are nonlinearly coupled and satisfy the relationships
 $f^-= f_a - f_b$ and
 $f^+ = f_a+f_b$. The two regimes studied differs by the power ratios of the frequencies
 $f_a$ and
 $f^+$.
Time series (top) and spectral content (bottom) of the velocity measured downstream for the two unforced regimes. The main frequencies of the flow are depicted in red:  $f_b$,
 $f^-$,
 $f_a$,
 $f^+$ and
 $f_a$ harmonics. The vertical axis of the spectral plots are in
 $\log _{10}$ scale. The cost function (see § 3.2) detects the maximum peak in the green-shaded window
 $St \in [0.5,1.75]$. (a) Narrow-bandwidth regime and (b) mode-switching regime.
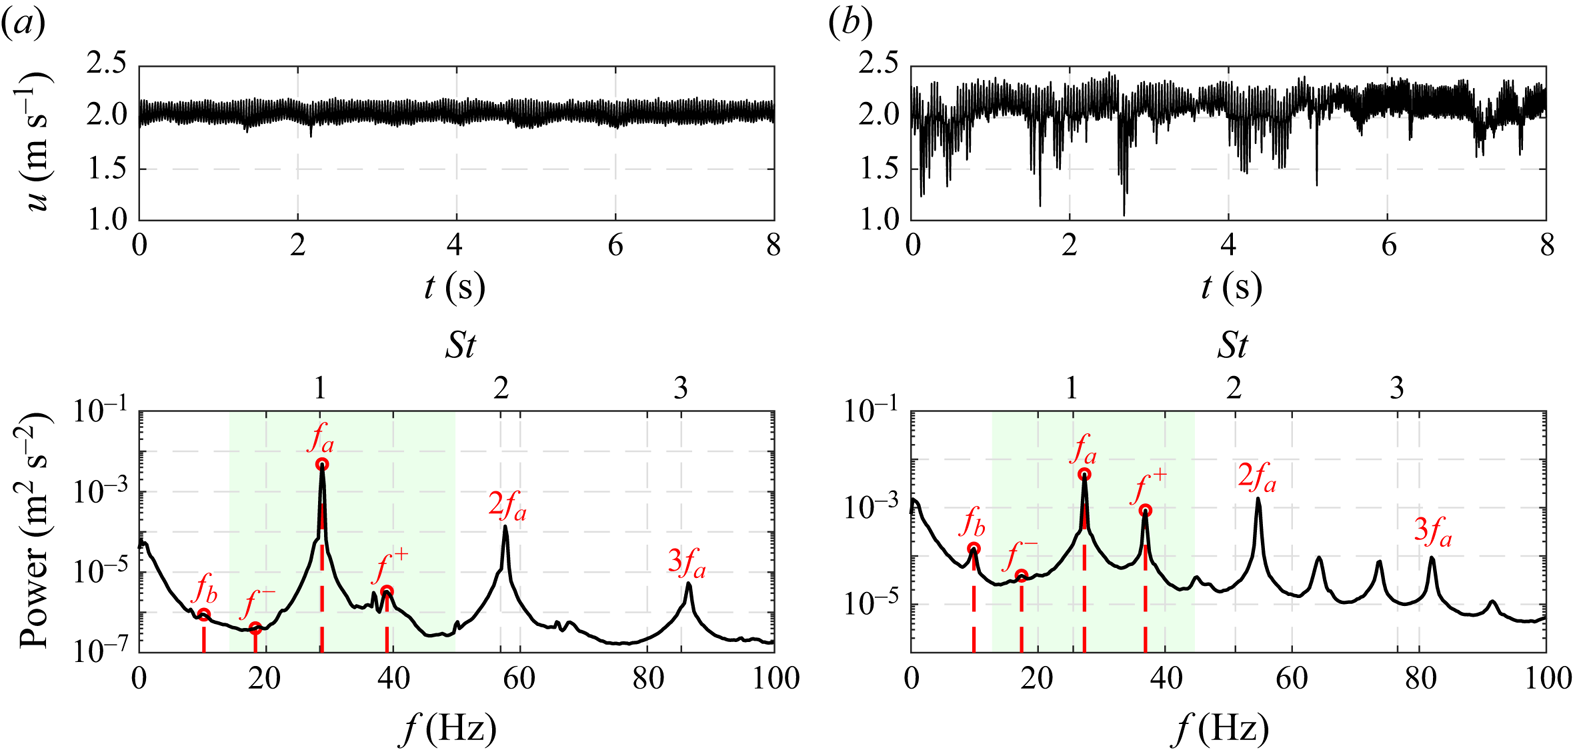
The first regime is referred to as the narrow-bandwidth regime and corresponds to a flow dynamics mainly centred on a single frequency  $f_a$ and its harmonics. This regime is achieved with
 $L=7.50$ cm and with an incoming velocity of
 $U_{\infty }=2.13$ m s
 $^{-1}$. For this case, the ratio of the powers associated with
 $f^+$ and
 $f_a$ is close to
 $10^{-3}$, see figure 3(a). The coupling between
 $f_a$ and
 $f_b$ is then insignificant. In contrast, for the second regime, referred to as the mode-switching regime, the power ratio between
 $f^+$ and
 $f_a$ is greater than
 $0.22$, see figure 3(b). In this case, the nonlinear couplings between frequencies are strong and lead to a chaotic intermittency between
 $f_a$ and
 $f^+$ (Lusseyran et al. Reference Lusseyran, Pastur and Letellier2008). In the mode-switching regime, two modes compete in the flow leading to a switch of the dominant frequency. Such intermittency has been mentioned for the first time by Kegerise et al. (Reference Kegerise, Spina, Garg and Cattafesta2004) for a compressible cavity flow. In this study, the mode-switching regime is obtained for incompressible conditions (
 ${Ma}<0.01$) for
 $L=8.75$ cm and a slightly higher incoming velocity
 $U_{\infty }=2.23$ m s
 $^{-1}$, corresponding to a Reynolds number
 $Re_L=1.28\times 10^{-4}$. The momentum boundary layer thickness is estimated at
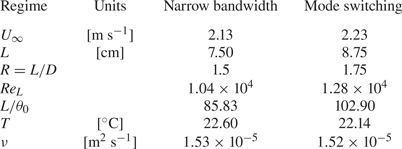
 $\theta _0/L=9.72\times 10^{-3}$. All the cavity flow parameters and experimental conditions are grouped in table 2.
Cavity flow parameters and experimental conditions for the two studied regimes. The temperature  $T$ and kinematic viscosity
 $\nu$ values are averaged over the learning session.
The episodic velocity drops, observed in the time series of the mode-switching regime (figure 3b), are due to slow vertical undulations of the mixing layer which bring the low velocities of the lower part of the mixing layer to the level of the measurement point. The position of the hot-wire sensor has been chosen to minimize these low-velocity incursions while limiting the damping of the oscillations to be controlled. The undulations of the mixing layer are stronger for the mode-switching regime, and the incursions could not be avoided. The presence of these incursions suggests a strong interaction between the mixing layer and the slower intra-cavitary flow for the mode-switching regime.
The temporal evolution of the frequency content for the two regimes is depicted in figure 4. In particular, figure 4(a) shows a clear line for the frequency  $f_a$ and less intense lines for its harmonics, whereas figure 4(b) displays a switching between frequencies
 $f_a$ and
 $f^+$ and their harmonics over time. The time between two switches is estimated between
 $15$ and
 $20$ s; Exceptionally, this time may exceed
 $40$ s.
Spectrograms of the downstream velocity for the two studied regimes. The colour code corresponds to the power level in  $\log _{10}$scale. The ticks of the colour bar are the exponent values. (a) Narrow-bandwidth regime and (b) mode-switching regime.

To understand the difference in dynamics between the two regimes, we locate them in the Strouhal vs  $L/\theta _0$ map (figure 5). Similar maps have been plotted for different impinging shear flows revealing jumps between the modes and linear-like relationships between the Strouhal number and the dimensionless cavity length
 $L/\theta _0$ or
 $L/\delta _0$,
 $\delta _0$ being the boundary layer thickness (Sarohia Reference Sarohia1977; Rockwell & Naudascher Reference Rockwell and Naudascher1978; Knisely & Rockwell Reference Knisely and Rockwell1982). Indeed, Basley et al. (Reference Basley, Pastur, Delprat and Lusseyran2013) shows that, in such incompressible flow, most main frequencies measured in the downstream shear layer align with lines of locked-on modes such that the Strouhal number based on
 $L$ is given by
 \begin{equation} St^{L}_{n}(L/\theta_0)=\frac{f_n L}{U_\infty} =\frac{n-\gamma_n(L/\theta_0)}{2},\end{equation}
where the parameter  $n = 1, 2, 3$ can be seen as the number of cycles within the cavity length, and the corrective term,
 $\gamma _n$, can be interpreted as a wave adaptation to the effective resonance length. The authors also propose a model for
 $\gamma _n$, linear with respect to the dimensionless cavity length
 $L/\theta _0$
 \begin{equation} \gamma_n(L/\theta_0)=\frac{41n-L/\theta_0}{10(17-n)}.\end{equation}
On the other hand, (2.3) presents a resemblance with Rossiter's formula for compressible flows in Rossiter (Reference Rossiter1964) where the corrective term is associated with the propagation time of the acoustic waves.
Strouhal number ( $St^{L}$) – dimensionless cavity length (
 $L/\theta _0$) map,
 $\theta _0$ being the momentum boundary layer thickness and
 $L$ the cavity length. Black lines represent the locus of (2.3) for locked-on modes
 $n=1,2,3$. Black dashed lines represent the locus of (2.3) without the corrective term
 $\gamma _n$:
 $St^{L}_{n}=n/2$. The left green band corresponds to the operating point for the narrow-bandwidth regime (
 $L/\theta _0=85.83$). The right green band corresponds to the operating point for the mode-switching regime (
 $L/\theta _0=102.90$). The red dots symbolize the three main oscillation modes of the mixing layer. For more details see Appendix B).

The Strouhal distribution is well described by Basley et al. (Reference Basley, Pastur, Delprat and Lusseyran2013), however, it is worth noting that there is still no consensual overview of the origin of the incommensurable frequencies in incompressible open cavity flows. As a first interpretation, the peaks in the spectrum are the result of nonlinear interactions inside the mixing layer dynamics. Indeed, the resonance of the cavity occurs for regimes beyond a critical Reynolds number  $Re_c$ in contrast to the Kelvin–Helmholtz instability of the mixing layer that is unstable for all Reynolds numbers. Beyond
 $Re_c$, self-sustained oscillations appear. This scenario originating from a two-dimensional (2-D) perspective is, however, a little simplistic when considering a real 3-D cavity, especially in an incompressible regime at moderate Reynolds number. In fact, the mixing layer develops in the streamwise direction and, the flow not being strictly parallel, Squire's theorem fails: it is the transverse centrifugal instabilities that transit first, possibly several times, below
 $Re_c$. With increasing Reynolds number, the centrifugal Görtler–Taylor-type instabilities feature first several bifurcations and then a strong nonlinear development before the cavity resonance. This transition scenario is valid for the two studied regimes whose spectral signature has been described previously and in Appendix A.
In addition, Sipp & Lebedev (Reference Sipp and Lebedev2007) and Meliga (Reference Meliga2017) have shown, using a linearization around the average flow in 2-D simulations, that the occurrence of self-sustaining instabilities in shear-driven cavities is due to a supercritical Hopf bifurcation. Following a similar method, Bengana et al. (Reference Bengana, Loiseau, Robinet and Tuckerman2019) and Tuerke et al. (Reference Tuerke, Sciamarella, Pastur, Lusseyran and Artana2015) manage to predict two incommensurable frequencies in simulations and experiments, respectively. Another approach based on the identification of two characteristic delay times can predict the two frequencies of the flow (Tuerke et al. Reference Tuerke, Lusseyran, Sciamarella, Pastur and Artana2020). The authors show that the nonlinear interactions between these two frequencies can be captured by the resolution of a Stuart–Landau-type amplitude equation, whose quadratic damping term consists of two delayed amplitude terms. In this equation, the first delay time characterizes the upstream travelling hydrodynamic instability wave and hence the feedback of the reflected shear-layer instability (Tuerke et al. Reference Tuerke, Sciamarella, Pastur, Lusseyran and Artana2015). The second delay time is motivated by the hydrodynamic feedback of the recirculating vortices, also referred to as ‘vortex carousel’ and corresponds to an intra-cavity overturning time (Tuerke et al. Reference Tuerke, Pastur, Fraigneau, Sciamarella, Lusseyran and Artana2017). In the following, the description of Basley et al. (Reference Basley, Pastur, Delprat and Lusseyran2013) that leads to figure 5 is sufficient to guide the choice of parameters leading to the two regimes we have chosen to control.
Figure 5 plots the values of the measured frequencies in Strouhal number vs the dimensionless cavity length, for the two regimes and their relation to the resonance points. The computation details of the momentum boundary layer thickness  $\theta _0$ are detailed below. For the first regime,
 $f_a$ is close to a Strouhal number equal to
 $n/2|_{n=2}$, i.e. at the intersection between the black line and the dashed line, while
 $f^+$ is clearly below the resonance at
 $n=3$. As for the second regime, the Strouhal number corresponding to
 $f_a$ is above the resonant mode
 $n=2$ (
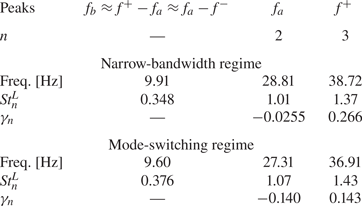
 $\gamma _2=-0.14$), and the one corresponding to
 $f^+$ is below the resonant mode
 $n=3$ (
 $\gamma _3=+0.14$). In practice,
 $U_\infty$ has been chosen such that the average presence rate of the two frequencies
 $f_a$ and
 $f^+$ is equalized. The fact that
 $\lvert \gamma _2 \rvert \approx \lvert \gamma _3 \rvert$ only appears after calculation shows clearly that the parameter guiding the relative intensity of the two main modes is indeed
 $\lvert \gamma _n \rvert$. The values of Strouhal number and
 $\gamma _n$ for each frequency are grouped in table 3.
Characteristics of the regimes dynamics. Values of the measured frequencies  $f_b$,
 $f_a$ and
 $f^+$ and their corresponding Strouhal numbers
 $St_n^L$. The corrective term
 $\gamma _n$ is then computed from (2.3).
In fact, we observe a slight discrepancy between the natural frequencies measured and the predictions of Basley et al. (Reference Basley, Pastur, Delprat and Lusseyran2013), which we attribute to a change in the free development of the boundary layer and especially a reduction of the boundary layer thickness. This reduction of the boundary layer thickness can be attributed to the planing effect of the  $200\ \mathrm {\mu }$m thick upper electrode, glued just before the leading edge. Therefore, in this work,
 $L/\theta _0$ was not obtained from the Blasius law (
 $\theta _0=\kappa \sqrt {2 \nu l_x/U_\infty }$ with
 $\kappa =0.4696$,
 $l_x=0.3$ m) and
 $\nu$ the kinematic viscosity, nor by a direct measurement of
 $\theta _0$, for lack of optical access, but deduced from (2.3) and (2.4), using the observed frequency (figure 3) and the regime parameters (table 2) for the two considered regimes. First, the value of
 $\gamma _n$ is computed from
 $f_n$,
 $n$,
 $L$ and
 $U_{\infty }$ and (2.3), then
 $L/\theta _0$ is deduced from (2.4). The resulting dimensionless cavity lengths are
 $L/\theta _0=85.83$ for the narrow-bandwidth regime and
 $L/\theta _0=102.90$ for the mode-switching regime.
Finally, we have investigated the deviation obtained with the Blasius law. From the values of  $L/\theta _0$ and assuming the same expression as the Blasius law, we fit the corresponding kappa for our cases:
 $\kappa =0.4209$ for the narrow-bandwidth regime and
 $\kappa =0.4205$ for the mode-switching regime. Both values are close to the one of the Blasius law (
 $\kappa =0.4696$) but slightly lower, which supports the hypothesis of boundary layer thinning by the presence of the DBD electrode.
The low ( $\,f_b$) and very low frequencies (
 $\,f<1$ Hz) constitute a challenge for automatic learning as their rare occurrences require longer time windows for converged statistics and thus slow down the overall learning process. First, we have chosen to alleviate this difficulty by controlling the narrow-bandwidth regime where the very low frequencies (
 $\,f<1$ Hz) are around two orders of magnitude lower than
 $f_a$ in terms of power. Then, we fully embrace the effect of the low frequencies with the mode-switching regime where the nonlinear interactions between
 $f_a$ and
 $f^+$ give rise to
 $f_b$ and especially the very low frequencies
 $f<1$ Hz:
 $f_b$ is caused by the triadic interaction between
 $f_a$ and
 $f^+$ and the low frequencies (
 $\,f<1$ Hz) are responsible for the frequency switches in the mode-switching regime. Indeed, the power associated with the very low frequencies (
 $< 1$ Hz) is more than one order of magnitude greater for the mode-switching regime than for the narrow-bandwidth regime, see figures 3(a) and 3(b). The control of the low frequencies is then performed indirectly by controlling the two other frequencies
 $f_a$ and
 $f^+$. Moreover, following Basley et al. (Reference Basley, Pastur, Lusseyran, Soria and Delprat2014), the energetic contribution of the very low frequencies is also due to the coupling between the mixing layer instability and the centrifugal instabilities originating in the spanwise direction within the cavity.
To conclude this description of the cavity dynamics, we recall that the goal we set for the control is to reduce the oscillation of the mixing layer by penalizing the peaks of power in the frequency range that includes  $f^-$,
 $f_a$ and
 $f^+$, as indicated by the green shaded area of the figure 3.
3. Control problem formulation and methodology
In this section, the control problem is defined, and the methodology to solve it and analyse the solutions is described. In § 3.1, the control problem is reformulated as an optimization problem. In the most general case, such a problem is non-convex and contains several minima a priori. To solve such an intricate problem, we employ a powerful machine learning algorithm § 3.3, the gMLC (Cornejo Maceda et al. Reference Cornejo Maceda, Li, Lusseyran, Morzyński and Noack2021), that combines exploration to discover new minima and exploitation for fast convergence. Finally, two methods for describing the control mechanisms involved are presented: one based on linear regression and the second on the reconstruction of the phase space with clustering (§ 3.4).
3.1. Cost function and optimization problem
The aim of this study is to stabilize the open cavity flow in two regimes of different complexity, in particular, the mitigation of the self-sustaining oscillations of the mixing layer. For this, a cost function is built based on the velocity data provided by the hot-wire downstream. The oscillations of the mixing layer are reflected in the oscillations of the velocity signal, thus the goal translates into the reduction of the highest peak of the associated power spectrum. Moreover, the power invested and the power saved by the control must be balanced. In that respect, two terms are considered in the cost function
 \begin{equation} J = J_a+\gamma J_b.\end{equation}
The term  $J_a$ accounts for the peak reduction and
 $J_b$ for the actuation power invested. Here,
 $J_{a}$ is defined as the value of the power spectral density maximum in a given frequency window. The value is normalized by the value for the unforced case. Hence, the performance of control law
 $K$ is given by
 \begin{equation} J_a(K) = \frac{\mathop{\max}\limits_{St \in [0.5,1.75]}
{PSD}(u)}{\mathop{\max}\limits_{St \in [0.5,1.75]}
{PSD}(u_0)}, \end{equation}
where  ${PSD}(u)$ is the power spectral density of the velocity
 $u$ measured by the hot-wire for the flow forced with the control law
 $K$ and
 $u_0$ is the velocity measured for the unforced flow. A steady actuation forcing study (§ 4.1) shows that the actuation affects both
 $f_a$ and
 $f^+$ so the detection window for the maximum of the
 $PSD$ is set such that it comprises both
 $f_a$ and
 $f^+$:
 $St \in [0.5, 1.75]$. Only the frequencies
 $f_a$ and
 $f^+$ are take into account as they are the leading modes of the dynamics; the remaining high-power frequencies (
 $2f_a$,
 $3f_a$ in figure 3) are harmonics of the fundamental, i.e. slaved to
 $f_a$. The detection window is set in Strouhal such that it is independent of the studied regime. The normalization of the cost function
 $J_a$ by the value of the peak for the unforced flow allows us to have a direct measure of the reduction of the peak.
The  $PSD$ is computed over
 $T_{ev}=40$ s. This choice is motivated for three reasons: first, it allows a good convergence of the statistics; second, the time is short enough to evaluate 1000 individuals in a few hours of experiment, limiting potential drifts and staying close to real-life applications with limited testing budget; third, the mode-switching regime may include one or two switches during this period of time, which is enough to have a record of both frequencies
 $f_a$ and
 $f^+$ in the spectrum. Hence, the evaluation time balances practicality and good characterization of the flow dynamics. Anticipating on the results, the value chosen for
 $T_{ev}$ happened to be enough for the control of the two main frequencies in the mode-switching regime. The control of the mode switching is realized indirectly by the control of the two frequencies involved
 $f_a$ and
 $f^+$. It is worth noting that a direct control of the intermittency requires a much longer evaluation time due to its very low frequencies.
The actuation penalization term  $J_b$ is estimated from the actuation command
 $b\in [-1,1]$, as the effective power supplied is not directly accessible in the experiment. Here
 $J_b$ is based on the square of the actuation command averaged over
 $T_{ev}$ so that it is an analogue to energy. To simplify the interpretation,
 $J_b$ is normalized by the range of the actuation so that
 $J_b=0$ when there is no actuation (
 $A=A_{min}$) and
 $J_b=1$ when the controller acts steadily at maximum level (
 $A=A_{max}$). Therefore
 \begin{equation} J_b = \frac{\langle (A-A_{min})^2 \rangle}{(A_{max}-A_{min})^2} = \frac{\langle (b+1)^2 \rangle}{4}, \end{equation}
with  $\langle {\cdot } \rangle$ denoting the mean value over
 $T_{ev}=40$ s. The choice of the penalization parameter
 $\gamma$ is based on the open-loop steady forcing study presented in § 4.1. We show, in particular, that a high level of steady actuation is enough to reduce the cost
 $J_a$ by at least
 $90\,\%$. The penalization parameter
 $\gamma$ is chosen such that the cost for the unforced flow (
 $J_0=1$) is similar to the cost of the high-level steady actuation (
 $b =1$), thus the optimal solution aimed needs to efficiently reduce
 $J_a$ with minimal actuation power. As both cost function components
 $J_a$ and
 $J_b$ are normalized, we choose then the penalization parameter to be
 $\gamma =1$. This choice results in setting the cost of the high-level steady actuation (
 $b=1$) to
 $J(b=1)=J_a+J_b \approx 1.1\approx J_0$.
Finally, the normalized standard deviation  $\tilde {\sigma }$ of the velocity signal is computed for the best control laws, a posteriori, to characterize the controlled flow. Indeed, effective mitigation of the self-sustained oscillations of the mixing layer results in a reduction of the standard deviation defined as
 \begin{equation} \tilde{\sigma}(K) = \frac{\sigma (u)}{\sigma (u_0)}, \end{equation}
with  $\sigma (u)$ being the standard deviation of the velocity
 $u$ computed over
 $T_{ev}=40$ s;
 $T_{ev}$ is also chosen such that the standard deviation is sufficiently converged. The standard deviation is normalized by the standard deviation of the natural unforced flow so as to have a direct measure of the gain.
3.2. Control problem
As stated previously, the control objective is to stabilize the cavity flow by mitigating the oscillations of the mixing layer downstream. To achieve this goal, the flow is forced with a DBD actuator located at the cavity leading edge. The result of the action is an unsteady body force whose intensity is commanded by the signal  $b$ sent to the terminals of the DBD actuator;
 $b$, also referred as the actuation command, is determined by the control law
 $K$. The control may operate in an open-loop or closed-loop manner. In this study, the considered open-loop actuations are only steady forcing, and closed-loop control includes the unique velocity sensor and time-delayed records. Thus, the control law reads
 \begin{equation} b =K(\boldsymbol{a}), \end{equation}
with  $\boldsymbol {a}$ being the feature vector comprising flow state information. Then, the control problem to solve can be reformulated as an optimization problem where the goal is to derive the optimal control law
 $K^*$ that minimizes the cost function
 $J$
 \begin{equation} K^* = \mathop{\operatorname{arg\,min}}\limits_{K\in \mathcal{K}} J(K),\end{equation}
with  $\mathcal {K}:A \mapsto B$ being the space of all possible control laws,
 $A$ is the control input domain and
 $B$ is the range of the actuation command. Deriving the optimal control law
 $K^*$ without any a priori information on the cost function
 $J$ is a challenging non-convex optimization problem presenting presumably several minima.
3.3. Gradient-enriched machine learning control
In this section, we present the gMLC algorithm (Cornejo Maceda et al. Reference Cornejo Maceda, Li, Lusseyran, Morzyński and Noack2021) employed to solve the optimization problem (3.6). Gradient-enriched MLC is an iterative function optimizer to derive control laws directly from the plant. The method is based on machine learning control (Duriez et al. Reference Duriez, Brunton and Noack2017, MLC) and is augmented with downhill simplex steps to accelerate the learning; MLC has already been employed to control dozens of experiments outperforming previous control laws with unexpected frequency cross-talk (Noack Reference Noack2019). The choice of downhill simplex algorithm relies on its fast convergence and its easy implementation as it does not require an analytical expression of the cost function but only its evaluation. In the past, downhill simplex has been successful in deriving an adaptive closed-loop control for lift-to-drag ratio optimization over a NACA 0025 airfoil (Tian, Cattafesta & Mittal Reference Tian, Cattafesta and Mittal2006; Cattafesta, Tian & Mittal Reference Cattafesta, Tian and Mittal2009) and reducing the net drag power of the fluidic pinball and a slanted Ahmed body (Li et al. Reference Li, Cui, Jia, Li, Yang, Morzyński and Noack2022). In Cornejo Maceda et al. (Reference Cornejo Maceda, Li, Lusseyran, Morzyński and Noack2021), the gMLC is introduced and employed to stabilize the fluidic pinball. The authors show, in particular, that gMLC outperforms MLC, managing to derive better performing control laws with greater learning speed. It is now applied for the first time in an experiment. Anticipating the results (see Appendix A), the superiority of gMLC over MLC is also verified for the control of the cavity in experimental conditions. The benefits of gMLC compared with MLC comes from the combination of stochastic optimization for exploration of the search space and deterministic optimization for a fast convergence towards the minimum. The method consists of the generation of candidate solutions to (3.6), evaluation of them and systematic recombining of the best ones to improve their performances.
The starting point of gMLC is MLC based on linear genetic programming (Brameier & Banzhaf Reference Brameier and Banzhaf2006, LGP). Following the genetic programming terminology, the candidate solutions are also referred to as individuals. Like the MLC method, gMLC makes no assumptions on the structure of the relationship between the inputs and the outputs of the controller. The optimal solution needs, however, to be computable, meaning it can be expressed by a finite number of mathematical operations with finite memory. Indeed, the candidate solutions are internally represented by matrices inherited from linear genetic programming. Each matrix resembles a computer program that unequivocally codes a control law. Each line of the matrix is an instruction pointing to basic operations ( $+$,
 $-$,
 $\times$,
 $\div$,
 $\cos$,
 $\sin$,
 $\tanh$, etc.) and registers containing constant random numbers and variables (
 $a_1$,
 $a_2$,
 $a_3$, etc.). The
 $N_{\rm inst}$ lines of the matrix are then read linearly yielding the control commands as outputs of the first registers. We refer to Li et al. (Reference Li, Borée, Noack, Cordier and Harambat2019) for more information on the internal representation of the control laws.
The gMLC algorithm starts with a broad exploration of the control law space with a Monte Carlo sampling (MCS) phase. The MCS generates  $N_{MCS}$ random matrices that represent the first set of individuals. The individuals are evaluated and added to the database of all individuals. Then, the algorithm alternates between exploration phases carried out by genetic programming and exploitation phases performed by downhill simplex iterations until a stopping criterion is reached. The role of exploration is to locate new and better minima in the space of control laws with stochastic recombination of the best-performing individuals. The stochastic recombination is achieved with the genetic operations crossover and mutation. This exploration is much like the evolution phase in the LGP method, however, in the case of gMLC, the concept of population that evolves through generations is generalized by considering all the individuals evaluated so far and stored in the database. Thus, during the exploration phase new individuals are generated by recombining the best among all the previously evaluated individuals. This ensures that no crucial information is irretrievably lost. The best individuals to recombine are selected following their cost function. The selection is carried out by the tournament method with a tournament size equal to 7 for 100 individuals, following the Duriez et al. (Reference Duriez, Brunton and Noack2017) recommendation. The tournament size is scaled with the number of individuals in the database in order to keep a 7/100 ratio;
 $N_{p}$ new individuals are built at each exploration phase by recombining the best individuals of the database.
Each exploration phase is followed by an exploitation phase. This step exploits the local gradient information to slide down towards the neighbouring minimum. This is carried out with a variant of downhill simplex for infinite-dimensional spaces introduced by Rowan (Reference Rowan1990) and referred to as downhill subplex. In the following, we do not differentiate between the downhill simplex and subplex as the algorithm steps are similar and only applied to different spaces. The principle of downhill simplex is to linearly combine the  $N_{sub}$ best-performing control laws following the gradient of the cost space to derive more performing individuals. In contrast to the exploration phase, the new individuals are built in a deterministic way. First, the
 $N_{sub}$ best individuals are selected to describe a simplex that lives in the subspace generated by the
 $N_{sub}$ best individuals. The simplex then crawls in the subspace according to geometric operations (reflection, expansion, contraction and shrink) following the local gradients. Each geometric operation yields one or several new individuals that are linear combinations of the original
 $N_{sub}$ individuals. After each downhill simplex iteration, the simplex is updated by replacing the least-performing individuals. The downhill simplex steps are iterated until at least
 $N_{p}$ individuals are generated. The newly generated individuals are then added to the database of all individuals. We emphasize that all the new individuals belong to the subspace defined by the original
 $N_{sub}$ individuals. The algorithm returns the best-performing control law once the stopping criterion is reached. Otherwise, a new iteration of exploration and exploitation is carried out. The stopping criterion may be a performance threshold or a total number of evaluations when the testing budget is limited.
We note the critical intermediate phase of reconstruction between each exploitation and exploration occurrence. Indeed, the new individuals generated by the downhill simplex are linear combinations of individuals without a matrix representation, which is essential for genetic recombination during the exploration phase. Thus, a matrix reconstruction is performed for each linearly combined individual by solving a secondary optimization problem. The goal is to derive a matrix that translates into a control law that has the same response as the linearly combined one. Such a problem is similar to a surface fitting problem, which we solve with linear genetic programming. The reconstruction phase builds a matrix representation for the linearly combined individuals so that genetic operation can be performed. For more information on the gMLC algorithm, we refer the readers to Cornejo Maceda et al. (Reference Cornejo Maceda, Li, Lusseyran, Morzyński and Noack2021). Figure 6 schematically illustrates the different phases of the gMLC algorithm and the learning principle in the control law space. The MATLAB implementation of gMLC employed for this study is freely available from the website https://github.com/gycm134/gMLC.
Schematic of the gMLC algorithm. On the left are depicted the three phases: MCS, exploration and exploitation. Each one of the phases requires several experiment evaluations. On the right is depicted a representation of the control law space and the gMLC learning process. The individuals generated during the MCS are depicted in black. The individuals resulting from genetic operations are depicted in blue and genetic operations by dashed blue arrows. The yellow region represents the subspace built from the best individuals. The individuals resulting from downhill simplex are depicted in yellow, and the red arrows symbolize the simplex sub-steps (only one sub-step is depicted). The reconstruction phase is not displayed for clarity.

3.4. Control law investigation
In this section, we propose two methodologies to analyse the actuation mechanisms of optimized control laws. Firstly, an analytical approximation of the control is performed with an affine mapping between the inputs (components of  $\boldsymbol a$) and the actuation command (
 $b$). Such mapping aims to reveal the most relevant component of the feature vector. The affine approximation
 $\tilde {K}$ of the control law
 $K$ reads
 \begin{equation} \tilde{K}(\boldsymbol a) = k_0 + \sum_{i}k_i a_i, \end{equation}
where  $k_i$ are gains determined by linear regression between the components of
 $\boldsymbol a$ and the actuation command
 $b$. The quality of the fitting is measured by the coefficient of determination
 $R^2$, measuring the relative reduction of the residual variance. The closer
 $R^2$ is to 1, the better
 $\tilde {K}$ fits the original control law
 $K$.
Secondly, we propose a visualization of the control laws based on the clustering of the feature vector  $\boldsymbol a$ to reconstruct the phase portrait. Cluster-based methods have been successful in reproducing key characteristics of fluid flow dynamics such as temporal evolution and fluctuation levels (Fernex, Noack & Semaan Reference Fernex, Noack and Semaan2021; Li et al. Reference Li, Fernex, Semaan, Tan, Morzyński and Noack2021). For this analysis, all the states of the feature vector are grouped in 10 clusters to reconstruct the dynamics. The cluster centroids,
 $c_k$, are defined as the average state of all the states in a given cluster. Clustering is performed with the
 $k$-means algorithm (Lloyd Reference Lloyd1982), and the metric employed is the one induced by the
 $L^2$ norm. The dynamics of the feature vector is then encapsulated in a probability transition matrix where its elements
 $p_{ij}$ are the transition probabilities from cluster
 $i$ to cluster
 $j$. The probability
 $p_{ij}$ is defined as
 $p_{ij}=n_{ij}/n_i$ with
 $n_{ij}$ being the number of states transitioning from cluster
 $i$ to cluster
 $j$ and
 $n_i$ the total number of states in cluster
 $i$.
Then all feature vector states and centroids are projected on a 2-D space with classical multidimensional scaling (Kaiser, Li & Noack Reference Kaiser, Li and Noack2017; Li et al. Reference Li, Cui, Jia, Li, Yang, Morzyński and Noack2022, MDS). The MDS is a dimensional reduction method that consists of extracting the two main features of the flow ( $\gamma _1$ and
 $\gamma _2$) by applying a proper orthogonal decomposition on the distance matrix of the feature vector
 $\boldsymbol a$. The vectors
 $\gamma _1$ and
 $\gamma _2$ spawn a 2-D space where all the data are projected. It is the optimal projection, in the
 $L^2$ norm sense, that preserves the distances between the states. Such representation is referred to as a proximity map.
Adding the probability transitions to the proximity map allows us to build a network model reproducing the phase portrait. The centroids constitute representative states of the flow where the system transitions ergodically, meaning that from any centroid, one can reach any other centroid. Finally, the mean forcing level is computed for each cluster and associated with their corresponding centroid. Such representation allows us to partition the states of strong and low forcing level and to reveal actuation mechanisms. Figure 7 summarizes the two approximation methodologies employed.
Control law investigation methodology for the cavity control. A feature vector  $\boldsymbol a$ is built from a direct measurement of the flow
 $u$. A feature vector of dimension three is depicted for simplicity. The elements of the feature vector are grouped in clusters. For clarity, only three clusters and their centroids (1,2,3) are displayed. The proximity map is defined by
 $\gamma _1$ and
 $\gamma _2$ the two flow features extracted with classical multidimensional scaling. For the transition matrix, darker squares symbolize higher transition probabilities. In the control network model, the actuation magnitudes are represented by rectangles; yellow denote the actuation range, red (blue) for a positive (negative) actuation with respect to the mean value.

The latter data-driven methodology for control visualization is expected to aid the human interpretability of machine-learned controls. We study a single-input single-output system; however, we believe that the methodology will be beneficial for the analysis of more complex control systems, including a high number of actuators and sensors.
4. Control results
In this section, we stabilize the open cavity flow in two regimes: the narrow-bandwidth regime (§ 4.3) and the mode-switching one (§ 4.4) presented in § 2.5. We recall that the control objective is to mitigate the self-sustaining oscillations of the mixing layer. First, in (§ 4.1), we reduce the oscillations with steady forcing at increasing actuation levels. Then, we employ gMLC to optimize feedback control laws. Section 4.2 details the parameters employed for the control law optimization, and §§ 4.3 and 4.4 present the results for the control of the narrow-bandwidth regime and the mode-switching regime, respectively.
4.1. Open-loop steady forcing
In this section, the response of the flow to steady actuation is described. For this study, the amplitude of the carrying signal is set to constant values. The flow is excited with 23 levels of actuation equally distant from the ionization level ( $A=A_{min}=6.9$ kV) to
 $A=A_{max}=12$ kV. Figure 8 presents the velocity power spectra for the two regimes. For the narrow-bandwidth regime, figure 8(a) shows that the second peak
 $f^{+}$ rises and the first peak
 $f_a$ decreases as the actuation level increases. When the actuation is too strong, the noise level increases and the two peaks are at the same level. The maximum peak reduction is achieved for
 $A=A_{max}$ with a cost reduction of
 $97\,\%$. The associated standard deviation slightly decreases to
 $\tilde {\sigma }=96\,\%$.
Response of the cavity flow to increasing levels of steady actuations. Only 12 actuation levels among the 23 tested are depicted for clarity. The vertical axes are in  $\log _{10}$ scale, and the ticks correspond to the exponent values. The spectra have been successively shifted upwards of 4 orders of magnitude to help the comparison. The difference of actuation intensity between two spectra is
 $\Delta V=0.6$ kV. The spectrum of the unforced flow is plotted in red and in transparency for comparison with the other levels. (a) Narrow-bandwidth regime and (b) mode-switching regime.

For the mode-switching regime, figure 8(b) shows that a strong actuation level is needed to reduce the amplitude of the peaks associated with  $f_a$ and
 $f^+$, although the broadband noise level also increases. The maximum cost reduction is achieved for the nearly maximum actuation level
 $A=11.4$ kV (
 $88\,\%$ of
 $A_{max}$) and the maximum peak power decreases by
 $90\,\%$. Also, the standard deviation slightly decreases to
 $\tilde {\sigma }=95\,\%$. We note that for the third spectrum starting from the bottom (
 $V=1.2$ kV), the accidental absence of mode switching during the measurement led to a lower
 $f^+$ peak.
This open-loop analysis shows that a strong steady actuation is able to reduce the fluctuations of the shear layer. However, in both cases the background noise level increases. Therefore, in the following, in order to exclude power demanding controllers, we consider the cost function described in § 3.1 that includes two terms: a measure of the maximum amplitude of the spectrum and an actuation penalization term.
4.2. Implementation of gMLC
The parameters chosen for the gMLC algorithm are similar to the ones chosen in Cornejo Maceda et al. (Reference Cornejo Maceda, Li, Lusseyran, Morzyński and Noack2021). The MCS phase generates  $N_{MCS}=100$ individuals. The exploration and exploitation phases both produce
 $N_{p}=50$ new individuals at each iteration. The exploration and exploitation phases alternate until 1000 individuals are evaluated. We recall that each individual is evaluated over
 $T_{ev}=40$ s. A relaxation time of
 $2$ s is intercalated between two consecutive control law evaluations. The experiment time needs also to include the time needed to solve the reconstruction problem, but this constraint can be lifted with additional computation power. The limit of 1000 individuals is then chosen such that all the individuals are evaluated in one day. Cornejo Maceda et al. (Reference Cornejo Maceda, Li, Lusseyran, Morzyński and Noack2021) show also that 1000 evaluations is enough to converge for a multiple-input multiple-output problem. The subplex space is generated by
 $N_{sub}=10$ control laws to balance speed and performance, as in Cornejo Maceda et al. (Reference Cornejo Maceda, Li, Lusseyran, Morzyński and Noack2021). For the evolution during the exploration phase, the crossover and mutation probabilities are both set to
 $P_c=P_m=0.5$. The control laws are built from nine mathematical operations (
 $+$,
 $-$,
 $\times$,
 $\div$,
 $\sin$,
 $\cos$,
 $\tanh$,
 $\exp$ and
 $\log$), ten flow features
 $\{a_i\}_{i \ldots 10}$ and
 $N_{cr}=10$ random constants. As suggested by Duriez et al. (Reference Duriez, Brunton and Noack2017), the
 $\div$ and
 $\log$ operations are protected, allowing them to be defined for all the real numbers;
 $N_{vr}=14$ registers are employed to derive the control laws. Finally, the maximum number of instructions to be coded in the matrix representation is
 $N_{inst, max}=50$. The flow features employed for feedback control laws are the velocity signal and nine time-delayed velocity signals. Time-delayed sensor signals are introduced as control inputs to enrich the search space and allow, in principle, autoregressive moving average with extra input (ARMAX)-type controllers (Hervé et al. Reference Hervé, Sipp, Schmid and Samuelides2012), linear and nonlinear combinations of them. The resulting feature vector
 $\boldsymbol a$ reads
 \begin{equation} \boldsymbol{a}(t) = [u(t),u(t-\tau),\ldots,u(t-9\tau)]^{\intercal}, \end{equation}
where the time delay is  $\tau = 0.008$ s. The choice of the delays allows reconstruction of the phase of the main frequencies of the flow between
 $25$ and
 $40$ Hz (Cornejo Maceda et al. Reference Cornejo Maceda, Li, Lusseyran, Morzyński and Noack2021). Only half of the delays are necessary but nine have been taken into account to enrich the phase space and get closer to full-state control. The presence of time-delayed information in the control can play, for example, the role of an embedding process in the new dynamical system consisting of the flow and the closed-loop control. Indeed, we have opted for a single measurement point separated from the actuator by a convective time that intrinsically varies over time. Implicitly, the system under closed-loop control is hence reduced to a purely temporal dynamical system and the spatial information can be interpreted as an embedding of this dynamic into a larger phase space.
Table 4 summarizes the parameters for the gMLC optimization process. Figure 9 displays the experiment set-up to control the open cavity with machine learning control and specifically with gMLC.
Gradient-enriched MLC parameters to control the open cavity.
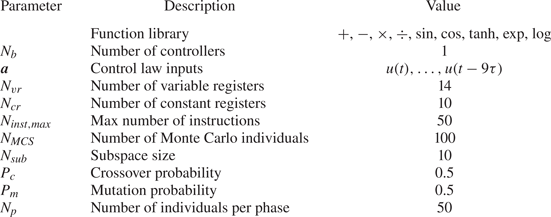
Diagram of the machine learning control process. The evaluation of one individual constitutes the fast evaluation loop, operating at  $250$ Hz. The slow learning loop updates the control laws following the gMLC algorithm; it operates at
 $\sim O(10^{-2}\ {\rm Hz})$.

4.3. Closed-loop control of the narrow-bandwidth regime
In this section, we describe the best control law derived by gMLC that mitigates the self-sustaining oscillations of the mixing layer for the narrow-bandwidth regime. In the following, the notations for the control law, cost and standard deviation associated with the learning on the narrow-bandwidth regime are marked by the superscript  $\textrm {I}$.
Figure 10 depicts the cost for the 1000 evaluated individuals during the optimization process. The individuals from the MCS and exploration phases are sorted following their cost, as there is no direct causal relationship between two successive individuals, while the individuals generated during the exploitation phase are depicted in the order of their evaluation as each individual depends on the previous one. We recall that the cost function is defined such that the cost of the unforced flow is  $J_0=1$. We note that a random sampling of 100 control laws already reduces the cost function to
 $J=0.2410$. Then, the first exploration phase (individuals
 $i=101,\ldots,150$) slightly reduces the cost function to
 $J=0.2276$. In the following exploitation phase (individuals
 $i=151,\ldots,206$), the downhill subplex individuals gradually reduce the cost function to
 $J=0.1882$. We note that, at first, the individuals are scattered along the vertical axis and then go down, close to the lowest cost so far. This behaviour shows that the individuals progress towards a minimum in the control law space. However, this descent is interrupted by the next exploration phase (individuals
 $i=207,\ldots,257$), where a better-performing individual is found; its cost is
 $J=0.1329$. This new individual replaces the worst-performing individual in the simplex, allowing the algorithm to explore beyond the initial subspace. It is worth noting that the dimension of the subspace remains the same as new individuals replace the worst-performing ones. From there on and until individual
 $i=512$, only the exploitation phases built better individuals. The cost of the best individual after 512 individuals is
 $J=0.0402$. Interestingly, we note that downhill simplex can build worse-performing individuals. Indeed, we notice that all exploitation phases starting from the
 $4$th one include individuals whose costs are scattered, up to
 $J=1$. The next exploration phase (individuals
 $i=513,\ldots,563$) finds a better control, whose cost is
 $J=0.0311$. As the simplex includes now poor performing individuals, four better-performing individuals generated by the exploration phase are introduced in the simplex. From there on, progress is made only with exploitation steps: the cost of the best individual reaches a plateau after
 $707$ evaluations and slightly improves after 913 evaluations. After 1000 evaluations, the cost of the final control law
 $K^{\textrm {I}}$ is
 $J^{\textrm {I}} = 0.0192$. The corresponding peak reduction is
 ${J_a}^{\textrm {I}}=0.0129$, i.e. 99 % of the fluctuation level In other terms, the amplitude of the oscillations is reduced by a factor of 9 or by 19 dB. The structure and components of
 $K^{\textrm {I}}$ is thoroughly described in Appendix C.
Distribution of the costs for the 1000 evaluated individuals during the gMLC optimization process for the narrow-bandwidth regime. Each dot represents the cost  $J$ of one individual. The colour of the dots symbolizes how the individuals are generated: black dots for randomly generated individuals (MCS phase), blue dots for individuals generated by a genetic operator (exploration phase) and yellow dots for the individuals arising from the subplex method (exploitation phase). The individuals from the MCS and exploration phases are sorted following their costs. The red line follows the evolution of the best cost. The vertical axis is in log scale.

The learned control law  $K^{\textrm {I}}$ is re-evaluated 20 times afterwards to test its efficiency outside the learning loop. We note that the performances slightly dropped as the averaged cost reduction of
 $J^{\textrm {I}}$ went from
 $-98\,\%$ to
 $-94\,\%$ and the standard deviation increased from
 ${\tilde {\sigma }}^{\textrm {I}}=61\,\%$ to
 $\tilde {\sigma }=65\,\%$. Such discrepancy is expected as the experimental conditions are always evolving. Indeed, the temperature in the room, the evolution over time of the DBD actuator and the incoming velocity variation are all possible sources of fluctuations on the measured velocity. However, the discrepancies are small, and the overall performance of the control law is retained.
Figure 11 depicts the flow response controlled by the best control law  $K^{\textrm {I}}$ derived by gMLC for the narrow-bandwidth regime. We observe that the control law
 $K^{\textrm {I}}$ effectively answers to the control objective as the oscillation amplitude is reduced compared with the unforced flow, see figure 11(a). This goes along with the decrease of the standard deviation to
 ${\tilde {\sigma }}^{\textrm {I}} = 61\,\%$. Such a feature was consistently observed in several learning realizations. The power spectra in figure 11(b) show that
 $K^{\textrm {I}}$ effectively reduces the highest peak of the spectrum at frequency
 $f_a$ by almost two orders of magnitude. The effect of the control is also observed beyond the observation window between
 $St \in [0.5,1.75]$ as the harmonics of
 $f_a$ are also mitigated. Note that the peak
 $f^+$ associated with the mode
 $n=3$ increases with the control. This behaviour is not surprising as the frequency is associated with a quasi-stable mode of the flow, which then grows when energy is supplied to the system. Moreover, the frequency
 $f^+$ is split into two peaks. This peak-splitting phenomenon, referred as spillover, is well known when building closed-loop transfer functions with unstable zeros and poles (Rowley & Williams Reference Rowley and Williams2006; Rowley et al. Reference Rowley, Williams, Colonius, Murray and Macmynowski2006). Despite being beyond a linear framework, one can suspect that a similar mechanism is behind the observed peak splitting. The learned law
 $K^{\textrm {I}}$ fails to control
 $f^+$ as its power level is around one order of magnitude lower than
 $f_a$ under control.
Characteristics of the best control law  $K^{\textrm {I}}$ controlling the narrow-bandwidth regime. (a) Time series of the velocity measured downstream and voltage level at the terminals of the DBD actuator. (b) Power spectra of the velocity measured downstream. Black is for the unforced flow, red for the flow controlled with
 $K^{\textrm {I}}$ and blue for the flow controlled with the recorded actuation command
 $A^{\textrm {I}}(t)$ employed as an open-loop control. The spectra for the unforced flow (black) and the closed-loop controlled flow (red) are averaged over 20 realizations. The horizontal dashed lines denote the maximum of the spectra in the observation window (green background). The vertical axis is in
 $\log _{10}$ scale.

In addition, such control has been achieved with a minimum actuation power. Indeed the associated cost is  ${J_b}^{\textrm {I}}=0.0063$, less than
 $1\,\%$ of the maximum actuation power. The actuation command, plotted in figure 11(a), shows that the control combines low-level steady actuation and low-amplitude feedback control. To demonstrate the effectiveness of the low-amplitude level, we use the closed-loop actuation command as an open-loop control. The closed-loop actuation command recorded during the learning process has been employed as open-loop control signal to force the flow. The spectrum of the resulting flow (blue spectrum in figure 11b) shows that that the main frequency of the flow
 $f_a$ resurfaces and also that the mode
 $n=3$ associated with the frequency
 $f^+$ is also excited. This open-loop test reveals that despite the low-amplitude level, feedback plays a crucial role in stabilizing the flow. Moreover, when we compare the results of the open-loop control with a steady actuation of equivalent level (
 $\sim 10\,\% A_{max}$) in figure 8(a), we note that both frequencies
 $f_b$ and
 $f^+$ are excited, indicating the effect of the unsteady component of the command.
Now we describe the learned law  $K^{\textrm {I}}$ with an analytical approximation and a cluster-based visualization. For the analytical approximation, the determination coefficient for the affine reconstruction
 $R^2=0.87$ indicates an acceptable reconstruction. The gains associated with each feature component are presented in table 5. We note that, aside the mean component, the dominant term is
 $a_1=u$, as its gain (
 $k_1=0.51$) is more than 7 times higher than the second highest gain. The strong correlation between
 $K^{\textrm {I}}$ and
 $a_1$ reveals that phasor control or direct feedback of the system's state plays a fundamental role for this control. However, figure 12 shows that the relationship between
 $b$ and
 $a_1$ is not fully affine as two regions of significant width are displayed. This analysis is in agreement with the cluster-based investigation of the control law.
Actuation command  $b$ vs
 $a_1$ for the case:
 $K^{\textrm {I}}$ controlling the narrow-bandwidth regime.

Gains for the affine reconstruction of  $K^{\textrm {I}}$ controlling the narrow-bandwidth regime.

The control visualization, following the method described in § 3.4, allows us to interpret the dynamics of the control achieved by  $K^{\textrm {I}}$. The proximity map (figure 13a) shows that the centroids are arranged in a circular manner around the origin where centroid 1 is located. The transition probability matrix (figure 13b) gives the probability transition from one cluster to the other for each time step
 ${\rm d} t=0.004$ s. The transition probability matrix also shows one fixed point and 2 cycles: a small cycle including centroids 2, 3, 4 and 5 and a large one including centroids 6, 7, 8, 9 and 10. Combining the proximity map and the transition probability matrix, we can reconstruct the phase space of the dynamics by deriving a control network model (figure 13c). The identified cycles in the transition probability matrix are represented by limit cycles in the phase space. A frequency analysis based on a Poincaré section and angular first return map of the dynamics similar to Lusseyran et al. (Reference Lusseyran, Pastur and Letellier2008) reveals that the frequencies associated with the large limit and small limit cycles are around
 $28.48$ Hz and
 $41.14$ Hz, respectively. We can then assume that the large limit cycle is associated with the dynamics of mode
 $n=2$ (frequency
 $f_a=28.81$) and the small limit cycle is associated with mode
 $n=3$ (frequency
 $f^+=38.72$). Following Lusseyran et al. (Reference Lusseyran, Pastur and Letellier2008), such organization frequencies in the phase space shows that the dynamics may be structured around a fixed point of the stable spiral type where the oscillation period increases with the distance to the fixed point, here represented by cluster 1. Figure 13(c) also depicts the actuation regions in the phase space, revealing two mains regions of opposite actuation sign separated by a straight line. Interestingly, the sign of the actuation changes when approaching the fixed point. Such actuation map shows that the main stabilization mechanism exploited by
 $K^{\textrm {I}}$ is phasor control. The change of actuation sign when approaching the fixed point is explained by a phase shift due to the frequency change. The resulting control is similar to the one obtained with linear control by Yan et al. (Reference Yan, Debiasi, Yuan, Little, Ozbay and Samimy2006) where there is a rapid switching between two modes competing for the available energy, thus mitigating any resonance. Moreover, a spectral analysis of the actuation command
 $b$ and
 $a_1=u$ shows that they share the same frequency peaks supporting the phase relation between the control and the state of the system, see figure 26(a) in Appendix D.
Investigation of the law  $K^{\textrm {I}}$ controlling the narrow-bandwidth regime. Clusters are painted in different colours. The centroids are marked with numbers from 1 to 10. Panel (c) represents the control network model. The actuation amplitudes are denoted with bars, red (blue) for positive (negative) amplitude with respect to the mean actuation. The yellow boxes underneath indicate 25 % of the maximum amplitude. The black arrows serve as the most probable transition from one cluster to the other (
 $p>0.40$). The grey arrows are for less probable transitions (
 $0.40 \geq p \geq 0.05$). Lower probability transitions and self-transitions are omitted for clarity. The red (blue) background denotes the supposed regions of positive (negative) amplitude. The dotted black lines are the supposed limits that separate the regions. (a) Proximity map of the feature vector
 $\boldsymbol a$, (b) transition probability matrix and (c) control network.

Finally, a comparison between MLC and gMLC has been performed (see Appendix B) and reveals that gMLC outperforms MLC in terms of speed and final solution. In total, the learning has been accelerated by one order of magnitude.
Gradient-enriched MLC has been successfully applied to the stabilization of the open-cavity flow experiment. Exploration and exploitation phases both participated in the fast learning of a feedback control law. The evolution phases managed to discover new minima in the search space, and the simplex steps succeeded in converging towards a new minimum. A feedback control law is built, outperforming the steady actuation and allowing a similar reduction of the level of the maximum peak of the spectrum but with small actuation power. Both the analytical approximation and the cluster-based analysis hint at a control combining phasor control and nonlinear interactions. Hence, the control achieved is close to an ideal stabilization scenario, where some base state or fixed point is stabilized with a vanishing cost. This interpretation is certainly to be considered heuristically, given the complexity of the real dynamics of the 3-D intra-cavity flow and its nonlinear temporal and spatial interactions with the mixing layer. However, it aims at capturing the remarkable properties of the control law learned by the gMLC, whose mode of action is radically opposed to that of a control by steady forcing. In this section, the learning has been realized for a single-frequency regime; in the next section, a more challenging regime is controlled where two modes compete, strengthening nonlinear coupling.
4.4. Closed-loop control of the mode-switching regime
In this section, gMLC is employed to control a flow regime with strong nonlinear coupling, which leads, in particular, to intermittency between the two main instability modes of the mixing layer. The dynamics of intermittency is chaotic (Lusseyran et al. Reference Lusseyran, Pastur and Letellier2008) with the appearance of long time scales that are demanding from the point of view of machine learning. The goal is again to stabilize the flow by reducing the oscillations of the mixing layer, but this time in the case where two modes compete, as described in § 2.5. This constitutes a challenging problem as gMLC needs to learn a control law able to control two modes simultaneously. For the gMLC optimization, the same parameters as for the narrow-bandwidth regime have been employed, see § 4.2. In the following, the notations for the control law, cost and standard deviation associated with the learning on the mode-switching regime are marked by the superscript  $\textrm {II}$.
Figure 14 depicts the cost of the individuals evaluated along the learning process. For this specific experiment, most of the learning is realized during the MCS phase, reducing the cost function to  $J=0.0713$. From there on, the only improvements are carried out with the simplex steps, bringing the cost function to the final value
 $J^{\textrm {II}}=0.0565$. Nonetheless, the second exploration phase introduced a new control law (
 $\#11$) in the simplex (see table 8 of Appendix C). As the gMLC algorithm is partially stochastic, it is possible to fall close to the global minimum by pure luck; however, it usually takes several iterations of the learning phases to converge, as in § 4.3. Such a learning process has been observed in other realizations of the same experiment where a combination of exploration and exploitation have been necessary to reach similar levels of performance.
Distribution of the costs for the 1000 evaluated individuals during the gMLC optimization process for the mode-switching regime. Each dot represents the cost  $J$ of one individual. The colour of the dots symbolize how the individuals have been generated: black dots for randomly generated individuals (MCS phase), blue dots for individuals generated from a genetic operator (exploration phase) and yellow dots for the individuals arising from the subplex method (exploitation phase). The individuals from the MCS and exploration phases are sorted following their costs. The red line follows the evolution of the best cost. The vertical axis is in
 $\log _{10}$ scale.

After 1000 evaluations, the final control  $K^{\textrm {II}}$ is a feedback control law, thoroughly described in Appendix C. The spectra of the flow under control (figure 15b) reveal a drastic decrease in the level of the maximum peak at frequency
 $f_a$. The dominant frequency is then close to the one associated with the second main mode (
 $\,f^+$). The relative reduction of the maximum peak in the spectrum is
 ${J_a}^{\textrm {II}}=0.0335$, i.e. 0.97 % of the fluctuation level. This corresponds to a reduction of the oscillation amplitude by a factor of 5 or by 15 dB. The standard deviation associated decreases to
 ${\tilde {\sigma }}^{\textrm {II}} = 97\,\%$. Like for the narrow-bandwidth regime, the control is achieved with small actuation power, using around
 $2\,\%$ of the maximum actuation power. Figure 16 reveals that the controlled flow no longer shows a mode-switching behaviour like in figure 4(b). The actuation command plotted in figure 15(a) shows short-time intermittent high-amplitude spikes emerging from the minimum actuation level (
 $A_{min}$). As for the narrow-bandwidth regime, the control law
 $K^{\textrm {II}}$ is re-evaluated 20 times and a small performance drop is observed:
 $J^{\textrm {II}}$ went from
 $-94\,\%$ to
 $-89\,\%$ and the standard deviation from
 ${\tilde {\sigma }}^{\textrm {II}}=97\,\%$ to
 $\tilde {\sigma }=112\,\%$. Finally, like in § 4.3, the time series of the actuation command has been employed as a signal input for open-loop control. Surprisingly, the equivalent open-loop control performs as good as the close-loop control law, suggesting that feedback was not at play in the reduction of the power amplitude for the mode-switching regime. However, anticipating the next section (§ 5), controlling the narrow-bandwidth regime with
 $K^{\textrm {II}}$ reveals that feedback is still a feature selected by gMLC.
Characteristics of the best control law  $K^{\textrm {II}}$ controlling the mode-switching regime. (a) Time series of the velocity measured downstream and voltage level at the terminals of the DBD actuator. A short window is enlarged to display the behaviour close to
 $A_{min}$ (the proportions are not kept). (b) Power spectra of the velocity measured downstream. Black is for the unforced flow, red for the flow controlled with
 $K^{\textrm {II}}$ and blue for the flow controlled with the recorded actuation command
 $A^{\textrm {II}}(t)$ employed as an open-loop control. The spectra for the unforced flow (black) and the closed-loop controlled flow (red) are averaged over 20 realizations. The horizontal dashed lines denote the maximum of the spectra in the observation window (green background). The vertical axis is in
 $\log _{10}$ scale.

Spectrogram of the velocity for the mode-switching regime controlled with  $K^{\textrm {II}}$.

For the polynomial approximation of the  $K^{\textrm {II}}$ control of the mode-switching regime, a linear regression was unable to derive an affine reconstruction of the actuation command; the corresponding determination coefficient is
 $R^2=0.13$. Even with expanding the affine reconstruction with quadratic and cubic terms,
 $R^2$ is less than 0.25, implying that no linear control can be inferred from the data.
Regarding the cluster-based analysis of the control, figure 17 reveals a complex structure for the dynamics. The transition matrix (not plotted) shows that the cluster self-transitions are dominant. The reconstructed phase space reveals two regions of opposite actuation signs. The complex interactions between the centroids show that strong nonlinearities are at play. Interestingly, the spectrum of the actuation command (figure 26(b) in Appendix D) does not include any significant peak, except for the very low frequencies. The actuation command corresponds then to a random noise without any correlation with the measured velocity.
Visualization of the control law  $K^{\textrm {II}}$ controlling the mode-switching regime. The control network is depicted like in figure 13. The actuation amplitudes are denoted with bars, red (blue) for positive (negative) amplitude with respect to the mean actuation. The yellow boxes indicate 10 % of the maximum amplitude. The black arrows serve as the most probable transition from one cluster to the other (
 $p>0.15$). The grey arrows are for less probable transitions (
 $0.15 \geq p \geq 0.10$). Lower probability transitions and self-transitions are omitted for clarity. The red (blue) background denotes the supposed regions of positive (negative) amplitude. The dotted black line is the supposed limit that separates the regions.

In less than 1000 evaluations, gMLC builds feedback control laws that reduced the maximum peak of the power spectrum with small actuation power in two regimes: the narrow-bandwidth regime and the mode-switching regime. We proposed a visual representation of the control laws to aid the interpretability of the actuation mechanisms that enabled such efficient controls. However, a real analysis of the controlled flow is not done yet and constitutes a study in itself. The identification of the involved control mechanism requires a study of the short transient that leads to the stabilized state. Nonetheless, we can affirm that the control impacts the linear amplifier of the shear layer as the DBD actuator modifies its thickness on average. This effect has been demonstrated by studying the difference between the unforced and forced mean flow even for low actuation levels, i.e. near the ionization threshold. Such a mechanism is expected to remain valid for turbulent flows and even for often-studied transonic cavity flows. Moreover, Cornejo Maceda et al. (Reference Cornejo Maceda, Li, Lusseyran, Morzyński and Noack2021) show that gMLC surpasses MLC in terms of final solution performance and learning speed for a 2-D numerical simulation. In Appendix A, we demonstrate that gMLC also surpasses MLC in experiments, establishing gMLC as a keystone for fast learning of feedback control laws directly on the plant. We foresee that gMLC will greatly contribute to the learning of control laws for MIMO control.
5. Control law investigation
In this section, we further investigate the capabilities of the control laws  $K^{\textrm {I}}$ and
 $K^{\textrm {II}}$ learned for the narrow-bandwidth regime and the mode-switching regime, respectively. Firstly, the robustness of the laws is tested by applying each law on the other regime, comprising a dynamics different from the learning conditions (§ 5.2). Secondly, we characterize the new control of these regimes with an affine approximation and our cluster-based visualization method (5.2). Finally, we establish the existence of effective feedback for the control of both regimes with open-loop tests (§ 5.3).
5.1. Robustness of the control
In this study, feedback control laws are optimized for steady conditions: fixed Reynolds number and incoming velocity during the learning process. To achieve robustness, the control laws learned should also perform for a large range of parameters. Thus, to test the robustness of the learned laws, they are re-evaluated for operating conditions different from the learning ones: the law  $K^{\textrm {I}}$ optimized for the narrow-bandwidth regime is now employed to control the mode-switching regime and vice versa. Such a test is demanding as the dynamics is partially different from one regime to the other. In particular, the unforced dynamics of the mode-switching regime includes the main frequency of the narrow-bandwidth regime but also displays intermittency with another frequency.
Figure 26 displays the spectra for each controlled case. For the control of the narrow-bandwidth regime with  $K^{\textrm {I}}$ (figure 18(a), green line), we note that the law
 $K^{\textrm {II}}$ manages to reduce the main peak
 $f_a$ of the spectrum to the same level as the law
 $K^{\textrm {I}}$ (red line). Moreover, for the frequency range around
 $f^+$,
 $K^{\textrm {II}}$ performs better than
 $K^{\textrm {I}}$ as it mitigates the peak-splitting phenomenon described in § 4.3. Such feature is expected as
 $K^{\textrm {II}}$ has been optimized to control the mode
 $f^+$. In fact, the whole spectral range is reduced in amplitude. This non-transfer of energy to other frequencies is a remarkable feature of
 $K^{\textrm {II}}$.
Spectral response of the flow controlled by  $K^{\textrm {I}}$ and
 $K^{\textrm {II}}$ for the narrow-bandwidth regime (top) and the mode-switching regime (bottom). Black spectra correspond to the unforced dynamics of each regime; red spectra correspond to the flow controlled by law learned in the given regime, i.e.
 $K^{\textrm {I}}$ (
 $K^{\textrm {II}}$) for the narrow-bandwidth (mode-switching) regime. Green corresponds to the flow controlled by the law learned in the other regime and blue to the open-loop equivalent of the latter one. The horizontal dashed lines denote the maximum of each spectrum in the observation window (shaded green section). The vertical axes are in
 $\log _{10}$ scale. (a) Power spectra for the narrow-bandwidth regime and (b) power spectra for the mode-switching regime.

As for the control of the mode-switching regime with  $K^{\textrm {I}}$ (figure 18(b), green line), the power of the main frequency
 $f_a$ is drastically reduced, reaching the same power level as the control with
 $K^{\textrm {II}}$ (red line). However, the controller is less efficient than
 $K^{\textrm {II}}$, as
 $K^{\textrm {I}}$ fails to reduce the power associated with the frequency range surrounding the frequency
 $f^+$ of mode
 $n=3$. Again, like for the control of the narrow-bandwidth regime with
 $K^{\textrm {I}}$, we observe the spillover effect with a splitting of the main frequency into two frequencies on either side and with a lower power level.
In summary, both learned control laws  $K^{\textrm {I}}$ and
 $K^{\textrm {II}}$ are able to retain their efficiency when controlling regimes that are out of the learning conditions. Expectedly,
 $K^{\textrm {I}}$ was unable to reduce the peak of the frequency
 $f^+$ in the mode-switching regime. Nonetheless, it manages to reduce the
 $f_a$, despite only appearing intermittently. On the other hand, for the narrow-bandwidth regime, the control with
 $K^{\textrm {II}}$ was more significant than
 $K^{\textrm {I}}$ as it prevents the peak splitting (or spillover) of the third mode. Thus this test also reveals that
 $K^{\textrm {II}}$ is not only able to control the frequency
 $f_a$ and
 $f^+$ but also to prevent the rise of both modes simultaneously. Of course, from the point of view of the cost function, both control laws
 $K^{\textrm {I}}$ and
 $K^{\textrm {II}}$ are similar when controlling the narrow-bandwidth regime, and gMLC could have converged towards any of the two control laws. Yet,
 $K^{\textrm {II}}$ is the control law that answers the best to the control objective, which is the stabilization of the flow. Therefore, it is the learning conditions that make the difference. This analysis reveals that learning a control law in complex and rich conditions is beneficial for the robustness and the overall efficiency of the control as the richness of the dynamics will be reflected in the control law.
5.2. Interpretation of the resulting controlled flow
Now, we propose an interpretation of the controls performed in the previous section using both analytical approximation and cluster-based visualization of the control laws. Firstly, we analyse the case where  $K^{\textrm {II}}$ controls the narrow-bandwidth regime. Like for § 4.4, a linear regression is unable to reconstruct the actuation command despite being in a less complex regime. The determination coefficient is
 $R^2=0.13$. The addition of quadratic terms brings the coefficient no higher than 0.78. A complex nonlinear control is expected as
 $K^{\textrm {II}}$ manages to control both frequencies
 $f_a$ and
 $f^+$.
As for the control law visualization, figure 19 depicts a similar control network as in § 4.3. However, there is only one large cycle composed of centroids 1, 2, 3, 4, 5, 6 and 7. The limit cycle presents four phases regularly alternating between positive and negative actuation, suggesting that the control operates at twice the frequency of the flow. A spectral analysis of  $a_1=u$ and
 $b$ (see figure 26(c) in Appendix D) shows that the main peaks are respectively
 $f_a=29.03$ Hz and
 $f=58.23\ {\rm Hz} \approx 2f_a$, confirming the phase relation between the flow dynamics and the actuation command. Interestingly, the second harmonic
 $2f_a$ is slightly excited but does not resonate for the controlled flow (figure 18(a), green line), while it resonates for the open-loop equivalent of
 $K^{\textrm {II}}$ (blue line). In summary,
 $K^{\textrm {II}}$ controls the flow at twice the main frequency but avoids the resonance of the second harmonic. The efficiency of a controller at twice the main frequency has been previously reported by Schumm, Berger & Monkewitz (Reference Schumm, Berger and Monkewitz1994). The authors note the stabilization of a cylinder wake by transverse vibration of the cylinder at 1.8 times the natural shedding frequency. In particular, they declare that the control effect is due to a nonlinear interaction between the instability and the forcing input. Thus, both the analytical and cluster-based analyses point towards a nonlinear actuation mechanism for the control of the narrow-bandwidth regime with
 $K^{\textrm {II}}$.
Visualization of the control law  $K^{\textrm {II}}$ controlling the narrow-bandwidth regime. The control network is depicted as in figure 13. The actuation amplitudes are denoted with bars, red (blue) for positive (negative) amplitude with respect to the mean actuation. The yellow boxes indicate 25 % of the maximum amplitude. The black arrows serve as the most probable transition from one cluster to the other (
 $p>0.50$). The grey arrows are for less probable transitions (
 $0.50 \geq p \geq 0.5$). Lower probability transitions and self-transitions are omitted for clarity. The red (blue) background denotes the supposed regions of positive (negative) amplitude. The dotted black lines are the supposed limits that separate the regions.

Secondly, we interpret the case where  $K^{\textrm {I}}$ controls the mode-switching regime. This time, the linear regression builds an affine approximation of the control as the determination coefficient is
 $R^2=0.92$. The gains associated with each feature component are displayed in table 6. As for § 4.3, the most relevant feature is
 $a_1=u(t)$, but again the control cannot be reduced to an affine relationship as figure 20 displays a nonlinear curve. Such observation is in agreement with the spectral analysis of
 $b$ and
 $a_1=u$ (see figure 26(d) in Appendix D) showing the peaks at the same frequency. The complexity of the flow translates into a complex control network as in § 4.4. Figure 21 depicts a reconstructed phase space divided into two main regions: one on the left (centroids 1, 2 and 3) with positive actuation amplitude; and one on the right (centroids 4, 5, 6, 7, 9 and 10) with negative actuation amplitude. The role of centroid 8 may be small as its associated actuation is close to the mean value. Interestingly, the overall structure of the control network is similar to the one in figure 21, suggesting that the control mechanism is also a complex nonlinear one.
Gains for the affine reconstruction of  $K^{\textrm {I}}$ controlling the mode-switching regime.

Actuation command  $b$ vs
 $a_1$ for the case:
 $K^{\textrm {I}}$ controlling the mode-switching regime.

Visualization of the control law  $K^{\textrm {I}}$ controlling the mode-switching regime. The control network is depicted as in figure 13. The actuation amplitudes are denoted with bars, red (blue) for positive (negative) amplitude with respect to the mean actuation. The yellow boxes indicate 25 % of the maximum amplitude. The black arrows serve as the most probable transition from one cluster to the other (
 $p>0.15$). The grey arrows are for less probable transitions (
 $0.15 \geq p \geq 0.9$). Lower probability transitions and self-transitions are omitted for clarity. The red (blue) background denotes the supposed regions of positive (negative) amplitude. The dotted black lines are the supposed limits that separate the regions.

5.3. The need of feedback
We have shown with the control of the narrow-bandwidth regime (§ 4.3) that without feedback the control law  $K^{\textrm {I}}$ is unable to stabilize the flow and even excites the frequencies
 $f_a$ and
 $f^+$ (figure 11b). Moreover,
 $K^{\textrm {I}}$ is able to partially control the mode-switching regime (§ 5.1) and, as expected, the same controller applied in an open-loop manner is no longer able to control the main mode
 $f_a$ (blue spectrum in figure 18b). We note, nonetheless, a small shift of the spectrum towards the higher frequencies.
On the other hand, surprisingly, it has been shown in (§ 4.4) that  $K^{\textrm {II}}$ performs in open loop as well as in closed loop. This result is consistent with the absence of correlation between the actuation command
 $b$ and the velocity measure
 $a_1=u$, see figure 26(b) in Appendix D. So, it seems that the learning process has selected the flow information (
 $a_i$, see Appendix C) without any improvement of the cost. However,
 $K^{\textrm {II}}$ applied in closed-loop manner to the narrow-bandwidth regime performs even better than
 $K^{\textrm {I}}$, while in an open-loop manner,
 $K^{\textrm {II}}$ fails to achieve any control. Indeed, the corresponding spectrum (blue spectrum in figure 18b) is almost similar to the unforced flow. Therefore, it should be noticed that the flow state information
 $a_i$ in
 $K^{\textrm {II}}$ is truly functional and, in fact, gives the controller the ability to remain effective well away from the learning conditions.
This analysis shows the extent to which feedback is a key feature for control. We believe that the ability of gMLC to learn effective and efficient feedback control laws in experiments will greatly benefit future MIMO control experiments.
5.4. Stabilization of the open cavity flow
In this study, the flow is monitored by a single hot-wire sensor downstream of the actuator. The sensor signal is employed for sensor feedback and to characterize the controlled flow. The achieved stabilization near the sensor extends in the spanwise and streamwise directions, assuming a significant portion of the finite aspect ratio cavity.
For large aspect ratios  $S/D$, e.g.
 $O(100)$ or more, the effect of 2-D actuation along the whole span can be expected to depend on the sensor location. The feedback stabilization in the sensor plane will become a non-stabilizing open-loop actuation far beyond the spanwise coherence length. An interesting example has been reported for the stabilization of a large aspect ratio cylinder wake. Roussopoulos (Reference Roussopoulos1993) forced the cylinder wake with a pair of loudspeakers driven in opposite phase and significantly reduced the fluctuations at the downstream sensor location. Far away from the sensor in spanwise direction, no stabilization was observed. For our open cavity flow, we expect a loss of control authority at a distance from the hot-wire position greater than the transverse coherence length. This transverse coherence of the mixing layer instabilities is at least of the order of the cavity depth
 $D$. Our cavity has an aspect ratio of
 $S/D=6$, i.e. we control at least one third of the cavity spanwise (
 $1D$ on either side of the hot-wire plane). The remaining lateral thirds are in the Ekman layers and, therefore, probably less oscillatory. The global stabilization could be augmented with multiple actuators and multiple sensors. As for the spanwise homogeneity of our one-piece DBD actuator, measurements performed for actuation levels close to the ionization threshold, when the ionization is still quite inhomogeneous along the electrode, show that the flow response is independent of the spanwise location of the measurement point. It should be noted that the feedback is only provided by a sensor in the symmetry plane. Yet, the global stabilization of the cavity flow is validated with additional measurements at several spanwise locations as elaborated in Appendix E.
Concerning the streamwise direction, the source of the oscillation is related to the mixing layer through the Kelvin–Helmholtz instability. At the level of the mixing layer, the hypothesis of an oscillation along the length of the cavity which would be cancelled at the downstream edge corresponds to the idea of a standing wave with a node at the hot-wire location. However, with a Kelvin–Helmholtz instability, we are in the case of convective instability which can only be killed by cancelling the disturbances at the source. Otherwise, any oscillations close to the most dangerous frequency would inevitably be amplified and be present at all  $x$ and especially at the hot-wire location. This is well observed in the visualization of the natural flow where the oscillations reach maximum nonlinear amplitudes and break on the downstream corner. Hence, the downstream stabilization of the flow results necessarily in the control of the mixing layer in the streamwise direction.
6. Conclusions
This paper deals with a closed-loop stabilization experiment of an oscillating flow exhibiting nonlinear coupling between several frequencies. The control law is automatically learned with gMLC (Cornejo Maceda et al. Reference Cornejo Maceda, Li, Lusseyran, Morzyński and Noack2021). The chosen plant is an open cavity flow in experiment for two distinct regimes: a narrow-bandwidth regime with dominant frequency  $f_a$ and a mode-switching regime where another frequency
 $f^+$ temporarily occurs. The flow is actuated upstream at the leading edge with a DBD plasma actuator and monitored downstream at the trailing edge with a hot-wire sensor. The cost function penalizes the energy peaks at the dominant frequencies in this velocity signal and the actuation power.
First, the effect of steady forcing is explored. For the narrow-bandwidth regime, an increasing actuation level progressively mitigates the main frequency  $f_a$ while the energy of the other mode (
 $\,f^+$) rises. The fluctuation energy is reduced by up to
 $97\,\%$ compared with the unforced case. The corresponding maximum actuation level defines the limit where a residual resonance can still be observed. Similarly, in the mode-switching regime, the two frequencies present in the flow (
 $f_a$ and
 $\,f^+$) are both damped as the actuation level increases. A
 $90\,\%$ decrease of the maximum power is achieved for
 $88\,\%$ of the maximum actuation level. Thus, reducing the main oscillations of the mixing layer is possible with a high-amplitude steady forcing.
Second, a feedback control law from hot-wire signal to DBD actuation is optimized with gradient-enriched machine learning control. The control law associated with the narrow-bandwidth regime reduces the energy of the peak frequency to  $1.29\,\%$ of the unforced case, i.e. more than the steady forcing. In addition, this better feedback performance requires less than
 $1\,\%$ of the steady open-loop actuation power. Feedback is demonstrated to be crucial for the established control: an open-loop control with the recorded feedback actuation command has hardly any stabilizing effect. A novel cluster-based investigation of the control law indicates a similar mechanism as fixed point stabilization with phasor control. This mechanism is corroborated by an analytical simplification of the control law. Intriguingly, the phase delay strongly varies with amplitude of the oscillations. Thus, the control has the features of stabilizing control of fixed point with minimal actuation power to compensate for system noise.
Third, gMLC is also employed to optimize the control law to stabilize the mode-switching regime. The learned law manages to successfully decrease the energy related to the two main frequencies to  $3.35\,\%$ of the unforced case and also with small actuation power around
 $2\,\%$ of the maximum actuation level. This time, the control performs in open loop as well as in closed loop. The actuation mechanism seems hardly interpretable and more complex than phasor control. Re-evaluation of the learned laws leads to a slight performance drop rendering them insensitive to the varying experimental conditions.
Finally, the robustness of the optimized controllers is assessed by applying the law learned for one regime to the other regime. Expectedly, the law learned in the narrow-bandwidth regime only partially stabilizes the mode-switching regime: the energy associated with frequency  $f_a$ is similar to their minimal actuated level while the energy of
 $f^+$ is hardly mitigated. On the other hand, the law learned in the mode-switching regime performs even better than the law learned in the given regime. The main frequency
 $f_a$ is controlled and the
 $f^+$ spillover effect is prevented, revealing that a simultaneous control of both frequencies is possible. Moreover, the need for feedback is demonstrated: Applying the recorded closed-loop actuation command in open-loop fashion has hardly any stabilizing effect. Figure 22 summarizes the control performances for each case and also re-evaluation tests of the learned laws to assess their robustness. Lastly, the global nature of the stabilization is discussed.
Summary of the performance for the laws learned ( $K^{\textrm {I}}$,
 $K^{\textrm {II}}$) in this study. On the left, the performance of the laws during the optimization process, and on the right, the performance during the offline re-evaluations. The re-evaluation results are averaged over 20 realizations. The results associated with the learning on the narrow-bandwidth regime and the mode-switching regime are marked by the superscripts
 $\textrm {I}$ and
 $\textrm {II}$, respectively. The downward arrows symbolize cost reduction. The feedback symbols indicate whether (✓) or not (
 $\times$) feedback is a necessary feature for the control. Here
 $\widetilde \sigma$ designates the normalized standard deviation of the downstream velocity.

Summarizing, the feedback in stabilization is demonstrated as for similar linear control (Rowley & Williams Reference Rowley and Williams2006) and model-based control (Samimy et al. Reference Samimy, Debiasi, Caraballo, Serrani, Yuan, Little and Myatt2007a). The actuation power is shown to be a tiny fraction as compared with stabilizing steady actuation.
The key enabler for the fast learning of feedback control laws directly in the plant is gMLC as regression solver. Genetic programming as evolutionary algorithm explores and populates new local minima while the subplex simplex method efficiently slides down towards the minima exploiting the local gradient information. A comparison between gMLC and MLC confirms the benefits of the gradient-augmented method for the control performance and learning rate. Fast learning is critical for experiments with limited testing budget.
Moreover, the performances of the learned laws in one regime at least partially persist when applied to another regime. Intriguingly, the law obtained in the mode-switching regime outperforms the feedback law for single-frequency regime as it has learned to stabilize the two characteristic frequencies. Parezanović et al. (Reference Parezanović, Cordier, Spohn, Duriez, Noack, Bonnet, Segond, Abel and Brunton2016) made a similar observation for the destabilization of the mixing layer.
We demonstrated the learning capability of gMLC for moderate Reynolds numbers on a single-input single-output (SISO) control experiment. Ongoing work focuses on the learning of multiple-input multiple-output (MIMO) feedback laws in more complex flows. One example is drag reduction of a generic truck model under yaw. Another example is lift increase of an airfoil under angle of attack at a Reynolds number near one million. Hitherto, already the gMLC predecessor, machine learning control (MLC) has been successfully employed in dozens of numerical and experimental plants (Noack Reference Noack2019; Ren et al. Reference Ren, Hu and Tang2020) comprising  $O(10)$ control inputs and
 $O(10)$ control outputs. Future, MIMO control law optimizers may be expected to synergize a spectrum of methods. One example is cluster-based control (Nair et al. Reference Nair, Yeh, Kaiser, Noack, Brunton and Taira2019) which can rapidly learn smooth control laws and deep reinforcement learning (Rabault et al. Reference Rabault, Kuchta, Jensen, Réglade and Cerardi2019, Reference Rabault, Ren, Zhang, Tang and Xu2020; Fan et al. Reference Fan, Yang, Wang, Triantafyllou and Karniadakis2020; Ren, Rabault & Tang Reference Ren, Rabault and Tang2021) which seems to be very efficient in exploiting short-term actuation responses.
Acknowledgements
The authors thank N. Deng and L.R. Pastur for fruitful discussions and enlightening comments, and Maxime Forte of the Multi-Physics Department for Energy (DMPE) of ONERA for the equipment loan and the technical exchanges on the DBD actuator. We are particularly grateful to the anonymous referees for their constructive advice and for proposing additional corroborating experiments.
Funding
This work is supported by the National Science Foundation of China (NSFC) through grants 12172109 and 12172111, by Guangdong province, China, via the Natural Science and Engineering grant 2022A1515011492, by the Shenzhen Research Foundation for Basic Research, China, through grant JCYJ20220531095605012, by the French National Research Agency (ANR) via FLOwCON project ‘Contrôle d’écoulements turbulents en boucle fermée par apprentissage automatique’ funded by the ANR-17-ASTR-0022, the iCODE Institute research project of the IDEX Paris-Saclay and by the Hadamard Mathematics LabEx (LMH) through the grant number ANR-11-LABX-0056-LMH in the ‘Programme des Investissements d'Avenir’. G.Y.C.M. and B.R.N. appreciate generous technical and scientific support from the HangHua company (Dalian, China).
Declaration of interests
The authors report no conflict of interest.
Appendix A. Main oscillation modes in the open cavity flow
As indicated in § 2, our data shown in figure 5 correspond precisely to the more comprehensive results from Basley et al. (Reference Basley, Pastur, Delprat and Lusseyran2013), provided that the boundary layer thickness at the cavity entrance is slightly corrected. Basley et al. (Reference Basley, Pastur, Delprat and Lusseyran2013) presents a space–time and frequency analysis of time-resolved velocity measurements recorded at all points of the open cavity flow in the incompressible limit. The authors give the origin, the coupling, and the prediction of the main spectral features observed when the aspect ratio of the cavity  $L/D$ varies between
 $R=1$ and
 $R=2$. The dynamics studied comprise several frequencies
 $f_\varDelta$,
 $f_\varOmega$,
 $f_b$,
 $f_l$,
 $f_a$,
 $f_r$,
 $f^+$ that interact nonlinearly with each other and their harmonics. The first two are shown as originating from centrifugal instabilities taking place spanwise within the intra-cavity recirculation,
 $f_b$, the so-called edge frequency, and all the following ones are directly associated with the shear layer instability.
We shall not describe the dynamics of the flow as it is presented in detail in Basley et al. (Reference Basley, Pastur, Delprat and Lusseyran2013). Figure 23, extracted from Basley et al. (Reference Basley, Pastur, Delprat and Lusseyran2013), highlights the interest of the open cavity as a benchmark of adjustable complexity for the development of machine learning algorithms. Beyond the benchmark role, the open cavity is still one of the flow configurations frequently encountered in industrial applications such as transportation systems and still has a strong impact on the performance and noise level of these vehicles.
Strouhal numbers for the main oscillation modes are displayed as functions of the dimensionless cavity length  $L/\theta _0$. Self-sustained oscillations frequencies (black boxes), side-band peaks (grey boxes) and low frequencies (white boxes). Rectangle dimensions represent uncertainties. The shaded area (yellow) is drawn a posteriori to separate self-sustained oscillation frequencies from most side-band peaks. It is delimited by
 $St^{L} = St^{L}_{*} \pm 1/3$,with
 $St^{L}_{*} = 0.014 ( L/\theta _0-10 )$ the centreline Strouhal number. Hatched regions highlight side-band frequencies departing from the general scheme. Note that in this graph,
 $U_0$ corresponds to
 $U_\infty$ of the present paper. Figure and legend reproduced from Basley et al. (Reference Basley, Pastur, Delprat and Lusseyran2013, figure 3), with the permission of AIP Publishing.

Appendix B. Comparison between gMLC and MLC
In this appendix, we compare the learning performance of machine learning control (Duriez et al. Reference Duriez, Brunton and Noack2017, MLC) and gMLC (§ 3.3) for the same experimental conditions as those of § 4.3, i.e. we aim again to mitigate the oscillations of the mixing layer in the narrow-bandwidth regime. As a reminder, the narrow-bandwidth regime is described in § 2.5.
We recall that MLC differs from gMLC in two respects. First, evolution consists of improving a group of individuals through generations. Second, unlike gMLC, no gradient information is employed. The first generation of randomly generated individuals evolves through the evolution phases thanks to three genetic operations:
• Crossover: two new individuals are generated by stochastic recombination of two individuals, exploiting parts of the parent individuals.
• Mutation: a new individual is generated by a stochastic modification in one individual, the resulting individual may share new structures or generate new ones depending on the impact of the change.
• Replication: an identical copy of one individual is generated, assuring the memory of good individuals throughout the generations.
The genetic operators are applied to the better-performing individuals to generate the next generations of individuals. The best individuals are selected with a tournament selection method. As suggested in Duriez et al. (Reference Duriez, Brunton and Noack2017), a tournament selection of size of 7 for 100 individuals is chosen. Genetic operations are chosen randomly following given probabilities: the crossover probability  $P_c$, the mutation probability
 $P_m$, and the replication probability
 $P_r$. The probabilities add up to unity
 $P_c + P_m + P_r = 1$. Following Cornejo Maceda et al. (Reference Cornejo Maceda, Li, Lusseyran, Morzyński and Noack2021), we choose
 $[P_c, P_m, P_r ] = [0.6, 0.3, 0.1]$ as for this set of parameters MLC converges towards better solutions in average and has one of the lowest dispersion of the final solution. Moreover, an elitism operator, transferring the best individual of one generation to the next, is employed to assure that the best individual does not get lost. The parameters employed for the definition of the control laws are the same as for gMLC, see table 4. The individuals are evaluated over
 $T_{ev}=40$ s for both the gMLC and MLC experiments. For a fair comparison, a population of 100 individuals is chosen to evolve over 10 generations, for a total of 1000 individuals.
Figure 24 shows the learning process of MLC and the distribution of the individuals evaluated following their cost  $J$. We note that most of the learning is unusually done at the MCS phase, where the cost is reduced to
 $J = 0.12$. The next improvement is carried out at the 8th generation, where the cost of the best control law slightly decreases to
 $J=0.10$ and the associated standard deviation is
 $\tilde \sigma =1.59$. Such a type of control law has been encountered in most of MLC realizations. We take a particular case where the MCS phase is particularly efficient and where the evolutionary phases do not allow us to leave this local minimum. It is then necessary to wait for 2000 evaluations to reach performances similar to gMLC, the final cost being
 $J=0.05$ and the standard deviation dropping to
 $\tilde \sigma = 0.73$. For 700 evaluations, gMLC already reduced the cost function to
 $J=0.02$. As described in § 4.3, the progress of gMLC results on one side, from the exploration of the control law space with the crossover and mutation operators and, on the other side, from the exploitation with the gradient descent performed with downhill simplex. Therefore, for a same number of evaluations, gMLC surpasses MLC both in terms of learning speed and performance of the final solution. By multiplying the gains in terms of speed and cost, gMLC outperforms MLC by one order of magnitude. The benefits of gMLC over MLC have been described in Cornejo Maceda et al. (Reference Cornejo Maceda, Li, Lusseyran, Morzyński and Noack2021) for computational fluid dynamics, and it is now demonstrated in experimental conditions for the open cavity.
Distribution of the costs during the MLC optimization process. Each dot represents the cost  $J$ of one individual. The colour of the dots represents how the individuals have been generated. Black dots for the individuals randomly generated by MCS (individuals
 $i=1,\ldots,100$), blue dots for the individuals generated with genetic operator (individuals
 $i=101,\ldots,1000$). For each generation the individuals have been sorted according to their cost. The red line shows the evolution of the best cost for the MLC optimization process. The green line corresponds to the gMLC optimization process. The vertical axis is in
 $\log _{10}$ scale.

Appendix C. Gradient-enriched MLC laws
In this appendix, we describe the control laws derived with gMLC. In § C.1, we detail the control law learned in the narrow-bandwidth regime  $K^{\textrm {I}}$ (§ 4.3) and in § C.2, we give more insight on the control law learned in the mode-switching regime
 $K^{\textrm {II}}$ (§ 4.4).
C.1. Control law learned in the narrow-bandwidth regime,  $K^{\textrm {I}}$

The control law  $K^{\textrm {I}}$ learned by gMLC in the narrow-bandwidth regime is a linear combination of 19 control laws; it is rewritten in (C1). We recall that the division and logarithm operations are protected to be defined over all the real values. We note that
 $K^{\textrm {I}}$ includes all feedback signals at least one time except sensor
 $a_8 = u(t-7T_s)$ that is missing. Sensors
 $a_1$ and
 $a_2$ are present in a majority; 12 occurrences for
 $a_1$ and 5 for
 $a_2$, supporting the possibility of phasor control as a control mechanism. Table 7 breaks down the control law
 $K^{\textrm {I}}$ into a linear combination of control laws. We note that nine additional control laws (
 $\#11$ to
 $\#19$) have been introduced in the simplex due to the exploration phases. Moreover, the best-performing control law (
 $\#15$) among the 19 control laws is associated with the highest weight. However, control law
 $\#17$ weight is a close second, suggesting that
 $K^{\textrm {I}}$ is mainly composed of control laws
 $\#15$ and
 $\#17$. Also, we note that among the five best control laws, they all include essentially sensor
 $a_1$, advocating that this phase relation may be related to the cavity resonance
 \begin{align} K^{\textrm{I}}
(\boldsymbol a) &={-}0.002318 -0.005459 a_7
-\frac{0.000626}{\sin(a_3)}
-0.001108\log(\sin(\exp(a_4)))\nonumber\\ & \quad
-\frac{0.009794}{\sin \left( \dfrac{a_2 - 0.079456}{3.2502
/ a_1} \right)} +\frac{0.001799}{a_5}
-\frac{0.002659}{\log(a_6 +2.9498)}\nonumber\\ & \quad
+\frac{0.023733}{\sin \left( \dfrac{0.668879}{3.2502 /
a_1} \right)} +0.15732\sin(3.2502 + a_1)
+0.053174\sin(\log(a_4 - a_2))\nonumber\\ & \quad
-0.031016\tanh( \log(a_{10}) - \sin(a_2) (2.9498-1.00278
a_1))\nonumber\\ & \quad +0.46563\sin( 2.71881 + a_1 +
\sin(\tanh(\sin(a_2))))\nonumber\\ & \quad
+0.08288\tanh(a_1-3.48119 + \sin(\tanh(\sin(a_2))))\nonumber\\ & \quad
+0.43035\sin(3.190735 + a_1)\nonumber\\ & \quad -0.16553
\left( \log(a_1) - \exp \left( 1.526921 \frac{a_9 /
\exp(a_1)}{a_9 + \exp(a_1)} \right) \right)\nonumber\\ &
\quad+0.048964\sin(2.71881 + a_1 + \sin(\tanh(\sin(a_1)))),
\end{align}
 $$\begin{gather} {J_a}^{\textrm{I}} = 0.0129, \end{gather}$$
 $$\begin{gather}{J_b}^{\textrm{I}} = 0.0063, \end{gather}$$
 $$\begin{gather}{\tilde{\sigma}}^{\textrm{I}}= 60.59\,\%. \end{gather}$$
Summary of the 19 control laws composing  $K^{\textrm {I}}$ described in (C1). For each control law, we present the mathematical expression
 $b$, its weight in
 $K^{\textrm {I}}$ and cost
 $J$. The three best-performing control laws
 $\#15$,
 $\#18$ and
 $\#19$ are highlighted in bold.
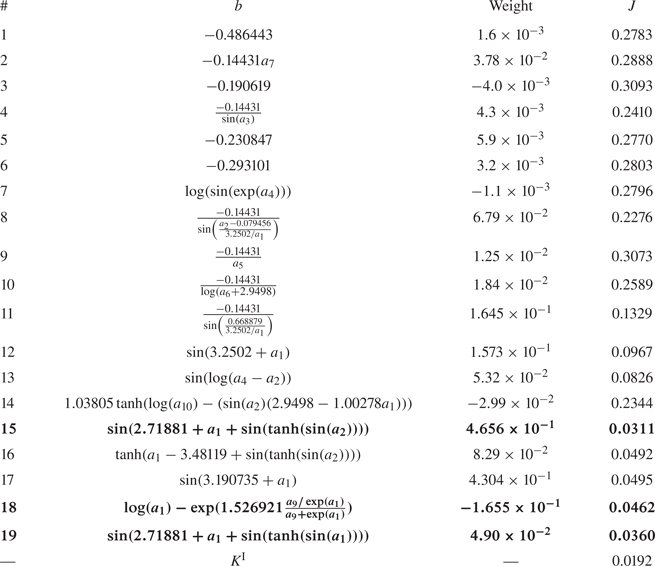
C.2. Control law learned in the mode-switching regime, $K^{\textrm {II}}$

The control law  $K^{\textrm {II}}$ learned by gMLC in the mode-switching regime is a linear combination of several control laws, see (C5)
 \begin{align} K^{\textrm{II}} (\boldsymbol a)&={-}0.045324 +0.10642\tanh(\sin(\log(\log(a_4)))) -0.065719\log(\sin(\exp(a_4)))\nonumber\\ & \quad +0.80925\log((a_1 - a_4))\nonumber\\ & \quad +0.29696\log(\sin(- \exp(a_3) - a_9 + a_4 -0.022658))\nonumber\\ & \quad -0.00047578\log(\log(\sin(- \exp(a_3) - a_9 + a_4 -0.022658))) \nonumber\\ & \quad -0.092056\log(\sin(- \exp(a_3) - 0.387155))\nonumber\\ & \quad +0.14116\log(\sin(- a_3-1.022513))\nonumber\\ & \quad -0.23223\log\left(a_4 \tanh\left(\frac{\log(a_4)}{a_6}\right)\right) -0.19296(a_9 - a_4 -0.63772 )\nonumber\\ & \quad -0.0023331\log\left(\sin\left(\sin\left(- 4.7665\log\left(\frac{a_4}{0.424163}\right)\right)\right)\right), \end{align}
 $$\begin{gather} {J_a}^{\textrm{II}} = 0.0335, \end{gather}$$
 $$\begin{gather}{J_b}^{\textrm{II}} = 0.0229, \end{gather}$$
 $$\begin{gather}{\tilde{\sigma}}^{\textrm{II}} = 97.37\,\%. \end{gather}$$
Interestingly, in contrast to the narrow-bandwidth regime, the best control law,  $K^{\textrm {II}}$, includes mostly delayed sensor signals: four instances of
 $a_3$ and nine instances of
 $a_4$. Table 8 details the 11 control laws that constitute
 $K^{\textrm {II}}$. We note that the best-performing control law (
 $\#4$) is the one with the highest weight. It is worth noting that the control law
 $\#4$ is a function of a phase difference which may be reminiscent of a Pyragas-type control (Pyragas Reference Pyragas1995).
Summary of the 11 control laws composing  $K^{\textrm {II}}$ described in (C5). For each control law, we present the mathematical expression
 $b$, its weight in
 $K^{\textrm {II}}$ and cost
 $J$. The three best control laws
 $\#4$,
 $\#8$ and
 $\#11$ are highlighted in bold.
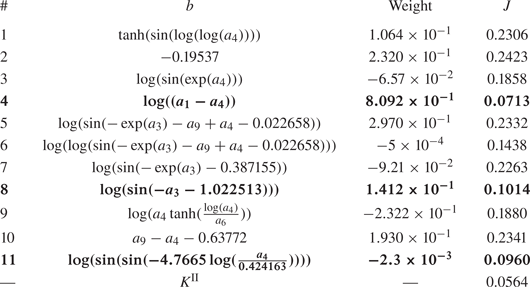
Appendix D. Actuation spectral analysis
In this appendix, we provide the power spectra of the actuation commands for the narrow-bandwidth regime and the mode-switching regime controlled by the control laws  $K^{\textrm {I}}$ and
 $K^{\textrm {II}}$.
When both regimes are controlled with  $K^I$ (figures 25a and 25d), the actuation command and the velocity measured downstream have a similar spectral signature suggesting a linear relationship between them. This analysis is partially consistent with the analytical interpretation performed in §§ 4.3 and 5.2 as
 $K^{\textrm {I}}$ enables a complex phase relationship between the actuation and the sensing.
Spectra of the actuation command and the velocity measured by the hot-wire sensor downstream. (a) Narrow-bandwidth regime controlled by  $K^{\textrm {I}}$. (b) Mode-switching regime controlled by
 $K^{\textrm {II}}$. (c) Narrow-bandwidth regime controlled by
 $K^{\textrm {II}}$. (d) Mode-switching regime controlled by
 $K^{\textrm {I}}$.

As for  $K^{\textrm {II}}$, in both regimes, the spectrum of the actuation command differs from the spectrum of the velocity measured downstream. For the control of the mode-switching regime (figure 25b), the spectrum does not display any significant peak except for the very low frequencies. The actuation command seems to correspond to a random noise without any correlation with the velocity measured downstream, suggesting that
 $K^{\textrm {II}}$ does not exploit the sensor information for the control, as shown in § 4.4. Nevertheless, the control of the narrow-bandwidth regime shows otherwise since the spectrum associated with the actuation command clearly shows two peaks, one at
 $2f_a$ and
 $2f^+$ (see figure 25c). The presence of the peak at
 $2f_a$ is consistent with the interpretation of the cluster-based control visualization, suggesting a control at twice the main frequency of the flow
 $f_a$ (see figure 13). A systematic evaluation of all the control laws composing
 $K^{\textrm {II}}$ (see table 8) shows that it is the term
 $\log ((a_1-a_4))$ that is responsible for the frequency doubling, due to the absolute value function included for the generalization of
 $\log$ to negative values. The spectrum of
 $|a_1-a_4|$ shows the same peaks of the actuation command produced by
 $K^{\textrm {II}}$.
Appendix E. Global stabilization of the cavity
In this section, the global stabilization of the cavity flow along the spanwise direction is demonstrated for feedback control in the mode-switching regime. Like in § 4, a closed-loop control law has been learned by feeding back velocity information from the hot-wire HW1 located at the centreline of the cavity, see figure 26(a). An additional hot-wire (HW2), positioned at  $1.48D$ of the first one and
 $2$ mm upstream, records the flow velocity of the evaluated individuals. The hot-wire HW2 is located at the limit of the coherence length, defined in § 5.4 and far enough from the damping region of the Ekman layer. This second hot-wire sensor is also located at
 $y=2$ mm, in the core of the mixing layer instability. We recall that hot-wire HW1 is located at
 $y=6$ mm to limit the low-velocity incursions for the control, see § 2.5. The same gMLC parameters have been employed as in § 4 for the learning, and 1000 control laws have been evaluated. The costs of the best control law are
 $J_a=0.0320$ and
 $J_b=0.0451$. This new control law performs quantitatively as well as the control law
 $K^{\textrm {II}}$ from § 4.4 but is less efficient as the standard deviation of the velocity signal is slightly increased (
 $\tilde {\sigma }=104.44\,\%$). Figures 26(b) and 26(c) show the peak reductions for the hot-wires HW1 and HW2, respectively. The controlled spectra have been obtained by averaging 20 re-evaluations, whereas the unforced ones are obtained by averaging 200 realizations recorded during the learning process. First, for the first hot-wire (HW1), the two main frequencies of the cavity (
 $\,f_a$ and
 $f^+$) are controlled similarly to the control achieved with
 $K^{\textrm {II}}$. Second, figure 26(c) shows that the amplitude of both peaks (
 $\,f_a$ and
 $f^+$) have also been reduced for the hot-wire HW2. The control of the frequencies
 $f_a$ and
 $f^+$ beyond the coherence length shows the effective stabilization of the flow in the spanwise direction.
Spectra of additional hot-wire probes at different spanwise positions in the controlled mode-switching regime. (a) Hot-wire sensor positions. Only hot-wire HW1 is employed for the feedback control. Hot-wires HW2 and HW3 simultaneously measure the velocity at different spanwise locations. The height of hot-wires HW2 and HW3 is at  $y=2$ mm, i.e. lower than hot-wire HW1 (
 $y=6$ mm), (b) Velocity spectrum measured by the first hot-wire (HW1) during the control of the mode-switching regime. The unforced and control spectra are averaged over 200 and 20 realizations, respectively, (c) Velocity spectrum measured by the second hot-wire (HW2) during the control of the mode-switching regime. The unforced and control spectra are averaged over 200 and 20 realizations, respectively and (d) Velocity spectrum measured by the third hot-wire (HW3) during the control of the mode-switching regime. The unforced and control spectra are averaged over 20 realizations.

Measurements of the unforced and controlled flows have been repeated, but with the second hot-wire placed at the position HW3 as indicated in figure 26(a). The averaged spectra of the unforced and controlled flows are plotted in figure 26(d). We note that both peaks have been effectively mitigated. However, the peak reduction of the second frequency ( $\,f^+$) is less pronounced than for the two hot-wire locations HW1 and HW2. Summarizing, the mitigation of the dominant peaks at different spanwise locations corroborates the global stabilization by feedback from the centre plane.


 Open access

