

INTRODUCTION
Chemical fingerprints recorded in fish otoliths have the potential to resolve outstanding questions about fish stock and migration dynamics of a wide variety of species. Otoliths are structures composed mainly of calcium carbonate deposited as aragonite, vaterite or calcite crystals in a protein matrix (otoline), and small quantities of other chemical elements (Campana et al., Reference Campana, Thorrold, Jones, Gunther, Tubrett, Longerich, Jackson, Halden, Kalish, Piccoli, de Pontual, Troadec, Panfili, Secor, Severin, Sie, Thresher, Teesdale and Campbell1997). These elements are deposited in the otolith during ontogeny and as the material is not re-absorbed, their concentrations may reflect the life history of the fish (Schuchert et al., Reference Schuchert, Arkhipkin and Koenig2010; Mai et al., Reference Mai, Condini, Albuquerque, Loebmann, Saint'Pierre, Miekeley and Vieira2014; Avigliano et al., Reference Avigliano, Velasco and Volpedo2015a, Reference Avigliano, Velasco and Volpedob; Phung et al., Reference Phung, Tulp, Baeyens, Elskens, Leermakers and Gao2015; Reis-Santos et al., Reference Reis-Santos, Tanner, França, Vasconcelos, Gillanders and Cabral2015). In particular, divalent elements such as strontium (Sr) and barium (Ba), replacing Ca in the matrix of the otolith, have been widely used to study displacements in salt gradients (Doubleday et al., Reference Doubleday, Harris, Izzo and Gillanders2014), with the premise that Sr in the otolith is positively related to salinity, while Ba shows the opposite behaviour (Bath et al., Reference Bath, Thorrold, Jones, Campana, McLaren and Lam2000; Secor & Rooker, Reference Secor and Rooker2000; Kraus & Secor, Reference Kraus and Secor2004; Martin & Thorrold, Reference Martin and Thorrold2005; Avigliano & Volpedo, Reference Avigliano and Volpedo2013). Moreover, other elements such as Li, Zn, Mn and Mg deposited in the otolith are influenced by different factors, such as water, diet, temperature etc. (Ranaldi & Gagnon, Reference Ranaldi and Gagnon2008; Bouchard et al., Reference Bouchard, Thorrold and Fortier2015). Thanks to these characteristics, otolith chemistry has been a useful tool for studying the life history of fish (Nordlie, Reference Nordlie2012; Lin et al., Reference Lin, Jessop, Weyl, Iizuka, Lin and Tzeng2014; Mai et al., Reference Mai, Condini, Albuquerque, Loebmann, Saint'Pierre, Miekeley and Vieira2014), discriminating stocks (Campana et al., Reference Campana, Chouinard, Hanson, Fréchet and Brattey2000; Ferguson et al., Reference Ferguson, Ward and Gillanders2011; Avigliano et al., Reference Avigliano, Velasco and Volpedo2015a) and identifying nursery areas (Brown, Reference Brown2006; Vasconcelos et al., Reference Vasconcelos, Reis-Santos, Tanner, Maia, Latkoczy, Günther, Costa and Cabral2008; Leakey et al., Reference Leakey, Attrill and Fitzsimons2009; Avigliano et al., Reference Avigliano, Velasco and Volpedo2015a; Bailey et al., Reference Bailey, Fairchild and Kalnejais2015).
In general, to discriminate stocks, only the edge of the otolith is used, since it represents the final stage of life of the fish (Schuchert et al., Reference Schuchert, Arkhipkin and Koenig2010; Fairclough et al., Reference Fairclough, Edmonds, Jackson, Lenanton, Kemp, Molony, Keay, Crisafulli and Wakefield2013). Whereas to identify nursery areas, the chemistry core is used because it corresponds to the larval stage (Rooker et al., Reference Rooker, Secor, DeMetrio, Kaufman, Ríos and Tičina2008; Bouchard et al., Reference Bouchard, Thorrold and Fortier2015). Unlike the study of chemicals of the otolith core in juvenile fish, this same analysis made in adult fish allows inferring about ontogenetic movements, homing behaviour, etc. For example, the existence of significant differences in the chemical signature of the otolith core in adult fish is an indicator that they use their birth areas as breeding sites without mixing (Gillanders et al., Reference Gillanders, Able, Brown, Eggleston and Sheridan2003; Rooker et al., Reference Rooker, Secor, DeMetrio, Kaufman, Ríos and Tičina2008; Avigliano et al., Reference Avigliano, Velasco and Volpedo2015a). Finally, by making comparisons between the chemistry of the edge and that of the core, it is possible to estimate, in retrospect, the site of origin of fish using different analytical methods (Bradbury et al., Reference Bradbury, Campana and Bentzen2008; Rooker et al., Reference Rooker, Secor, DeMetrio, Kaufman, Ríos and Tičina2008; Avigliano et al., Reference Avigliano, Carvalho, Velasco, Tripodi, Vianna and Volpedo2016).
The catfish Genidens barbus (Lacépède 1803) is distributed between latitudes 17°00′S and 40°32′S (López & Bellisio, Reference López, Bellisio and López1965; Avigliano & Volpedo, Reference Avigliano and Volpedo2015) and was one of the most important fishery resources in estuaries and rivers of south-western South America (Reis, Reference Reis1986a; Tavares & Luque, Reference Tavares and Luque2004; Velasco et al., Reference Velasco, Reis and Vieira2007; Minagro, 2016). Baigún et al. (Reference Baigún, Colautti, López, Van Damme and Reis2012) classified the species as vulnerable for Uruguayan and Argentinean waters due to its complex life cycle (low fecundity, oral incubation and the critical status of the species fishery). For the same reason, the species was included in the Red List of endangered species in Brazil, with capture, transport and trade prohibited since 2015 (MMA, 2014; Di Dario et al., Reference Di Dario, Alves, Boos, Frédou, Lessa, Mincarone, Pinheiro, Polaz, Reis, Rocha, Santana, Santos, Santos, Vianna and Vieira2015).
Recently, Avigliano et al. (Reference Avigliano, Carvalho, Velasco, Tripodi, Vianna and Volpedo2016) and (Reference Avigliano, Velasco and Volpedo2015a) have shown the existence of different nursery areas of catfish and have suggested the presence of homing behaviour in Patos Lagoon (Brazil) and Plata River (Argentina–Uruguay) using the chemical composition from otolith cores. Therefore, the quality of the nursery areas is critical, and understanding the connectivity between nursery sources and adult populations can lead to more effective management and rebuilding of the fishery in the south-western Atlantic Ocean (Beck et al., Reference Beck, Heck, Able, Childers, Eggleston, Gillanders, Halpern, Hays, Hoshino, Minello, Orth, Sheridan and Weinstein2001; Vasconcelos et al., Reference Vasconcelos, Reis-Santos, Costa and Cabral2011). Although this prior work comprehensively addresses the spatial variability in these chemical tracers, inter-annual variability has not been thoroughly investigated for these systems. The stability in the chemical composition of the otolith core is a basic requirement for monitoring nursery areas, especially when studying or comparing different cohorts of fish (Hamer et al., Reference Hamer, Jenkins and Gillanders2003; Patterson et al., Reference Patterson, Cowan, Wilson and Chen2008; Walther & Thorrold, Reference Walther and Thorrold2009; Tournois et al., Reference Tournois, Ferraton, Velez, McKenzie, Aliaume, Mercier and Darnaude2013). In this regard, it is important to determine whether there is inter-annual variation so as not to misinterpret the conclusions (Patterson et al., Reference Patterson, Cowan, Wilson and Chen2008; Walther & Thorrold, Reference Walther and Thorrold2009; Reis-Santos et al., Reference Reis-Santos, Gillanders, Tanner, Vasconcelos, Elsdon and Cabral2012; Tournois et al., Reference Tournois, Ferraton, Velez, McKenzie, Aliaume, Mercier and Darnaude2013). Moreover, the existence of inter-annual variation would make it impossible to use otolith chemistry to retrospectively identify juvenile habitat use.
Ideally the temporal variability assessment would be made using juveniles collected in different years before there is significant opportunity for mixing. However, it has been shown that connectivity (spatial variability) among the studied estuaries is very low or null, especially among estuaries of Brazil (Avigliano et al., Reference Avigliano, Carvalho, Velasco, Tripodi, Vianna and Volpedo2016). Via quadratic discriminant function analysis of otolith core chemistry, Avigliano et al. (Reference Avigliano, Carvalho, Velasco, Tripodi, Vianna and Volpedo2016) obtained percentages of classified back to natal nursery areas with 100% cross-validation classification accuracies in the cohorts 2002, 2003, 2006 and 2007 (except 2002 cohort among PR and PL with 80–96% classification accuracies). This indicates that otolith core chemistry of adults G. barbus represents a good habitat marker for the study and monitoring of nursery areas. Then, the primary and fundamental assumption made here is that there was no mixing of fish between estuaries between juvenile and adult stages.
Here, we expand on our previous work to examine inter-annual variability in otolith chemical signatures. In this sense, our objective was to examine the inter-annual variability in estuary-specific signatures for three estuaries where adults were collected over multiple years. Secondarily, we evaluate whether the percentages of classification of individuals to their natal origin place are affected by the grouping of several cohorts. For this, we assessed the performance of quadratic discriminant functions to spatially discriminate nursery areas using grouped or separated cohorts. These data are used to discuss potential errors that could arise if migrants are not classified using baseline signatures from the appropriate cohort.
MATERIALS AND METHODS
Study area
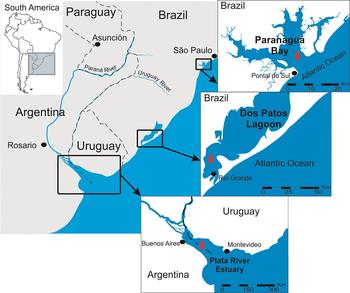
Samplings were conducted in the Paranaguá Bay (PB), Patos Lagoon (PL) and Plata estuary (PE) (Figure 1) from north to south. The Paranaguá Bay estuary (PB) is 601 km2 in area (Figure 1) and is connected with the adjacent continental platform by the channels Galheta and Sudeste (Angulo & Araújo, Reference Angulo and Araújo1996). This system is located in the mountain subtropical rainforest ecoregion (25°28′53.21″S–48°24′41.06″W). Temperature water varied from 18–25°C in winter to 23–30°C in summer while salinity ranged from 12–29 in winter to 20–34 in summer (Lana et al., Reference Lana, Marone, Lopes and Machado2001). The Patos Lagoon (PL) is a large coastal lagoon located on the coast plain of Río Grande do Sul (Brazil) (31°29′59.31″S–51°40′46.24″W), with a total area of 10 360 km2 and is connected to the Atlantic Ocean by a narrow channel that is 4 km long and 740 m wide (Figure 1). The southern part of the system is occupied by an estuary (10% of the lagoon area). Temperature range is 12°C in winter to 27.5°C in summer (Muxagata et al., Reference Muxagata, Amaral and Barbosa2012) and shows changes in salinity over hourly periods, but the average salinity (0–32) follows a seasonal pattern (dry summer and wet winter) influenced primarily by rainfall and wind direction (Seeliger et al., Reference Seeliger, Odebrecht and Castello1997). Plata River estuary (PR) is the most important coastal ecosystems from Plata Basin (Argentina and Uruguay), with a total area of 10 360 km2 and an average discharge of 23 000 m3 s−1 towards the Atlantic Ocean (Guerrero et al., Reference Guerrero, Acha, Framiñan and Lasta1997). This system is located in the Pampan plain (35°48′6.07″S–6°14′52.92″W) and shows variation of temperatures between 8–24°C (Guerrero et al., Reference Guerrero, Acha, Framiñan and Lasta1997), highly variability salinity (0–32) and stratification during the year (Acha et al., Reference Acha, Mianzan, Guerrero, Carreto, Giberto, Montoya and Carignan2008).
Sampling sites of the catfish Genidens barbus (red arrows).

Sampling
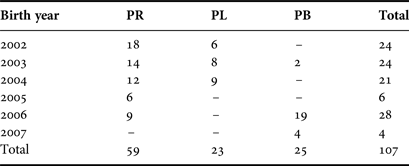
Adult catfish were caught in three estuaries (Figure 1) with hooks, longlines and gillnets, at depths ranging from 8 to 33 m between November 2010 and May 2015. Fishes between 7–12 years (total length range: 42–84 cm) were selected for analysis (total N = 107) (Table 1). The total length (in cm) was recorded and both lapilli otoliths were removed, rinsed with ultrapure water and cleaned of any remaining tissue with a plastic toothbrush. Lapilli otoliths were used rather than sagittae otoliths because they were larger and allowed less measurement error.
Number of specimens of Genidens barbus per group (birth year or year-class) and sampling site. PR, Plata River; PL, Patos Lagoon and PB, Paranaguá Bay.

Age determination and sample preparation
In this study, the core of the otolith representing 0+ age was isolated following the methodology (manual micromilling) proposed by Avigliano et al. (Reference Avigliano, Carvalho, Velasco, Tripodi, Vianna and Volpedo2016). This age corresponds to the early months of life that occur between the fresh water or estuary, where the species spawns (Reis, Reference Reis1986b; Araújo, Reference Araújo1988; Pereyra et al., Reference Pereyra, Mont'Alverne and Garcia2016).
The left otolith of each pair was weighed, washed with ultrapure water, dried and embedded in crystal epoxy resin. Only left otoliths were used to avoid possible differences in the chemical composition of right and left otholits (Loher et al., Reference Loher, Wischniowski and Martin2008). Next, the otolith was sectioned transversely through the core to a thickness of 1000 µm using a Buehler® Isomet low speed saw equipped with twin diamond edge blades (15 HC series). Age was determined by counting of the rings in the otolith section immersed in ultrapure water, using a stereomicroscope (Leica® EZ4-HD, Singapore) at 8× magnification, by two independent observers. Age determination by counting the ring (annuli) number in lapilli otoliths of G. barbus was validated by Reis (Reference Reis1986a).
The precision of the age determinations between two readers was calculated by using the following equation of index of average percentage error (IAPE) (Beamish & Fournier, Reference Beamish and Fournier1981):
 $${\rm IAPE}j = \displaystyle{1 \over N}\mathop \sum \limits_{\,j = 1}^N \left( {\displaystyle{1 \over R}\mathop \sum \limits_{i = 1}^R \displaystyle{{ \vert X_{ij} - X_j \vert} \over {X_j}}} \right) \times 100$$
where N is the number of fish aged, R is the number of times each fish is aged, X ij is the age determination of the j fish, X j is the mean age calculated for the j fish.
IAPE between the two independent readers was relatively low (1.31%).
According to Avigliano et al. (Reference Avigliano, Carvalho, Velasco, Tripodi, Vianna and Volpedo2016) and Holden & Raitt (Reference Holden and Raitt1974), to avoid possible year-class or cohort effect in trace elements composition of the otoliths, the year of birth of fish was calculated by subtracting the number of annuli from the capture date. Then, the year-class or cohort represents the year fish were born (Table 1).
Otolith cores were exposed in the sections by polishing the rings from the margin to the core with a high speed lathe (Dremel 300) equipped with a diamond blade (Dremel EZ545-EZ), under a stereomicroscope (Leica® Zoom 2000 Z30 V) (Buffalo, NY, USA) in a laminar flow hood. Sections were washed with Milli-Q water (18.2 MΩ) (Millipore, Sao Paulo, Brazil) to remove dust contamination from the micromilling process. Once dry, the cored material was removed carefully from the section using forceps, washed in Milli-Q water and dried. Otolith cores were transferred to a sterile centrifuge tube and weighed using a Sartorius AG® ED2242 (Göttingen, Germany) microbalance to the nearest 0.0001 g. After weighing, cores were decontaminated with 1% HNO3 (Arslan & Secor, Reference Arslan and Secor2008) and rinsed 5 times with Milli-Q to remove any contamination from weighing and micromilling, transferred to new sterile centrifuge tubes and dried overnight in a laminar flow hood.
Otolith chemistry
Otolith cores were digested with 10% nitric acid during 48 h (Avigliano et al., Reference Avigliano, Velasco and Volpedo2015a) and the abundances of isotopes 137Ba, 44Ca, 24Mg, 55Mn, 88Sr and 66Zn were determined by inductively coupled plasma mass spectrometry (ICP-Ms), Agilent 7500 cx (Agilent, Waldbronn, Germany) equipped with a Micro Mist nebulizer for 44Ca and 88Sr and Cross Flow nebulizer for 137Ba, 24Mg, 55Mn and 66Zn. After the analysis of each sample, the instrument was cleaned with Milli-Q water and 5% nitric acid matrix to prevent memory effects.
Multi-element calibration standard 2-A (Quality Control Standard, Agilent Technologies® Pure, Japan) was used as an external standard while scandium, yttrium, terbium and holmium were used as internal standards. All measurements were performed in triplicate (RSD < 4%).
Based on three times the standard deviation, the detection limits for water samples (LOD) in μg l−1 of the blank signal (N = 10) were 0.2 µg l−1 for Ba, Mg, Mn and Zn and 15 µg l−1 for Sr and Ca. Otolith Certified Reference Material for trace elements (FEBS-1, National Research Council, Canada) was used to checked the digestion and analytical procedures. Analysis of these reference materials showed good agreement, with the following element recovery rates: 99% for Ba, 114% for Ca, 105% for Mg, 104% for Mn, 93% for Sr and 114% for Zn.
Trace elements concentration were expressed as molar ratios (mmol element:mol Ca) (Sinclair et al., Reference Sinclair, Kinsley and McCulloch1998; Bailey et al., Reference Bailey, Fairchild and Kalnejais2015).
Data analysis
TEMPORAL VARIABILITY
The element:Ca ratios did not fit the normal distribution and homogeneity of variance (Shapiro–Wilk, P < 0.05; Levene, P < 0.05) even after transformation log (x + 1) or square root. Therefore, non-parametric statistics were used to compare variables between year-classes or cohorts. To ensure that differences in otolith weight (≈fish size) among samples did not confound any temporal patterns in elemental composition, the effect of otolith weight on element ratio was examined used analysis of covariance (ANCOVA, otolith weight as co-variate) (Longmore et al., Reference Longmore, Fogarty, Neat, Brophy, Trueman, Milton and Mariani2010; Kerr & Campana, Reference Kerr, Campana, Cadrin, Kerr and Mariani2013). Mn:Ca ratio (only Patos Lagoon) correlated with otolith weight (P < 0.01, b = −17.23) and was corrected by subtracting the common slope in ANCOVA (Longmore et al., Reference Longmore, Fogarty, Neat, Brophy, Trueman, Milton and Mariani2010; Kerr & Campana, Reference Kerr, Campana, Cadrin, Kerr and Mariani2013). This fit eliminated the effect of otolith weight on the Mn:Ca variable (ANCOVA, P > 0.05). Ba:Ca, Mg:Ca, Sr:Ca and Zn:Ca ratios were not significantly correlated (P > 0.05) with otolith weights and it was not necessary to correct any variable.
Each element:Ca ratio was compared among year cohorts using the Kruskal–Wallis test. Mardia's skewness and kurtosis tests showed multi-dimensional non-normality; hence, permutational multivariate analysis of variance (PERMANOVA) (Anderson, Reference Anderson2001) was used to evaluate the otolith core multi-elemental fingerprints and detect differences in core area from different year-classes for each sampling sites. The analysis was based on Gower distances and under 9999 permutations (Gower, Reference Gower1966). Modified Gower dissimilarity matrix is more appropriate for dealing with multivariate heterogeneity of variance than the Bray–Curtis measure (Anderson et al., Reference Anderson, Ellingsen and McArdle2006).
Finally, discriminant function analyses (DA) were used to assess the ability of otolith elemental ratios to classify adults to their cohorts (Kerr & Campana, Reference Kerr, Campana, Cadrin, Kerr and Mariani2013; Bouchard et al., Reference Bouchard, Thorrold and Fortier2015). Because the assumption of homogeneity of variances-covariances matrices was not met (verified with Bartlett test), quadratic discriminant function analysis (QDA) was used. The expected classification accuracies was calculated based on chance alone given the number of groups and sample sizes (Ruttenberg & Warner, Reference Ruttenberg and Warner2006; White & Ruttenberg, Reference White and Ruttenberg2007). A randomization test was used to determine if the classification success rate was significantly different from random (Hayes, Reference Hayes1998; Ruttenberg & Warner, Reference Ruttenberg and Warner2006; White & Ruttenberg, Reference White and Ruttenberg2007).
Multicollinearity between variables was analysed, thus preventing a false outcome in the QDA analysis and the use of redundant variables in the study (Graham, Reference Graham2003). All statistical tests were performed using the InfoStat 2015, Past 3.01 and SPSS 19 programs.
SPATIAL VARIABILITY
In this work we do not intend to describe the spatial differences, but to assess whether the temporal variation has a strong effect on the spatial classification of individuals. To this end, PERMANOVA and QDA with randomization test were performed for each estuary and cohort separately and, on the other hand, grouping the cohort (just classifying by the location). If there is not a strong temporal variation in some of the estuaries, we expect to obtain similar percentages of classification between both analyses. Previously, normality and homogeneity of variance assumptions were verified with ANCOVA, as well as the relationships between elemental concentration and otolith weight.
RESULTS
Temporal variability
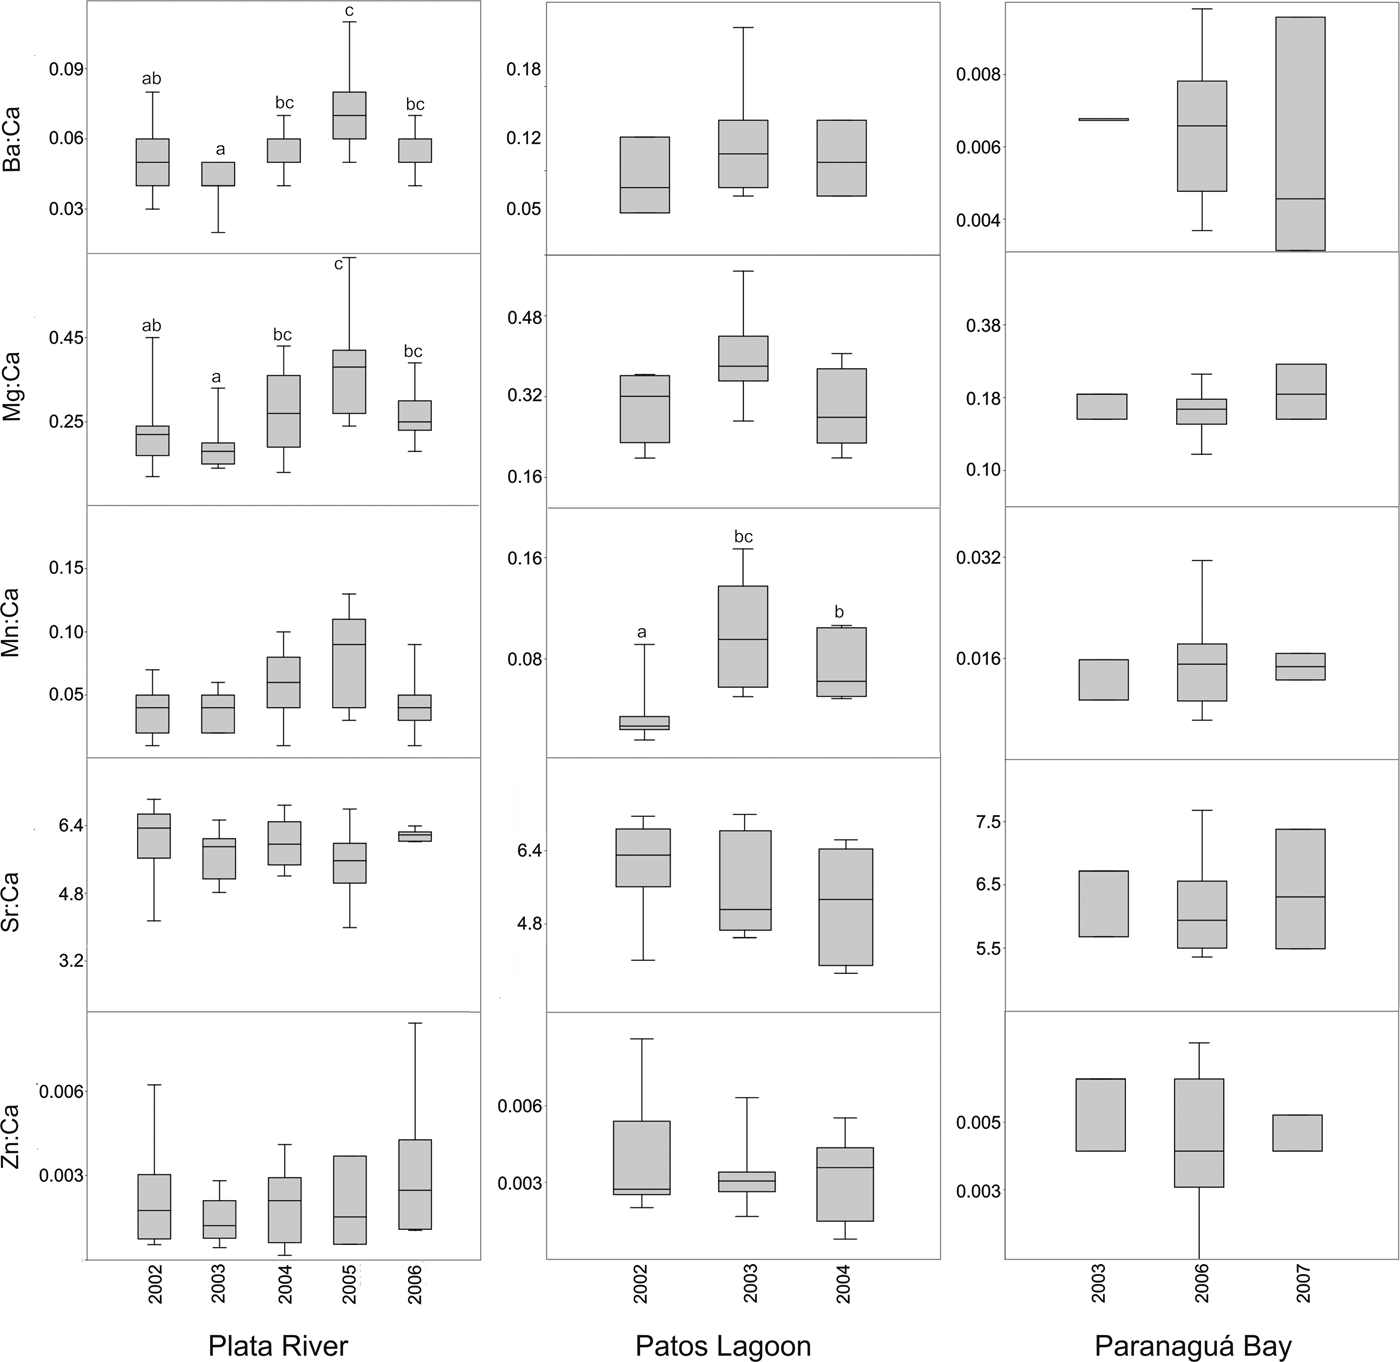
The average values and deviations from element:Ca ratio are shown in Figure 2. Most element:Ca ratios were no significantly different among year cohorts. In the PR, the otolith Mn:Ca, Sr:Ca and Zn:Ca ratios were similar between year-classes (P > 0.06) while Ba:Ca and Mg:Ca were higher for 2005 and lower for 2003 cohort (P < 0.01). In the PL, the otolith Mn:Ca ratio was lowest for 2002, highest for 2003 and intermediate for 2004 (P < 0.02), while Ba:Ca, Mg:Ca, Sr:Ca and Zn:Ca were similar between year-classes (P > 0.05). No significant differences (P > 0.05) were found among year cohorts for PB in element:Ca ratios.
Mean ± SE elemental ratio (mmol/mol) in core of otoliths from different sampling locations for year-classes. Different letters indicate statistical significant differences.

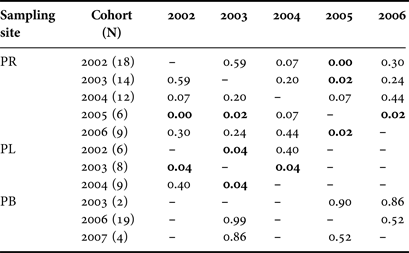
Results from PERMANOVA analysis revealed significant differences in the multi-element signatures of the otolith core between cohorts for the PR (F = 2.9, P = 0.006) and the PL (F = 2.3, P = 0.03) while no significant differences (F = 0.2, P = 0.9) were found for PB. The P values of the PERMANOVA tests among years are shown in Table 2. Specifically for PR, the chemical signature of the 2005 cohort differed significantly from 2002, 2003 and 2006 (Table 2). In the case of PL, 2003 cohort differed from the 2002 and 2004 ones (Table 2).
The P values of the PERMANOVA tests based on multi-elemental composition (Ba:Ca, Mg:Ca, Mn:Ca, Sr:Ca, Ba:Ca and Zn:Ca) of otolith core. PR, Plata River; PL, Patos Lagoon and PB, Paranaguá Bay. Bold text indicates a statistically significant correlation with P < 0.05). N = number of specimens.

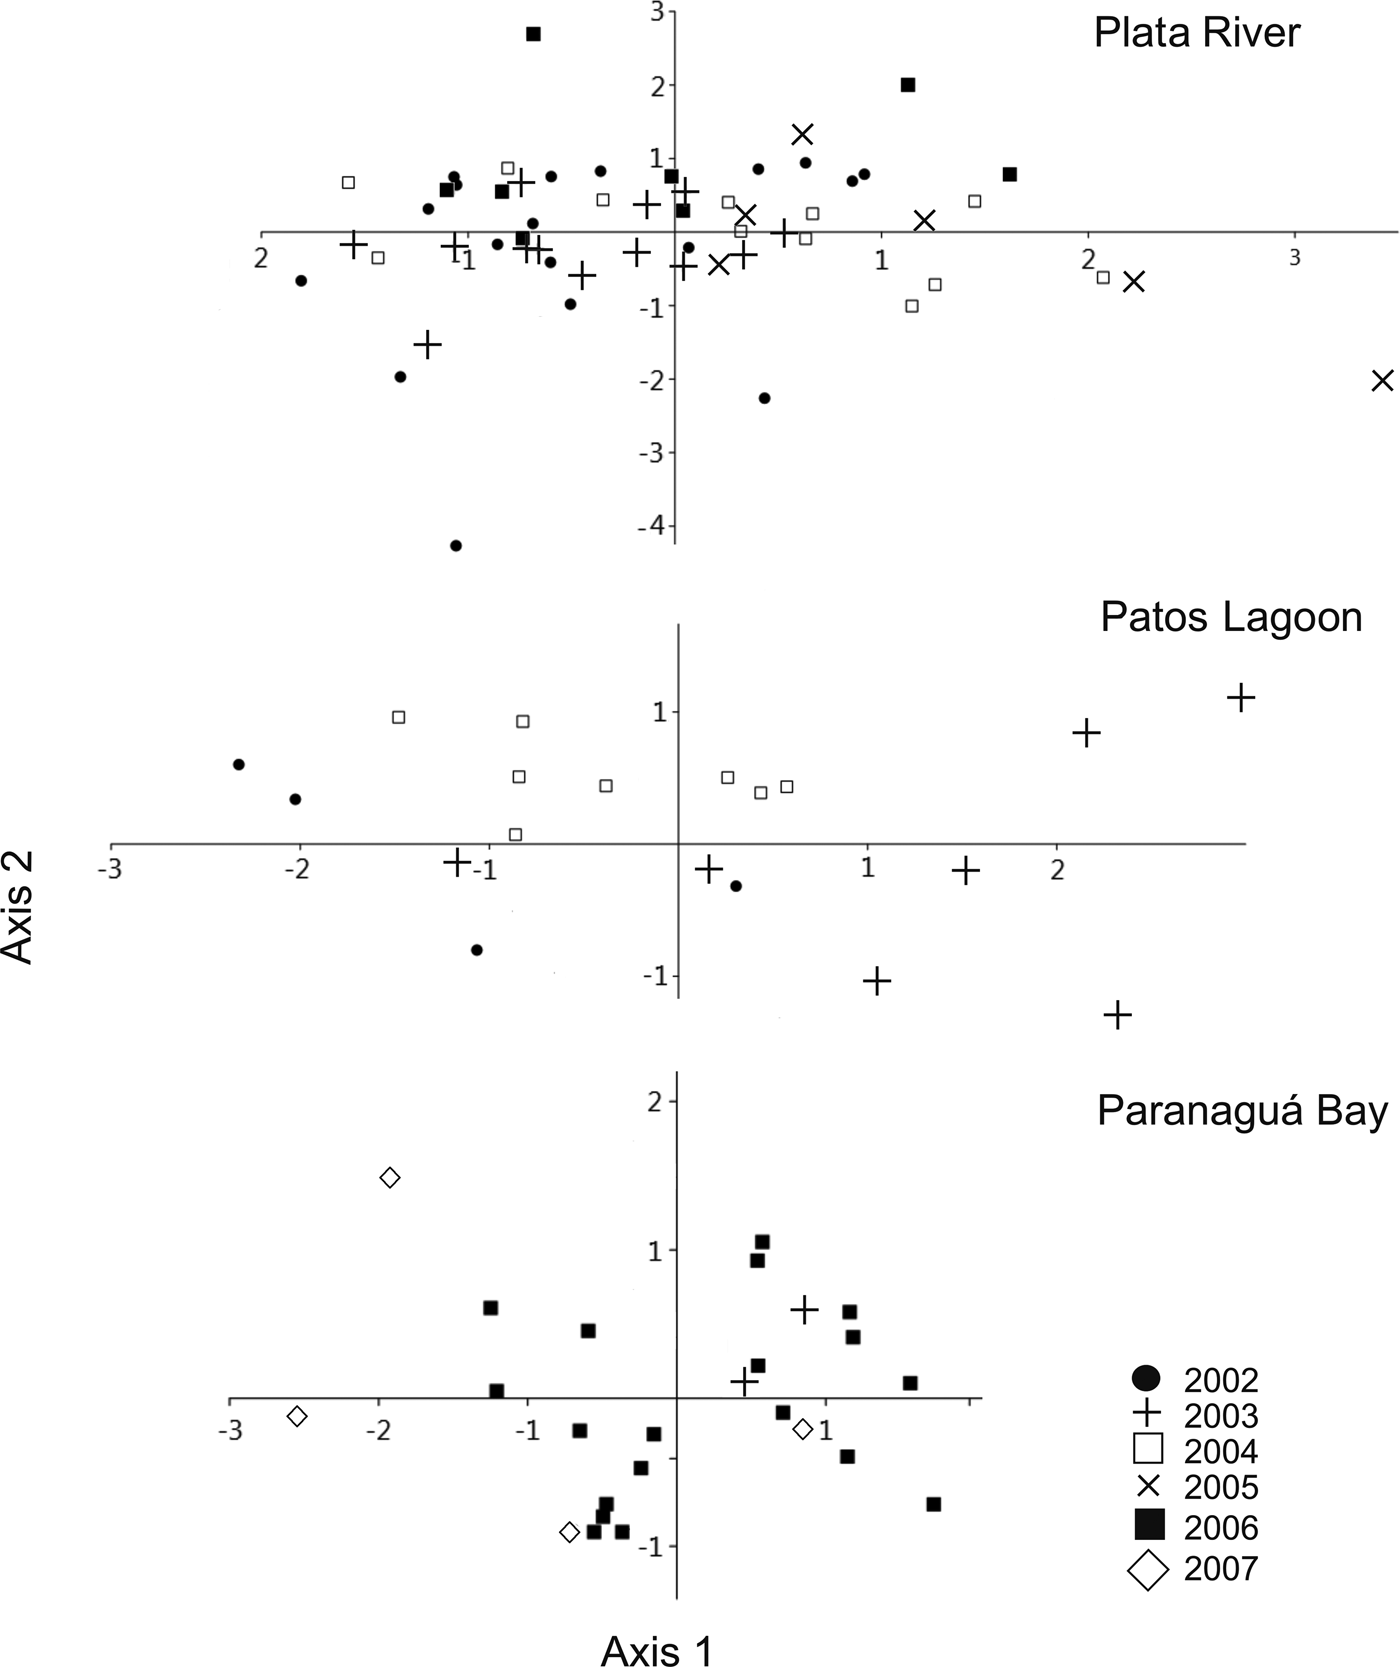
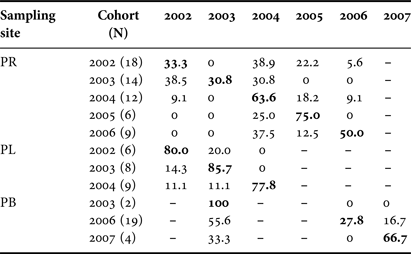
The relative importance of each signature in homogenizing multivariate signatures among year cohorts was shown by classification rates of QDAs (Table 3) and biplot (Figure 3). Classification rates were generally low for the PR and the PB, averaging 50 and 39%, respectively. In PR only a relative high percentage of individuals was properly classified to 2005 (75%) while for PB 2003 had 100% classification. For PL the assigned percentage of individuals was relatively high (81%) varying from 77.8 to 85.7% (Table 3). All the percentages of correctly classified individuals were significantly different from random (P < 0.05).
Discriminant analysis of the elemental ratios in core of otoliths from different sampling locations for year-classes.

Percentage of adult fish classified to each year-class by quadratic discriminant function analyses based on multi-elemental composition (Ba:Ca, Mg:Ca, Mn:Ca, Sr:Ca, Ba:Ca and Zn:Ca) of otolith core. PR, Plata River; PL, Patos Lagoon and PB, Paranaguá Bay. Bold numbers indicate the percentage of correctly classified individuals. N = number of specimens.

Cohort grouping and spatial variability
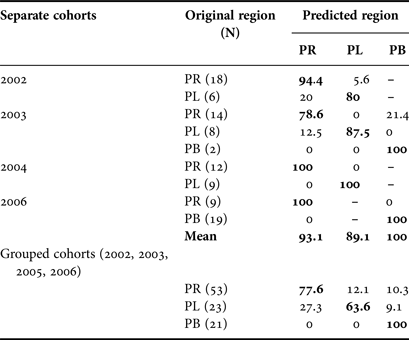
Results from PERMANOVA revealed significant differences in the multi-element signatures of the otolith core between sampling sites, taking into account the separated and grouped cohorts (0.0001 < P < 0.04). The percentage of individuals correctly classified was high when cohorts were analysed separately, averaging 93.1% for the PR, 89.1% for the PL and 100% for the PB (Table 4). However, the percentages of classification decreased between 15.5 and 25% for PR and PL when grouping cohorts, averaging 77.6 and 63.6% respectively (Table 4). Percentages of classification were significantly different from random (P < 0.05). The percentage of classification remained unchanged for PB when analyses were performed by grouping cohorts (Table 4).
Percentage of adult fish classified to each region (separate and grouped cohorts) by quadratic discriminant function analyses based on multi-elemental composition (Ba:Ca, Mg:Ca, Mn:Ca, Sr:Ca, Ba:Ca and Zn:Ca) of otolith core. PR, Plata River; PL, Patos Lagoon and PB, Paranaguá Bay. Bold numbers indicate the percentage of correctly classified individuals. N = number of specimens.

DISCUSSION
This work makes it clear that the temporal variation in the chemical signature of the adult catfish otolith core can greatly affect the percentages of spatial classification. Therefore, the group of cohorts used to study nursery areas could lead to a misinterpretation of results.
It is important to underline that this study was performed using cores of adult individuals and not juveniles. It is necessary to take this point into account because this method may lead to wrong conclusions, confusing temporal variation with variations caused by connectivity between estuaries. However, we have assumed that connectivity among estuaries is extremely low, based on reports of Avigliano et al. (Reference Avigliano, Carvalho, Velasco, Tripodi, Vianna and Volpedo2016) and the high levels of spatial classification obtained in this study (Table 4). Supporting this assumption, transects of Sr:Ca and Ba:Ca obtained by LA-ICPMS of the same otoliths used in this study show that migrations occur mainly among freshwater and estuarine environments with the marine incursions being relatively rare and brief (Avigliano Reference Avigliano, Carvalho, Velasco, Tripodi, Vianna and Volpedo2016, unpublished data). Previously, Avigliano et al. (Reference Avigliano, Velasco and Volpedo2015b) have studied the habitat use of a few specimens caught in PR and PL and have found Sr:Ca ratios × 10−3 less than 6.5. For other diadromous species in the study area (Centropomus parallelus) a Sr:Ca ratio × 10−3 of 8–11 has been considered as reference value for seawater (Daros et al., Reference Daros, Spach and Correia2016). This suggests that the values lower than 6.5 reported by Avigliano et al. (Reference Avigliano, Velasco and Volpedo2015b) for catfish correspond to the use of estuarine and freshwater environments, with marine incursions being rare. In short, the classification percentages obtained in this work would not be modified when using juvenile specimens instead of adult ones.
On the other hand, it is very difficult to collect a representative sample size of juveniles to make this type of study. First, because of mouthbrooding by males which lasts about 3 months, during which they do not feed and are not captured by fishing gear with hook (Araújo, Reference Araújo1988). Even today, it is difficult to collect adult specimens, due to local unrest among fishermen and academic and political fields, generated by the prohibition of use of the resource (Di Dario et al., Reference Di Dario, Alves, Boos, Frédou, Lessa, Mincarone, Pinheiro, Polaz, Reis, Rocha, Santana, Santos, Santos, Vianna and Vieira2015).
Retrospective determination of natal source depends on the premise that chemical signatures are sufficiently stable across time to allow for accurate classification (Rooker et al., Reference Rooker, Secor, Zdanowicz, De Metrio and Relini2003). To date, several studies have examined the issue of temporal stability of otolith chemistry and results indicate that chemical signatures vary among year cohorts (Patterson et al., Reference Patterson, Thorrold and Shenker1999, Reference Patterson, Cowan, Wilson and Chen2008; Campana et al., Reference Campana, Chouinard, Hanson, Fréchet and Brattey2000; Gillanders, Reference Gillanders2002, Reference Gillanders2005; Hamer et al., Reference Hamer, Jenkins and Gillanders2003; Walther & Thorrold, Reference Walther and Thorrold2009; Carson et al., Reference Carson, López-Duarte, Cook, Fodrie, Becker, Dibacco and Levin2013; Walther et al., Reference Walther, Thorrold and Olney2014). Long-term stability of otolith chemical signatures is not evident in any study to date, suggesting that chemical signatures may serve only as short-term natural tags (1–3 years) (Rooker et al., Reference Rooker, Secor, Zdanowicz, De Metrio and Relini2003, Reference Rooker, Secor, DeMetrio, Kaufman, Ríos and Tičina2008; Schaffler et al., Reference Schaffler, Miller and Jones2014). As in the present work, Schaffler et al. (Reference Schaffler, Miller and Jones2014) compared the efficiency of the classification of juvenile from Atlantic Menhaden Brevoortia tyrannus by grouping cohorts. However, these authors found that errors increased only 7–10% by grouping different cohorts, concluding that on short time scales (a few years), a discriminant function built from several year-classes may be able to accurately predict group membership. Rooker et al. (Reference Rooker, Secor, Zdanowicz, De Metrio and Relini2003) have found that the spatial variation between nursery areas of bluefin tuna (Thunnus thynnus) is so strong that the classification of individuals in their respective areas of origin is not affected by the existing temporal variation. This allowed performing further studies gathering year-class without compromising the interpretation of results (Rooker et al., Reference Rooker, Secor, DeMetrio, Kaufman, Ríos and Tičina2008). Campana et al. (Reference Campana, Chouinard, Hanson, Fréchet and Brattey2000) found that the otolith chemistry of Atlantic cod Gadus morhua was stable between years but not over longer time frames (4–13 years). Similarly, Schaffler & Winkelman (Reference Schaffler and Winkelman2008) found that a discriminant function based on 3 years of data for striped bass Morone saxatilis was able to predict group memberships with only 4–6% increased error for two cohorts, but for a third year-class the overall error rate increased to 51%.
In the present study, otolith chemical signature of G. barbus differed between year-classes in the PR and PL. However, only age class 2005 in PR and 2003 in the PL were significantly different from the rest, which explains the relatively high percentage of well classified individuals for those years (75 and 85%, respectively) in the analyses of inter-annual variation. On the other hand, univariate contrasts for all five elements were statistically similar in all sampling sites, except in the Ba:Ca and Mg:Ca ratios for the PR and Mn:Ca ratio for the PL. These differences in inter-annual variation were enough to adversely affect the space qualifying percentage for PR and PL (overall errors increased 15.5–25%, respectively) when year-classes were grouped, indicating spatial differences were not sufficient to counter temporal variability. Furthermore, we recognize the limitations to the use of such a small number of fish from PB (2003 and 2007) which could affect the power of statistical tests.
Other authors have reported a higher univariate variation between different cohorts than that observed in this study. However, the percentages of classification obtained from the discriminant functions are dissimilar between studies and depend on the environment and biological characteristics of the species. For example, Walther & Thorrold (Reference Walther and Thorrold2009) obtained percentages of inter-annual classification between 8–38% in Alosa sapidissima, while Rooker et al. (Reference Rooker, Secor, Zdanowicz, De Metrio and Relini2003) obtained percentages between 71–80% for Thunnus thynnus when in both works they found univariate temporary differences in several elements. The percentages of inter-annual classification found for G. barbus were intermediate in relation to those reported in previous works.
It is clear that with the obtained data it is not possible to relate directly the inter-annual variability in the otolith fingerprint with the environmental or physicochemical variations. However, water chemistry and several environmental factors (temperature, salinity, diet, genetics) may generate variability in otolith chemistry (Campana, Reference Campana1999; Brown & Severin, Reference Brown and Severin2009; Tabouret et al., Reference Tabouret, Bareille, Claverie, Pécheyran, Prouzet and Donard2010; Sturrock et al., Reference Sturrock, Trueman, Darnaude and Hunter2012; Avigliano & Volpedo, Reference Avigliano and Volpedo2013; Reis-Santos et al., Reference Reis-Santos, Tanner, Elsdon, Cabral and Gillanders2013; Bouchard et al., Reference Bouchard, Thorrold and Fortier2015). Depending on the species, the incorporation of Mn, Mg and Zn in the otolith can be influenced (or not) by environmental or physiological factors (Martin & Thorrold, Reference Martin and Thorrold2005; Ranaldi & Gagnon, Reference Ranaldi and Gagnon2008). Moreover, in diadromous fish the incorporation of elements such as Sr and Ba would be related mainly to salinity (Secor & Rooker, Reference Secor and Rooker2000; Kraus & Secor, Reference Kraus and Secor2004; Martin & Wuenschel, Reference Martin and Wuenschel2006; Brown & Severin, Reference Brown and Severin2009; Tabouret et al., Reference Tabouret, Bareille, Claverie, Pécheyran, Prouzet and Donard2010; Sturrock et al., Reference Sturrock, Trueman, Darnaude and Hunter2012). Walther & Thorrold (Reference Walther and Thorrold2009) have found inter-annual differences in the chemical form of other fish in several rivers in the North-west Atlantic, and these differences have been related to major river changes. Patterson et al. (Reference Patterson, Cowan, Wilson and Chen2008) also has explained the inter-annual differences in otolith chemistry of red snapper Lutjanus campechanus with variations in environmental or hydrodynamic conditions of the study area.
Nevertheless, differences in spatial otolith chemistry were expected because hydrography (temperature, water fluxes, salinity, bathymetry and ecoregion) differ between the estuary studies. The temporal variation observed in 2005 for the PR and in 2003 for the PL would also be related, at least in part, to environmental variations. Particularly in the transition from 2002 to 2003 the PL experienced extreme hydrological changes due to the higher rainfall peak recorded in the period 1986–2008 (more than 2000 mm per year) and the increase in the volume of river discharge into the estuary in the period 1964–2004 (Marques & Möller, Reference Marques and Möller2008; Möller et al., Reference Möller, Castello and Vaz2009; Abreu et al., Reference Abreu, Bergesch, Proença, Garcia and Odebrecht2010). In 2003 the highest peak of chlorophyll in the last 30 years also was registered (18 µg l−1) (Abreu et al., Reference Abreu, Bergesch, Proença, Garcia and Odebrecht2010). These changes were associated with the greatest decrease of salinity (<2 UPS) and increase in water temperature (up to 30°C) in the period 1986–2008 (Abreu et al., Reference Abreu, Bergesch, Proença, Garcia and Odebrecht2010) which severely affected some fisheries, such as the pink shrimp (Möller et al., Reference Möller, Castello and Vaz2009). On this site, a non-significant trend to the increase of the Ba:Ca ratio for 2003 was observed, consistent with the low salinity and the increase of flux/rainfall recorded for that year.
On the other hand, in 2005 a cell of cool water was observed in the PR coast with temperatures 2–4°C cooler than the surrounding waters (Simionato et al., Reference Simionato, Luz, Tejedor, Campetella, Guerrero and Moreira2010). Again, variations of this kind could affect the incorporation of elements such as Ba and Mg in the PR, although we cannot relate it directly.
The absence of univariate significant differences in the element:Ca ratios found in PB (2003, 2006 and 2007) suggests a relative stability in the factors that have influence on the incorporation of the different elements in the otolith. In this sense, the grouping of cohorts for the resource study might be plausible only in this site, at least in the cohorts studied.
In conclusion, this paper attempts to address the issue of temporal (inter-annual) variability in site-specific otolith chemistry signatures. Significant temporal variation was found for some sites in the Ba:Ca, Mg:Ca and Mn:Ca ratios as well as multivariate differences (PR and PL).
The variations were sufficient to significantly reduce the power of discrimination between the three nursery areas. This shows evidence of the importance of testing the spatial variability before grouping cohorts deliberately to study the resource by using the core of the otoliths.
This is a worthy goal, and one that deserves more attention in the otolith chemistry literature, particularly because temporal variability may interfere with the ability to classify natal origins of adult fishes if the wrong baseline signature is used to parameterize the classifying function. For this reason, although it is difficult to obtain large sample sizes of G. barbus, it is not recommended to use a cohort group for monitoring and management of this species, unless trace elements and year-classes do not show temporal variation.
ACKNOWLEDGEMENTS
We thank Marta Bavio and Estefania Videla for excellent technical assistance. We also thank the anonymous reviewers for helpful comments on the manuscript.
FINANCIAL SUPPORT
The authors are indebted to CONICET (PIP 112-20120100543CO), ANPCyT (PIP 2010-1372), Universidad de Buenos Aires (UBACYT 20620110100007), Universidad Nacional de San Martín, Instituto de Oceanografía from Universidade Federal do Rio Grande (FURG) and Centros Asociados para el Fortalecimiento de Posgrados Program (CAFP BA 43/13 Brazil/Argentina) for financial support.