


Introduction
The volume change or mass balance of the large ice caps and ice sheets is a key parameter in estimates of ongoing and future global sea-level changes. The total mass balance is expressed by the equation

In this equation, Vis ice volume, a is 1 year, Ma is the annual surface accumulation, Mm is the annual loss by glacial surface runoff, Mc is the annual loss by calving of icebergs, and M b is the annual balance at the bottom (melting or freeze-on of ice) (Reference Hagen, Reeh, Bamber and PayneHagen and Reeh, 2004).
The equation above suggests that the total mass balance can be determined by two entirely different methods: (i) direct measurement of the change in volume by monitoring surface elevation change, and (ii) the budget method, by which each term on the righthand side of the mass-balance equation is determined separately. The budget method is only possible on glaciers of limited size and area, which are often selected for logistical accessibility rather than scientific interest. The direct volume change method is useful on larger glaciers and ice caps. Measurements of geometry changes (elevation changes) give the input data to this method.
The geometry of a glacier can be simply described by a longitudinal elevation profile along the central flowline of the glacier. On an ice cap with a fairly simple dome shape, profiles across the ice cap can describe the geometry. The profile changes can then be used to calculate the volume change (method (i)) assuming that the profile change is representative for each altitude interval. The geometry of the glaciers may change over time because (1) the surface mass balance is changing (either a long-term increase or decrease in accumulation or ablation, or, for short periods, a short-term trend in response to random variations in accumulation or ablation), (2) the glacier is not in dynamic balance with the current mass balance, or (3) there is a change in the ice discharge of the glacier (i.e. surge).
In a steady-state glacier the net mass balance upstream from a cross-section (the balance flux Q b) of the glacier should be equal to the volume transport (ice flux Q v) through that cross-section. Thus it retains a constant shape (geometry) over time, whereby the downward/upward motion of ice is balanced by the equal amount of snow accumulation/ ablation at the surface. When the climate changes (mass-balance change) or the dynamics change, these two fluxes (Q v and Q b) are not equal, so the geometry of the glacier will gradually change. Increased winter precipitation will result in an upbuilding with thickening in the accumulation area before the dynamics are able to adjust to the new mass balance. The dynamic response is very slow, and varies from a few years on a small valley glacier to hundreds or even thousands of years on outlets from the large ice sheets (Reference Jóhannesson, Raymond and WaddingtonJóhannesson and others, 1989). However, a change in the dynamics caused by other processes can also change the geometry, as occurs in surge-type glaciers.
Recently, ground-based global positioning system (GPS) measurements, airborne measurements and satellite-borne laser and radar altimeters have been used for mapping geometry changes on glaciers, ice caps and ice sheets. Geometry changes given as longitudinal elevation profiles have been used in mass-balance estimates over the Greenland ice sheet (Reference KrabillKrabill and others, 2000; Reference Paterson and ReehPaterson and Reeh, 2001) and on smaller glacier systems such as in Alaska (Reference Arendt, Echelmeyer, Harrison, Lingle and ValentineArendt and others, 2002).
In Svalbard, most direct mass-balance measurements are done on small glaciers (area < 10 km2). These glaciers represent < 0.2% of the glacierized area in Svalbard, and are not necessarily representative of the overall ice masses. Reference Hagen, Melvold, Pinglot and DowdeswellHagen and others (2003b) used net balance gradients in 11 regions to estimate the overall mass balance of Svalbard ice masses.
In this paper, we describe geometry change measurements on three glaciers in Svalbard that are in different dynamic mode, and discuss the importance of having information about the dynamics when interpreting geometry changes of glaciers.
Study Areas and Methods
We have conducted repeated ground-based GPS measurements on three glaciers. Nordenskiöldbreen drains out from Lomonosovfonna in central Spitsbergen (Fig. 1). The glacier is about 242 km2, 26 km long and extends from sea level up to ∼1200ma.s.l. (Reference Hagen, Liestøl, Roland and JørgensenHagen and others, 1993). The measured profile is ∼ 2 0 km long from 500ma.s.l. (∼6 km from the front) up to the highest part of the accumulation area. The profile was measured in April 1991 and April 1997.
(a) The Svalbard archipelago. K: Kongsvegen; N: Nordenskiöldbreen; A: Amundsenisen. (b–d) Glaciers with repeated GPS profiles presented in this paper: Kongsvegen (b), Nordenskiöldbreen (c) and Amundsenisen (d). Locations of GPS profiles are shown on the maps. Markers on profiles are stake positions.
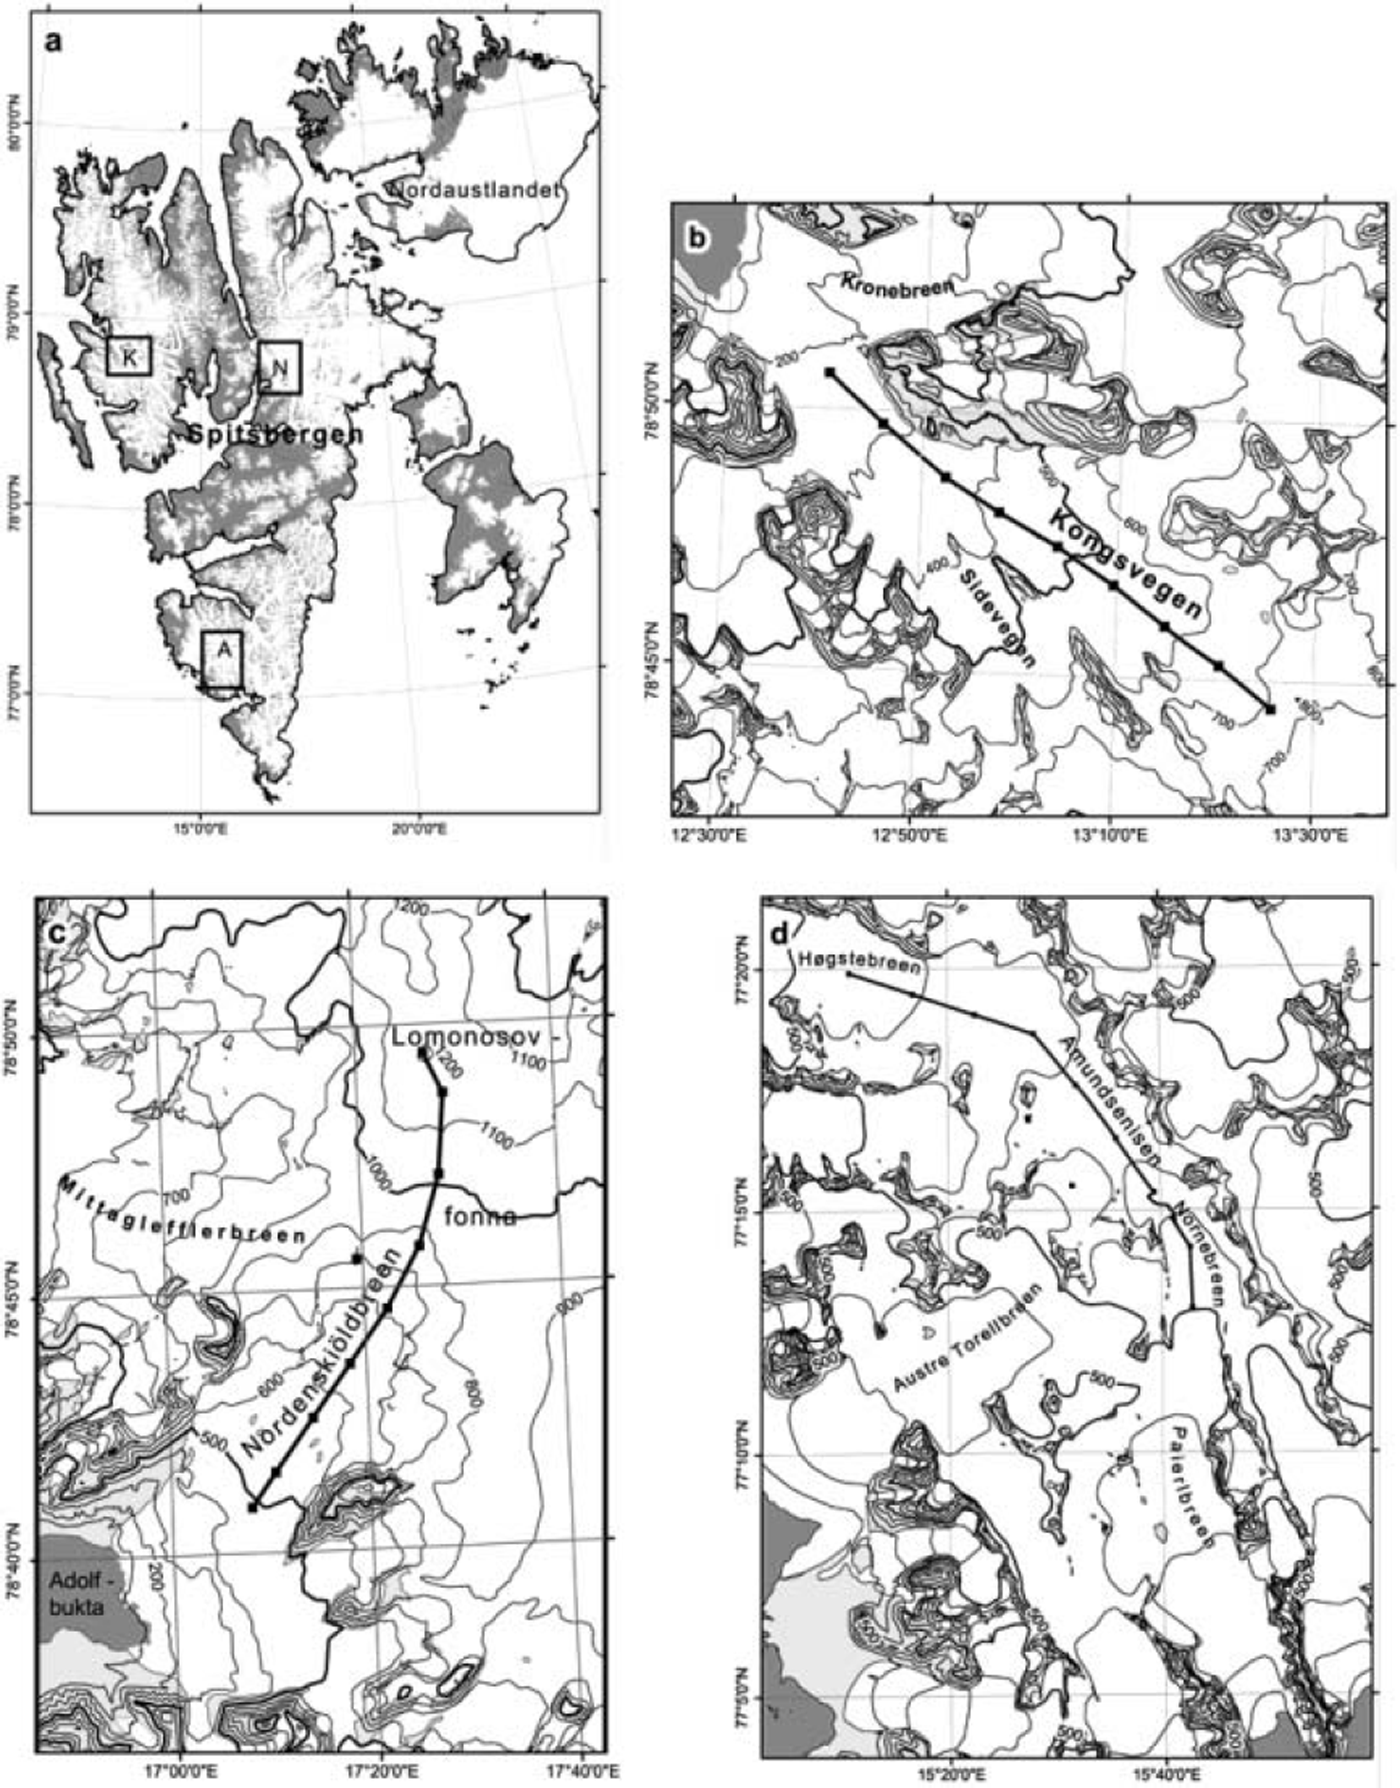
Amundsenisen is an elongated accumulation plateau in southern Spitsbergen, and is about 12 km long and 2-4 km wide (Fig. 1). The area of the plateau is about 40 km2. This relatively flat ice field lies mostly in the range 650-720 m a.s.l, but higher areas feeding the ice field can be found in the lateral parts along the nunataks. An ice thickness of 580 m has been measured in a Russian borehole (Reference KotlyakovKotlyakov, 1985). Amundsenisen feeds three large glacier systems: westwards to Høgstebreen and further down vestre Torellbreen (338 km2); southwestwards to austre Torellbreen (150km2) ; and southwards through Nornebreen and to Paierlbreen (112 km2) (Reference Hagen, Liestøl, Roland and JørgensenHagen and others, 1993). The 20km long profile shown in Figure 1d was measured in April 1991 and remeasured after a 10year interval in April 2001.
Kongsvegen (Fig. 1) is situated in the inner part of Kongsfjorden in northwest Spitsbergen and is 101 km2. The glacier is 26 km long from sea level up to 750 m a.s.l. (Reference Hagen, Liestøl, Roland and JørgensenHagen and others, 1993). The measured profile starts at ∼170ma.s.l. in the ablation area and ends in the upper part of the accumulation area at 720 m a.s.l. The profile was first measured in 1992 and remeasured in 1996, 2000, 2001 and 2004. The results from the first period 1992-96 have been published by Reference Melvold and HagenMelvold and Hagen (1998). On Kongsvegen, direct mass-balance measurements have been conducted every year since 1986, and both annual winter accumulation and summer ablation have been measured (Hagen and others, Reference Hagen, Kohler, Melvold and Winther2003a).
The main data presented in this paper are the ground-based GPS measurements. Differential GPS (DGPS) measurements have been proven to give reliable data of high accuracy both for longitudinal surface altitude profiles with kinematic measurements and when used as static measurements of stake positions for velocity measurements (e.g. Reference Eiken, Hagen and MelvoldEiken and others, 1997). The measurements require a minimum of two GPS receivers where one base station is placed on a reference point preferably near the glacier a few kilometres from the points to be measured. The measurements are then taken by the moving GPS receiver, the rover, and simultaneously collecting data from both receivers (Reference Eiken, Hagen and MelvoldEiken and others, 1997). For the static measurements for velocity data, the GPS antenna is placed on top of the stakes for about 30min. When measuring the elevation profile with kinematic DGPS, the rover antenna is towed by a snowmobile.
In 1991 the DGPS system was still not in full operational phase, but there were sometimes enough satellites available to perform measurements. The 1991/92 GPS observations were collected with Ashtech L-XII dual-frequency (L1 and L2) receivers, but the L2 frequency capability was quite limited in these early receivers, as a squaring method was used for phase extraction. These data are therefore treated as L1 only data in the processing. Since 1996, receivers with full dual-frequency phase measurements have been used, giving considerably better performance in kinematic mode. In 1996/97, Ashtech Z-XII receivers were used, while Topcon (Javad) dual-frequency GPS/Glonass receivers were used in 2001 and 2004.
The observation procedure was changed between 1991/ 92 and the later measurements. In 1991/92 the kinematic profiles were measured as sections between stakes, and the positions of the stakes were fixed in a simultaneous static survey. Most profiles were taken forward and backward, and some profiles were taken three times to reduce errors. During the kinematic surveys, reference receivers logged data, one at the base station and another at the lower end of the stake profile. The remeasurements in 1996-2004 have been measured as continuous kinematic profiles with only one fixed reference at the base station.
The reference point at Kongsvegen is a trigonometric point, while the positions of the two other reference points have been fixed with an absolute position with the program service AutoGipsy (http://milhouse.jpl.nasa.gov/ag/), giving a position estimate at the cm level. The reference frame of the calculated positions is International Terrestrial Reference Frame 2000 (ITRF00), which is not exactly like the World Geodetic System 1984 (WGS84) or European Reference Frame 1989 (EUREF89) datum, but the difference is negligible, as the calculated positions have been held fixed in the differential processing of the profiles.
The kinematic data have been processed using Ashtech PNAV, a Kalman filter-based epoch-by-epoch computation program (Reference Qin, Gourevitch and KuhlQin and others, 1992). Integer ambiguity corrections have been attempted on the L1 frequency in the 1991/ 92 data, and on L1/L2 of the later data. Due to the full dual frequency of the 1996 and later data, the expected precision of the kinematic results is far better than that of 1991.
The GPS data have been collected at fixed time intervals: every 10 s in 1991, every 3 s in 1996, every 5 s in 1997 and every 1 s in 2001 and 2004. The 1991 data represent a point every 50-90m, while the point spacing in 1996 is approximately 10-15 m, in 1997 is 30-50 m, and in 2001 and 2004 is about 3-6 m, ranges depending on the driving speed which varied along the profile between 15 and 30 kmh–1 . To obtain the best possible comparison between the two measurements, various methods can be used, but here it was decided to do an interpolation of each section between stakes to a fixed interval of 50 m between points. Linear interpolations were made between the nearest measured points backward and forward in the profile. Since most of the profiles have been measured at least twice each year, the altitude difference between the interpolated points can also be used as a measure of accuracy of the profile. The driven tracks were not exactly the same for each pass, so some differences can be expected from a cross-track error. However, this error seems to be quite small, as the cross-track gradient is <0.1˚ except for parts of Nordenskioldbreen. The 1991/92 data are in all cases close to the direct track between stakes, and a maximum cross-track distance of 30 m probably introduces errors less than the precision of the measurements (0.05 m). During the remeasurements, cross-track (lateral) divergence was up to 90 m, which can introduce vertical errors of up to 0.15 m.
The accuracy of profiles measured two ways (or more), calculated as the standard deviation of a point, is 0.15-0.3 m in 1991/92. The accuracy of the 1996 and later profiles is better, with a standard deviation of interpolated points as low as 0.02 m for some profiles, increasing to ∼0.3 m where the forward and backward tracks were up to 90 m apart.
Results and Discussions
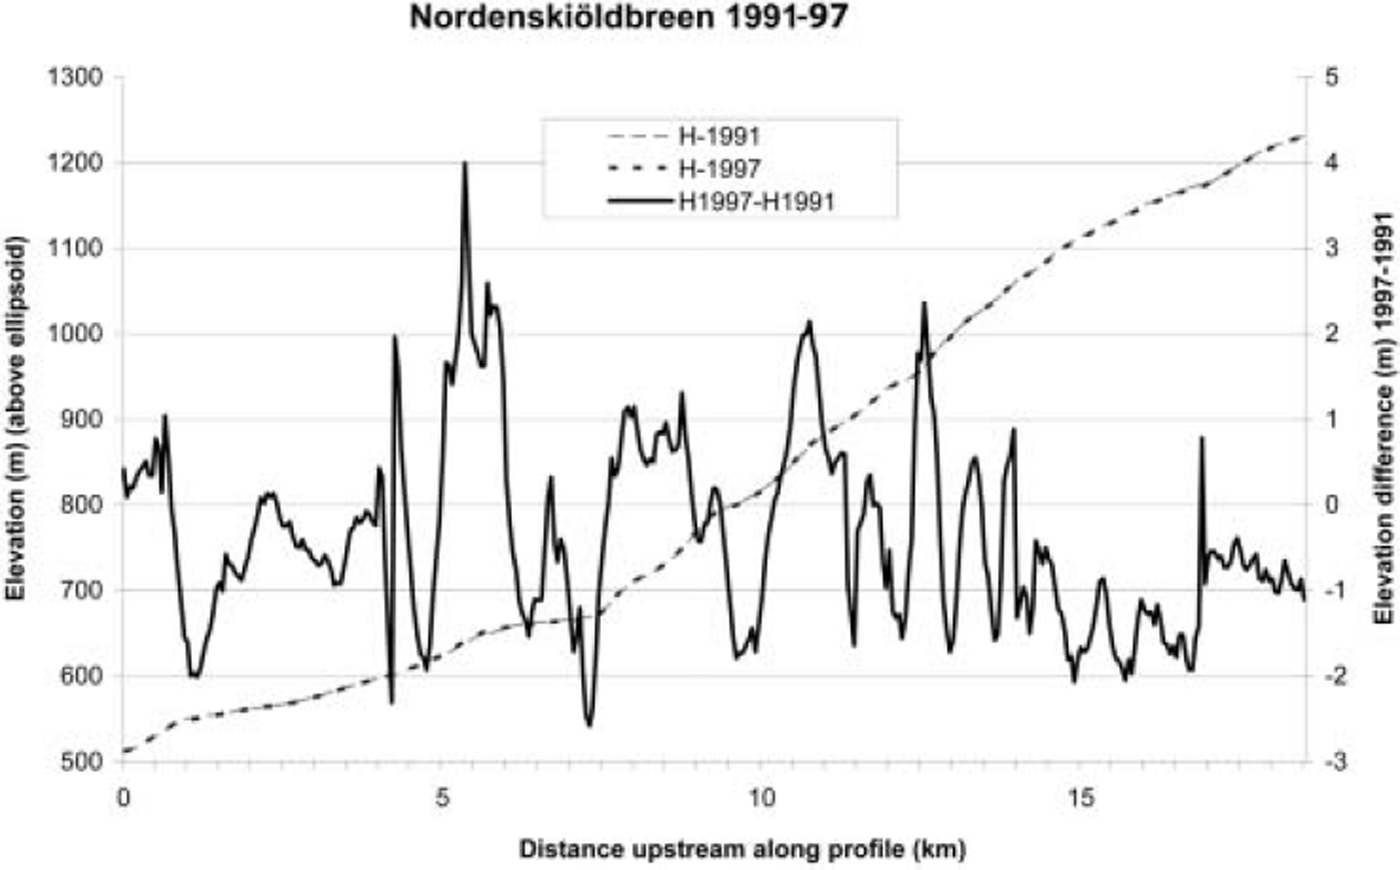
The repeated profile measurements on Nordenskioldbreen/ Lomonosovfonna show no significant elevation change over the 6year period April 1991–April 1997 (Fig. 2), indicating a balance between ice flux and balance flux. There are variations of ± 2 m along the profile ( ± 0.3 m a-1), but there is no trend of average thinning/thickening along the profile. Some of the observed variations could have been caused by the problems in reconstructing exactly the same profile in 1997 as in 1991. The lateral deviation in location of the two profiles could be as much as 50-100m, which partly explains some of the variation in altitude of the points since there is a lateral gradient of the surface (0.2-0.38), causing up to 0.5 m error in some parts of this profile. The average net surface mass balance above the equilibrium line has been estimated from shallow cores and ground-penetrating radar (GPR) data. The reference horizon from Chernobyl fallout has been found in shallow cores at three different altitudes (Reference PinglotPinglot and others, 1999; personal communication from J. Jania, 2003). From these core data, the equilibriumline altitude (ELA) was estimated to be 660ma.s.l. Longitudinal GPR profiles were sampled in the upper part of the accumulation area by Reference PälliPalli and others (2002). Their results confirmed the data from the shallow cores and gave information about the spatial variability of the accumulation. The mean net accumulation (1986-96) in the highest part at 1200 m a.s.l. was 0.75 m a-1 , decreasing downstream to 0.5 m a-1 at 1000 m a.s.l. and to zero at the ELA. From these input data, the balance flux could be estimated. Qb = Ab, where A is the area above the cross-section and b the mean net surface balance over A. The result was Qb =45 × 106m3a–1, with an error estimate of ± 1 0 % . The surface velocity of Nordenskioldbreen has been measured to about 65 m a-1 at the ELA (personal communication from J. Hedfors, 2004). The bed topography is not well known, but our GPR data indicate about 300 m depth in central parts close to the ELA. The glacier width is close to 5 km at the ELA. An estimated cross-profile area (S) together with the surface velocity measurements multiplied by 0.8 to obtain estimated mean cross-section velocity (u) give an ice flux, Q v = uS, in the order of 40 × 106 m3 a-1 . Even with an error estimate of 25% due to the uncertain cross-section area, this result confirms that the ice flux is in the same order as the balance flux, Q v ∼ Qb.
Nordenskiöldbreen elevation changes, April 1991–April 1997. The altitude profiles are shown together with the elevation change during the period. The 1991 and 1997 profiles almost exactly overlap, so they are hard to separate on this scale.
The Amundsenisen profiles were measured in April 1991 and remeasured after a 10year interval in April 2001 (Fig. 3). In the part of the ice field draining southwards, lowering of the surface was observed to increase downstream. The lower 3 km of the profile showed a surface lowering of 15-20m (1.5-2.0 m a-1). During surveying in 2001, more crevasses were observed 4-5 km upstream from the start of the profile than in 1991, and parts of the old profile could not be resurveyed due to large crevasses, hence the gap in the 2001 profile in Figure 3. No velocity measurements were conducted on Amundsenisen since all the stakes disappeared before they were remeasured, but the change in crevasse pattern indicates increasing flow rate over the period. Polish researchers observed a heavily crevassed surface and advance of the tidewater glacier front of Paierlbreen into the fjord about 20 km further downstream (Fig. 1) in 1994/95 (Reference Kolondra, Jania, Glowacki and BednarekKolondra and Jania, 1998; personal communication from J. Jania, 2000). The fjord is >100 m deep at the glacier front, and the advance was accompanied by the calving of numerous small icebergs when the heavily crevassed glacier advanced a few hundred meters. This surge advance has most likely affected the glacier upstream, causing a lowering of the glacier surface all the way to the top of Amundsenisen. The lowering of the surface decreases gradually upstream but extends northwestwards about 3 km into the part of the ice field draining northwestwards (Fig. 3). The last 7 km of the profile on the ice field draining northwestwards shows partly no change and partly a small thickening of up to 2 m, and has thus not been affected by the advance on Paierlbreen in the south.
Amundsenisen elevation changes, May 1991–April 2001. The profiles are shown together with the elevation change during the period. The data gap in the 2001 profile was caused by a heavily crevassed surface.
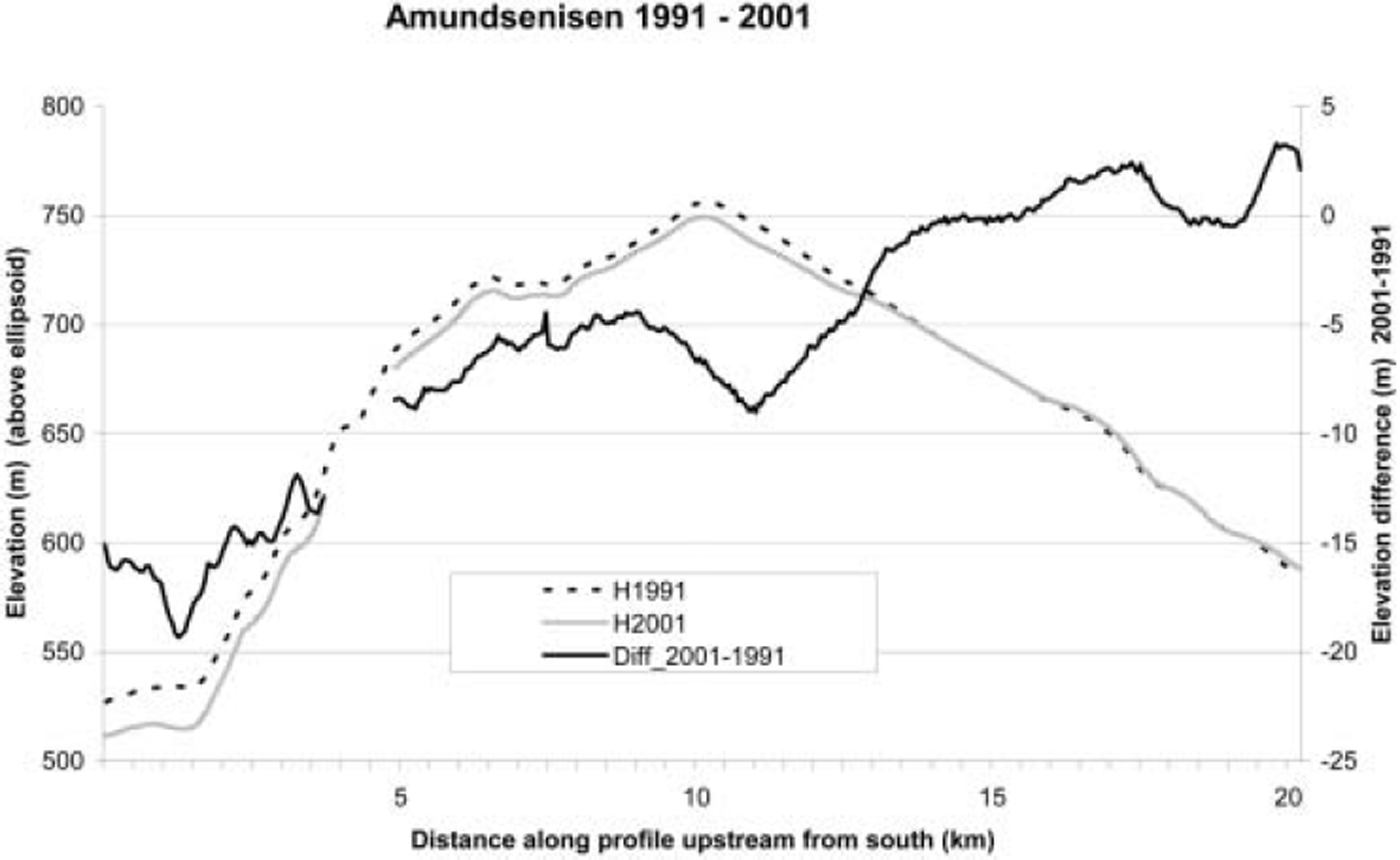
Mass-balance measurements carried out on Brøggerbreen, Lovénbreen and Kongsvegen, in the Kongsfjorden area, and on Hansbreen just southwest of Amundsenisen do not show significant change in melting or accumulation during the period 1991–2001 (Reference Hagen, Kohler, Melvold and WintherHagen and others, 2003a). Hansbreen has shown a negative balance over this 10year period (but not increasingly negative), indicating a possible lowering of the ablation area, but the actual measured profile on Amundsenisen is entirely in the accumulation area. Thus, the change in elevation cannot have been caused by climate-driven changes in accumulation or ablation. Our observations indicate that during the period there must have been a change in the dynamics in this part of Amundsenisen. The current volume flux (Q v) has been larger than the balance flux (Q b) on the southern part of Amundsenisen in the period 1991–2001, causing surface lowering.
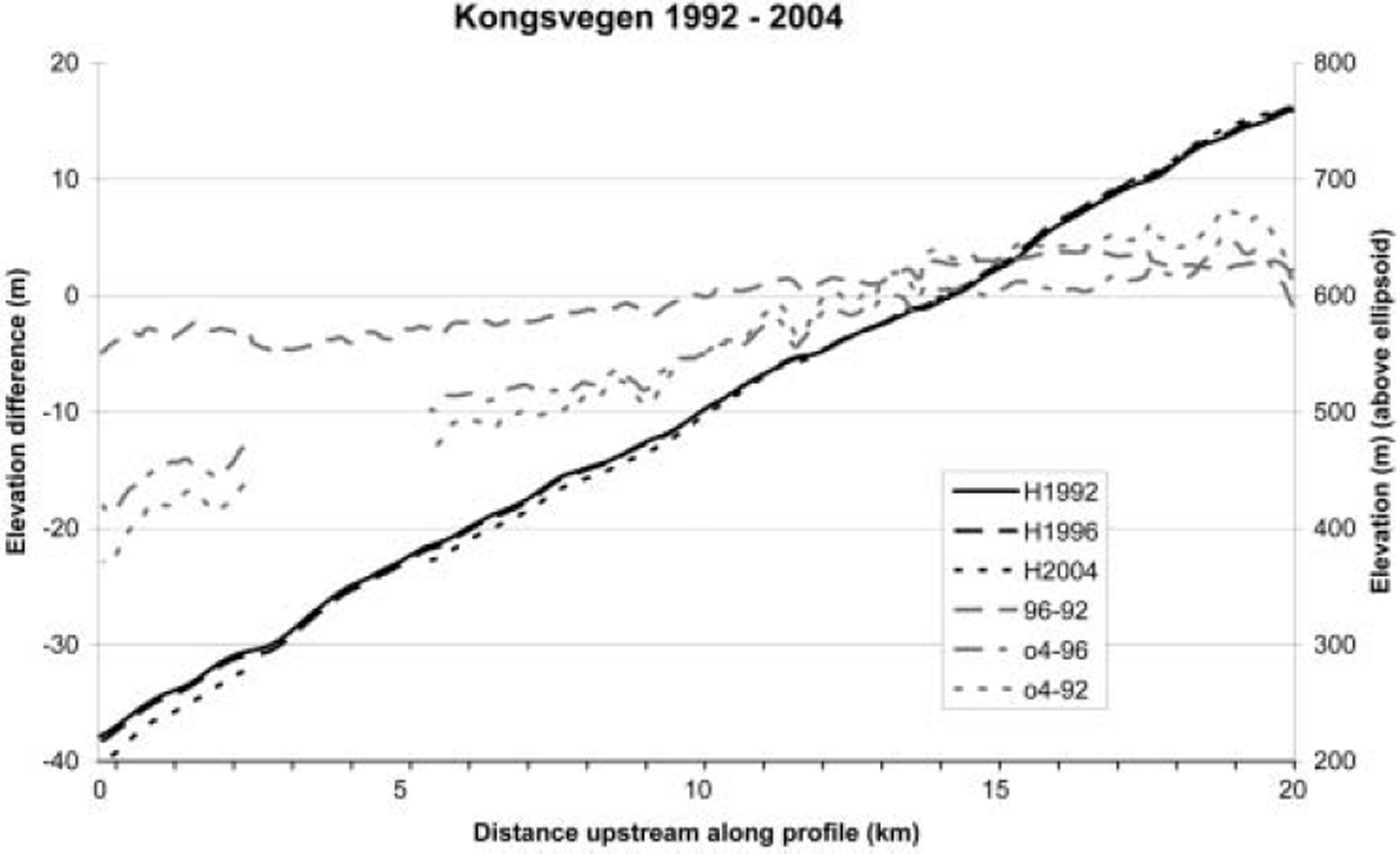
The profiles on Kongsvegen measured in 1992 were remeasured in 1996, 2000, 2001 and 2004. Here only data from 1992, 1996 and 2004 are presented (Fig. 4), to obtain as long a period as possible. Large profile changes were observed. The changes from 1992 to 1996 were published by Reference Melvold and HagenMelvold and Hagen (1998) who concluded that the glacier is building up towards a surge. They also compared profiles derived from maps from 1966 and stated that the surface geometry from 1966 to 1996 showed a retreat of the front and large thinning of up to 75 m (2.5m a–1) in the lower ablation area, and a build-up of up to 32 m (nearly 1 ma–1) in the upper accumulation area. They also presented velocity data showing that the annual velocities along the glacier are low, 1.4–3.6m a–1. The measured actual ice flux (Q v = uS) could be calculated, as the cross-section area S was measured by GPR and mean cross-section velocity u could be estimated from the surface velocity. The calculated mass transfer down-glacier (Q v) at the ELA, where surface velocity is about 3m a–1, is only 3–20% of the balance flux (Q b) (Reference Melvold and HagenMelvold and Hagen, 1998). The mass balance reconstructed back to 1967 (Melvold and Hagen, Reference Melvold and Hagen1998) and the measured mean net balance for the period 1987–2002 (Hagen and others, Reference Hagen, Kohler, Melvold and Winther2003a) were close to zero. The low horizontal velocity gives a very small submergence or emergence velocity, so the annual elevation change is more-or-less equal to the mean annual net balance. During the last 38 years (1966–2004), the mass balance has therefore been the driving force of the elevation changes as stated by Reference Melvold and HagenMelvold and Hagen (1998). The recent profile and velocity measurements from April 2004 confirm the former results. As shown in Figure 4, there is a steady surface lowering in the ablation area from 1992 to 2004, in the lowermost part by as much as 15–20 m (1.0–1.5 m a–1). In the accumulation area the thickening was about 2–3m (0.5–0.7 m a–1) in the period 1992–96. The period 1996–2004 showed smaller upbuilding (0.2–0.3m a–1). Since the geometry changes on Kongsvegen are driven by the net mass balance, this should indicate a less positive balance in the last part of the period 1992–2004. This is confirmed by the mass-balance measurements. On Kongsvegen, annual mass-balance measurements have been carried out since 1986, and in the period after 1996 some years (1998–2001) had lower than normal accumulation (mean winter accumulation of 0.51 m vs long-term mean of 0.74 mw.e.), and also two years had much higher summer melting than the average (1998 and 2001) (Reference Hagen, Kohler, Melvold and WintherHagen and others, 2003a). This does not change the general pattern: on Kongsvegen the volume flux Q v is much smaller than the balance flux Q b, the opposite situation to that found on Amundsenisen.
Kongsvegen. GPS profiles along the central flowline in 1992, 1996 and 2004, and elevation changes 1992–96, 1996–2004 and 1992– 2004. The altitude profiles are shown together with the elevation change during the periods.
This condition on Kongsvegen is typical for surge-type glaciers, and surging glaciers are widespread in Svalbard (Reference LiestølLiestøl 1969; Dowdeswell and others, Reference Dowdeswell, Hamilton and Hagen1991; Lefauconnier and Hagen Reference Lefauconnier and Hagen1991; Hagen and others, Reference Hagen, Liestøl, Roland and Jørgensen1993; Reference Jiskoot, Murray and BoyleJiskoot and others, 2000). In a surge-type glacier, the ice flux (Q v) during the quiescent period is smaller than the accumulation (balance flux Q b). The surge events occur independently of climatic variations, but the length of the quiescent (upbuilding) period is affected by the climate (Reference Dowdeswell, Hodgkins, Nuttall, Hagen and HamiltonDowdeswell and others, 1995). The longitudinal surface profile on a surge-type glacier will gradually change during a long quiescent upbuilding period by a thickening in upper parts and a thinning in lower parts even if the net mass balance is zero and in balance with the current climate, as observed on Kongsvegen. When a critical, but unknown, value of the slope is reached, a surge can be triggered and sliding increases rapidly. The surge advance results in a large ice flux from the higher to the lower part of the glaciers, accompanied by a surface lowering in the accumulation area and an advance of the glacier front. The glacier dynamics may change during the observation period, due to a triggering of a surge advance. Among the observed glaciers in this paper, only Kongsvegen has previously been observed to surge.
The change of surface elevation with time at a fixed position on the glacier gives the local net mass balance (and a minimum value of the specific net balance). It is determined by the kinematic boundary condition, relating the rate of change of surface elevation ∂h/∂t to the vertical ice-particle velocity w
s, the horizontal velocity vector
 , the surface gradient
 , and the specific mass balance b
s measured in m ice a–1. The altitude spot change is then given by:

The term
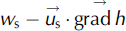 is the emergence or submergence velocity, depending on whether the net vector points down into the glacier or towards the glacier surface. It represents the vertical flow of ice relative to the glacier surface (e.g. Reference PatersonPaterson, 1994, p. 258). The net balance can therefore be estimated if one knows the emergence velocity and assumes that the density does not change with depth during the period. This assumption should at least be valid in the ablation area since ice density does not change over time. The true cumulative net balance will be more negative than estimated from the geometry changes alone in the ablation area, and more positive in the accumulation area due to the emergence/submergence velocity.
On some glaciers in Svalbard it has been shown that the emergence velocity is so small compared to the net surface mass balance that it can be neglected (Reference Melvold and HagenMelvold and Hagen, 1998), and thus the geometry changes give directly the specific mass balance in each spot as:

This is typical for surge-type glaciers like Kongsvegen.
Summary
We have shown by repeated GPS measurement of longitudinal altitude profiles on three glaciers in Svalbard that surface altitude changes alone cannot be used to assess the mass balance. The three measured glaciers are in different dynamic mode, and the observed changes in geometry are strongly affected by the dynamics. Nordenskiöldbreen shows no significant change in geometry, indicating that the mass balance is in steady state with the dynamics, i.e. the ice flux is equal to the balance flux (Q v =Q b). This is confirmed by balance-flux and ice-flux estimations. The velocity at the ELA is about 65 ma–1 (personal communication from J. Hedfors, 2004) . On Amundsenisen the surface shows an increasing lowering from the upper accumulation area downstream towards the south, and has been lowered by as much as 1.5– 2.0m a–1 in the lower part of the accumulation area (520– 550 ma.s.l.), indicating that the ice flux is higher than the balance flux (Q v > Q b). This is probably due to a small surge advance of the tidewater glacier Paierlbreen further downstream affecting the higher part of the drainage area. On Kongsvegen the opposite situation was found. Here the geometry of the profile showed a clear thickening in the accumulation area and a surface lowering in the ablation area. It has been shown that the ice velocity is very low, the velocity at the ELA is only about 3 m a-1 , and the ice flux is far smaller (3-20%) than the mass-balance flux (Q v ≪c Qb), indicating a build-up towards a surge advance as described by Reference Melvold and HagenMelvold and Hagen (1998).
The intervals between the surveys of geometry changes should be > 5 years, preferably 10years or more. Otherwise, extreme years of very high winter snow accumulation or very high summer melting can give short-term geometry changes that can be misinterpreted as a change in the general precipitation or melting pattern.
The large differences in the geometry changes and the different dynamics of these three glaciers/ice fields in Svalbard show how important it is to obtain knowledge of the dynamics to be able to interpret the profile changes. When remote-sensing techniques are used to obtain geometry change data, it is necessary to obtain information about the dynamics, especially in regions where the glacier dynamics may change and the ice flux is not necessarily in balance with the mass balance. The longitudinal surface profile on a surge-type glacier will gradually change during a long quiescent phase, with increasing altitude in upper parts and decreasing altitude in lower parts even if the net surface mass balance is zero and in balance with the current climate. Many glaciers are not in dynamic balance with the current mass balance, even after long periods of stable climate. This can be because they are surge-type glaciers (e.g. many glaciers in Svalbard) or because they may have very long response times (e.g. outlet glaciers from the Greenland ice sheet (Reference KrabillKrabill and others, 2000)). So, geometry changes alone cannot be used to assess the surface mass balance without knowledge of the dynamics.
Acknowledgements
This work was initiated in 1991 through a trilateral agreement between Russia, Poland and Norway about joint glaciological work in Svalbard. We thank the Department of Geography, Russian Academy of Sciences, for arranging free accommodation and logistic support in the Russian settlement Pyramiden during the first fieldwork on Nordenskiöldbreen in 1991. We thank the Institute of Geophysics, Polish Academy of Sciences, for letting us stay for free at the Polish Polar Station in Hornsund during fieldwork on Amundsenisen both in 1991 and in 2001. The friendly reception and help from the staff was highly appreciated. Special thanks go to P. Glowacki, J. Jania and. A. Glazovskiy for help and support. Support has been given from the Norwegian Polar Institute and from the European Union project ICEMASS, through contract ENV4-CT97-0490.



