


1. Introduction
Ice flow at the edge of the Antarctic ice sheet can be divided into two distinct forms. Where the bedrock is higher than a few tens of metres below sealevel, ice flow velocities range from near zero to ~50 m a−1 and, as a consequence of low stresses, the ice surface is relatively smooth and uncrevassed. In contrast, between these areas of “sheet flow” there are outlet glaciers in deep bedrock depressions where surface velocities may exceed 1 000 m a −1. It will be shown that these outlet glaciers dominate the outflux from the continent by accounting for some 90% of the outflow in the study area.
This paper presents results from a survey of East Antarctic outlet glaciers between longitudes 48°E and 62°E (Fig.l). The data were collected by an airsupported field programme during the 1979–80 austral summer. Two glacier ice-movement stations remeasured during this season were established during the 1977–78 austral summer. Further measurements of ice surface and bedrock elevations from Allison and others (to be publishedFootnote *) and of ice movement from Reference MellorMellor (1967) and Reference MorganMorgan (1973) are also used.
Map of the study area, showing major outlet glaciers, ice radar flight paths, velocity measurement locations, and the area of study for the mass-budget calculations.

Mass flux calculations are used here to examine the budget within the coastal strip. Use of these results in conjunction with similar studies of other areas will eventually reveal in more detail how the ice sheet is changing in response to environmental changes such as climate and sea-level variations.
2. Measurements
The glacier measurements are summarized in Table I and Figures 2, 3, and 4. Ice-thickness measurements were carried out using a 100 MHz ice radar mounted in a Pilatus Porter aircraft (Reference Bird, Morton and RobinsonBird and others 1975, Morgan in preparationFootnote *). Aircraft flight paths were controlled by drift sight readings of rock features and then plotted on large-scale aerial photographs. Aircraft height was determined barometrically, and ice surface and bed elevations were then determined from ice radar measurements. Bedrock echoes were obtained over most of the inland ice sheet and the lower (floating) sections of the glaciers. However, there was often a zone, generally near the grounding line, where thick ice and surface disturbances made it difficult to obtain a readable echo.
Surface and bedrock elevation profile for Rayner Glacier, with plots of normal load N, basal load corrected for buoyancy N*. and base stress N*α. Velocity V is calculated from the measured velocity for the length of the glacier assuming steady-state.

Surface and bedrock elevation profile for Robert Glacier, with plots of normal load N, basal load corrected for buoyancy N*. and base stress N*α. Velocity V is calculated from the measured velocity for the length of the glacier assuming steady-state.

Surface and bedrock elevation profiles for each of the remaining glaciers, showing, where available, position and magnitude of measured velocity.

MASS FLUX CALCULATIONS

Two techniques have been used to measure glacierice surface velocities. For the Robert and Beaver glaciers, a movement marker was accurately located near the centre line of each stream using satellite Doppler measurements (Reference YoungYoung 1979) in February 1978. These marker positions were remeasured in December 1979 and the velocities calculated from the displacement over the time interval. For the Robert, Wilma, and Rayner glaciers, station marker displacements were measured relative to a fixed (rock) location over periods of 10 d. Comparison of the two techniques for the Robert Glacier gave a difference of less than 2%.
Ice movement data for the ice sheet near Mawson, and for the Taylor, Jelbart, Hoseason, and Dovers glaciers are from Reference MellorMellor(1967) and Reference MorganMorgan(1973).
3. Data Analysis
The measurement programme provides for each glacier a longitudinal profile, one or more crosssectional profiles and a single-point ice-surface velocity. Glacier widths, as determined by the crosssection profiles, are used in conjunction with visible flow patterns from satellite photographs to estimate widths over the whole glacier length. There are thus sufficient data to allow calculation of the velocities up-stream and down-stream from the measurement point by assuming that the mass flux within each glacier is constant. For the purpose of studying the dynamics this is reasonable; it will be seen in the mass-budget calculations that surface ablation, accumulation and melt have only a minor effect.
From the data, the following quantities have been calculated: normal load N, basal load corrected for buoyancy N* and the down-slope driving force Nα.

where ρ̄i is the mean ice column density, g is the gravitational acceleration, and Z is the ice thickness.

where D is the depth of the ice base below sea-level and ρw is the sea-water density. In the calculation of Na, a is the surface slope along the flow line calculated over distances >10 Z. These are plotted for the Rayner and Robert glaciers in Figures 2 and 3 respectively. Where applicable, the calculations include consideration of glacier-shape factors from Reference NyeNye (1965).
4. Morphology
The outlet glaciers exist as a consequence of deep bedrock depressions which, for the larger glaciers, extend from the coastline to several hundred kilometres inland. The ice surface in the areas of lowered bedrock is also locally depressed and the relative lowering increases towards the coast. This produces the characteristic drainage basins in which ice with a relatively large surface slope converges towards the narrow, fast-moving outlet glaciers. Finally, the ice floats, giving low surface slopes and high longitudinal and transverse strains.
The ice radar records show variations associated with the different ice regimes. Radar returns from the floating sections are strong, due to the thin ice and good reflection coefficient of the ice/water interface, but display considerable bottom roughness and multiple echo structures. At some point near where isostatic considerations indicate the junction between floating ice and grounded ice, the bedrock echo becomes weak. This is generally observed and is particularly clear for the Rayner Glacier data. The change occurs over distances of only 2 km, and is presumed to be a good indication of the grounding line position of the glacier.
Further up-stream the bedrock echo becomes very smooth and is of uniform intensity, unlike that typically obtained for a rock-based ice mass. It is speculated that glacial erosion resulting from high sliding velocities has substantially smoothed and perhaps contributed to lowering of the bed. An abrasion-rate estimate of 0.01 m a−1 would seem reasonable (Reference Budd and SmithBudd and others 1979) for the velocities and stresses involved here. Bed lowerings of hundreds of metres are thus possible. The removed rock would be deposited down-stream building up until it touches the bottom of the floating glacier. The rough radar echo received for the floating sections possibly arises from tidal movement and the associated bottom crevassing over thick beds of moraine.
5. Mass-Budget Studies
Reference Morgan and JackaMorgan and Jacka (1981) calculated the ice flux across a line (labelled DC in Fig. l) to be 4.6±1 Gt a−1. The mass input from snow accumulation in the drainage basin (area DCE) was estimated to be 9.1±3 Gt a−1, giving an imbalance of +100% for the area. We now have sufficient data to estimate the mass budget in the area between the line DC and the line AB, the latter representing an ice radar flight path. The curves EDA and ECB, which define the west and east boundaries respectively of the areas, represent flow lines and are drawn perpendicular to the detailed elevation contours of Allison and others (unpublishedFootnote *). Ice flow from the area ABCD is through the Robert, Hoseason, Cosgrove, Dovers, Taylor, and Jelbart glaciers, and through areas of sheet flow between these glaciers.
Mass flux φ through a profile orthogonal to the ice-flow direction is given by

where V̄ is the mean velocity through the profile, ρ=0.91 Mg m−3 is the ice density, and sZW is the area of the profile, Z being the centre-line ice thickness, W the width, and s a cross-sectional shape factor (s = 1 for a rectangular cross-section; s = 2/3 for a parabolic cross-section).
V̄ is related to the surface centre-line velocity V by V̄ = rV, where r is defined by one of the following conditions.
(a) The ice mass is floating at the measurement site, and unconfined at the sides. The velocity is constant throughout the cross-section, thus r = 1.
(b) The ice mass is floating, yet confined at the sides. Very few measurements of velocity across the full width of cold, floating glaciers are documented. However, calculations from the measurements on the Hays Glacier, West Enderby Land, at Q6 (Reference Meier and MeierMeier 1976), and on the profile across the Amery Ice Shelf at G3 (Reference Budd, Corry and JackaBudd and others 1982) reveal ratios for centre-line surface velocity to mean surface velocity across the profile of 0.74 and 0.71 respectively. The vertical velocity profile is constant. A value for r of 0.74 is used
(c) The ice mass is not floating ; its movement is due to internal deformation with possible basal slip. Reference NyeNye (1965), from theoretical considerations, calculates the ratio of mean velocity over the whole crosssection to mean velocity over the surface of a glacier. Assuming a parabolic cross-section and deformational flow with a flow-law power of n = 3, this ratio is unity to within 10% for glaciers with a half width to ice thickness ratio>2. Furthermore, Nye postulates that this is a good approximation for glacial motion consisting of any combination of deformational flow and bed slip. We need then only consider the mean surface velocity, and using the factor of (b) above, we assume a factor of r = 0.74. (d) Cold, deformational sheet flow, i.e. an in finite slab with known surface velocity. Reference Budd, Jenssen and RadokBudd and others (1971) calculate ratios of surface velocity to mean velocity through a column of 0.85 and 0.92 at distances of 100 and 1 300 km along a flow line in East Antarctica, the value 0.92 applying to the warmer coastal ice with which we are here concerned. A value of r = 0.9 is used.
Assuming short-term steady state within each glacier, and by accounting for basal melting and surface ablation, the mass flux through the glaciers can be equated to the flux through the stream cross profile at the line AB. Maximum basal melt rate, M due to friction heating in the high sliding zone is estimated from

where L = 0.334 MJ kg−1 is the latent heat of fusion of ice, and geothermal heat flux, being comparatively small, is neglected. In the high velocity zones of the outflow glaciers, N*is small and typical values of Ṁ = 0.11 m a−1 result for the Robert and Rayner glaciers.
Reference Meier and MeierMellor(1967) measured ablation rates of 0.2 to 0.6 m a−1 near Mawson. Reference AllisonAllison (1979) found a near zero net surface balance on blue ice glaciers further inland. A mean ablation rate of 0.3 m a−1 is assumed. Ablation zones can be detected for the outflow glaciers by examining satellite photographs, thus the ice thickness is adjusted (Z*) by the total basal melt M and ablation A occurring through the length of each glacier between the measurement site and the line AB. A mean ice thickness of 460 m was obtained from ice radar measurements for the sheet flow sections of line AB (totalling ~190 km distance). Reference MellorMellor (1967), from ice movement measurements 12 km inland from Mawson, suggests a mean ice surface velocity of 18 m a−1 for general sheet flow. Using these values, a mass flux of 1.3 Gt a−1 is obtained for this section.
Table I summarizes the mass flux calculations. The total mass flux through the outlet glaciers is 8.8 Gt a−1,the Robert Glacier alone discharging 4.8 Gt a−1. Thus the outlet glaciers dominate the discharge of ice from this area of Antarctica.
Ice input to the area ABCD of Figure 1 consists of (a) flow through the line DC, estimated by Reference Morgan and JackaMorgan and Jacka (1981) to be 4.6 Gt a−1, and (b) snow accumulation in the area.
Glacier-ice surface velocities are considered accurate to ±2 m a−1. Errors in the sheet flow velocity may be substantially greater but the contribution from this source is small. Ice thicknesses are accurate to ±20 m, and glacier widths to ±500 m. The dominant uncertainty in the above estimates derives from a poor knowledge of the accumulation distribution in the area.
The fluxes across the lines DC and AB are 4.6 Gt a−1 and 10.1 Gt a−1 respectively. If we assume a balance condition, then the mean accumulation over area ABCD is 5.5 Gt a−1; i.e. 151 kg m−2 a−1. This is not incompatible with the accumulation measurements and we conclude that a near balance condition exists for the region.
6. Dynamics
6.1 Floating sections of glaciers
The forward motion in the floating section of the glaciers is governed mainly by the longitudinal stress and the drag on the sides. For the Amery Ice Shelf, Reference Budd, Corry and JackaBudd and others (1982) find that in the region where the longitudinal strain-rates are small the velocity V can be estimated by

where k = 1.6 × 10⁻² bar−3 a−1, γ is the glacier half-width, τγ is given by τγ = ρgαγ, where g is acceleration due to gravity and α the large-scale mean surface slope, and where n, the index of the power law for ice flow, is taken as 3.
For the Rayner Glacier (for which we have the most reliable surface profile, and hence α) if the longitudinal stresses are neglected we obtain a mean value of τγ = 2.1 bar for the section up-stream of the confluence with Thyer Glacier. The above relation then yields a centre-line velocity of 1 040 m a−1. From Figure 2, the extrapolated measured value was 1 160 m a−1. An error of 4% in the surface slope or a small longitudinal strain could account for the discrepancy.
6.2 Grounded glaciers
The surface velocity of a ground-based glacier is due to the sum of the internal deformation and basal slip. In the absence of temperature or bore-hole measurements, the deformation can be estimated from the empirical relations of Reference Budd and RadokBudd and Radok (1971) and Reference Budd and SmithBudd and Smith (1981). Their compilations for various ice masses of strain-rate V/Z versus base stress τb, where τb = fρgαZ and f is a shape factor show little scatter for each of the two distinct forms of cold and temperate ice. Figure 5 shows plots of V/Z versus τb for the Rayner and Robert glaciers with means through the data of Budd and Radok and of Budd and Smith. Also shown are points from the work of Reference AllisonAllison (1979) on the glaciers of the Lambert Glacier drainage basin.
Plot of strain-rate V/Z versus base stress τb for cold ice, temperate ice, Lambert Glacier area, Robert Glacier and Rayner Glacier. (Modified from Reference Budd and RadokBudd and Radok 1971, Reference Budd and SmithBudd and Smith 1981, and including data from Reference AllisonAllison 1979).
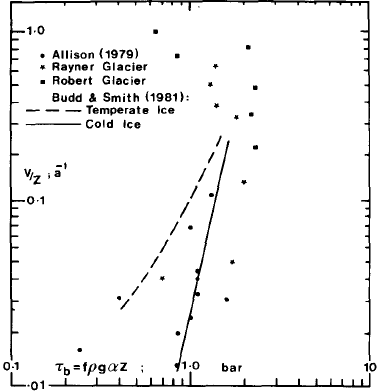
The Rayner Glacier points fall around the coldice line for lower values of V/Z but at higher values, as the strain-rate increases, the stress tends to fall. For the Robert Glacier this phenomenon is more dramatic as exceptionally high apparent stresses (greater than roughly 2.5 bar) have only moderate corresponding strains, and decreasing stresses towards the front are accompanied by rapidly increasing velocities. Several factors offer some explanation. The base stresses are actually much lower than given by τb = fρgαZ because (a) the longitudinal stress necessary to produce the observed velocity increase (~300 m a−1 to > 1 000 m a−1) in the cold ice is large and (b) especially for the Robert Glacier which is relatively narrow, the restraint at the sides which are cold will have a proportionally larger effect than at the bottom which is at pressure melting. The factor f should therefore be somewhat smaller than for a simple valley glacier. The high surface velocity at the lower stresses is due to basal sliding which becomes increasingly effective as the bedrock lowers towards the grounding line.
6.3 Ice sliding
Most theories of ice sliding, e.g. Reference WeertmanWeertman (1957, Reference Weertman1964, Reference Weertman1967), Reference LliboutryLliboutry (1959, Reference Lliboutry1964, Reference Lliboutry1968), and Reference NyeNye (1969, Reference Nye1970), assume a zero tangential force at the ice-rock interface which is at the pressure-melting point, and that the large-scale drag parallel to the bed is due to the bed roughness. In order for the ice to flow it must either deform plastically around bedrock obstacles, or melt at their forward faces and refreeze (regelate) behind them. Reference Budd, Keage and BlundyBudd and others (1979) found from laboratory experiments that the normal load is a significant factor and Reference MeierMeier (1968) from measurements on Nisqually Glacier found that the sliding velocity was not well predicted by existing theories. For the outlet glaciers the velocity increases with constant or even decreasing driving force (ρgαZ). This implies a reduction in drag at the base of the glacier, and thus a reduction in the normal force due to the increased buoyancy effect would appear responsible. As the normal load decreases the water film thickness can increase, submerging small obstacles and even filling in cavities in the rock. The glacier may lose contact completely with the bed for part of its cross-section due to the large-scale undulations of the cross-section bed profile. Finally, the extremely smooth bedrock, as shown by the radio echo-sounding, will obviously facilitate sliding but at present it is not possible to say at what scale the smoothness applies. There are large undulations with wavelengths in the order of a kilometre, but the bed is smooth on smaller scales than this, perhaps down to the order of 20 m. Although the ice radar beam width is large (~30°) the first part of the return echo comes from the nearest reflecting surface and the wide beam only lengthens the return pulse. Normally, bedrock echoes are constantly varying in strength due to interference patterns from bedrock irregularities of size equal to the half wavelength of the signal (1.5 m) or more. Whether the reduced fluctuations in echo strength over the outlet streams indicates a smoothness on this scale clearly needs further investigation. It does however fit a general picture of a smoothed bed produced by glacial erosion by a much larger glacier (which we know existed at some time from moraines high on nearby mountains), allowing the glacier to continue fast sliding even when it became much smaller
7. Conclusions
The mass fluxes calculated here for the outlet glaciers are believed to be accurate to ±10% or better. The mass input to the coast from ice flow and accumulation is less well known, due mainly to the sparseness of measurements, but it does seem clear that the inland ice sheet is rising and that the coastal 200 km or so (comprising the drainage basins discussed) is near to balance.
More accumulation measurements, preferably over a number of years, are needed to allow accurate profiles of the ice sheet's changing shape to be constructed. Confirmation of the results of mass-balance studies is also needed, the best method being by direct measurement of elevation change. The echo-sounding results show that the bedrock under the outlet glaciers is below sea-level over practically their entire length. Temperature gradient and thickness considerations indicate that basal temperatures are at the pressure-melting point. The water film thus produced is probably in hydraulic connection with the ocean and therefore will be less able to drain away than water under a non-marine glacier. Most theories of glacier basal sliding predict a considerable reduction in friction with an increasing water film thickness and it is surmised that this sort of mechanism operates for the outlet glaciers.
The echo-sounding also shows an unusually smooth bedrock under the glacier. This would facilitate sliding and make the water film even more effective. It is thought that the smoothness is a result of erosion of bedrock high spots by the sliding glacier and an effective filling in of cavities by the subglacier water.
Acknowledgements
We thank Professor W F Budd for many extensive discussions and valuable suggestions, and Ian Allison for supplying his detailed surface and bedrock elevation data for the study region prior to publication. During the measurement program, logistic support was given by the Australian National Antarctic Research Expeditions (ANARE). We thank all the expeditioners who have added to the success of the Australian Enderby Land summer programmes.



