
I. INTRODUCTION
Silicon carbide (SiC) is a heat-resistant material that exhibits many attractive properties such as high mechanical strength at elevated temperatures, low coefficient of thermal expansion, good chemical durability, good oxidation resistance, and excellent irradiation performance. The unique properties make it suitable to use in nuclear field more and more extensively. Reference Selvakumar and Sathiyamoorthy1,Reference Weber and Gao2 One famous application of SiC is the efficient use as a coating layer in the tristructural-isotropic (TRISO) coated fuel particle, which is the critical layer for hindering the release of fission products and provides the crucial safety in high temperature gas cooled reactor (HTGR). Reference Tang, Tang, Zhu, Zou, Li and Ni3–Reference Snead, Nozawa, Katoh, Byun, Kondo and Petti5 The TRISO-type fuel particle also shows great potential applications in other nuclear systems such as molten salt reactor, Reference Forsberg, Terrani, Snead and Katoh6 gas cooled fast reactor, Reference Meyer, Fielding and Gan7 and fixed bed nuclear reactor. Reference Sahin and Sefidvash8 Recently, triplex SiC fuel claddings are widely studied to replace the dominant zirconium claddings use in light water reactor. Reference Yueh, Carpenter and Feinroth9,Reference Kim, Kim and Park10 Besides applications in nuclear fuels, SiC and SiC based composite materials also display more and more promising applications as inert matrix, structural components, flow channel inserts, and thermal insulation in many fission or fusion energy systems. Reference Katoh, Snead, Henager, Hasegawa, Kohyama, Riccardi and Hegeman11,Reference Snead, Nozawa, Ferraris, Katoh, Shinavski and Sawan12
The most-used fabrication strategy is the so-called fluidized bed chemical vapor deposition (FBCVD) method for the preparation of SiC coating. Reference Minato and Fukuda13,Reference Liu, Liu, Liu and Shao14 In experimental studies, the effect of deposition temperature, dilute gas, and precursor concentration on the microstructure and stoichiometry of SiC for the case of methyltrichlorosilane (MTS, CH3SiCl3) as precursor have been studied by many works. Reference Minato and Fukuda13,Reference Lopez-Honorato, Meadows, Tan and Xiao15–Reference Minato and Fukuda17 In general, a qualitative conclusion can be obtained that stoichiometric SiC was produced between 1500 and 1600 °C, with free silicon or carbon co-deposited below or above these temperatures, respectively.
Although great efforts have been devoted to studying the preparation and characterization of SiC in the CVD system, there are still many disadvantages in the fabrication process of SiC products, such as high temperature and environment unfriendly. The microstructure of CVD SiC obtained in a wide range of experimental conditions still needs further improvement. Moreover, scattered experimental points should be analyzed systematically by further studies to establish a phase diagram of CVD SiC under different experimental conditions, which can give continuous boundaries of the phase change. For CVD SiC phase diagram studies, many works have been focused on the thermodynamic calculations in MTS–H2 system. Reference Kingon, Lutz, Liaw and Davis18,Reference Motojima and Hasegawa19 It should be indicated here, although some thermodynamic software can be used to calculate the CVD phase diagram more and more accurately, a systematic experimental study of SiC coating layer preparation using chemical vapor deposition method is still needed. The experimental phase diagram can be used as the solid foundation for optimizing the fabrication technology and microstructure of SiC series materials accordingly. Also, the phase diagram can be used to design novel structures of composite materials for practical applications in different fields.
In the present study, the microstructure evolution of SiC coating layer in CH3SiCl3–Ar–H2 system is given via a series of experiments by FBCVD. The experimental phase diagram of SiC coating layer and boundaries of three regions of SiC + Si, SiC and SiC + C are established. Different kinds of SiC series products aimed at applications in the nuclear field are developed from the as-obtained experimental diagram. In addition, the present work of the phase diagram of SiC in CH3SiCl3–Ar–H2 system will benefit the whole research community of C–Si related materials.
II. EXPERIMENTAL PROCEDURE
A. FBCVD method and experimental parameters
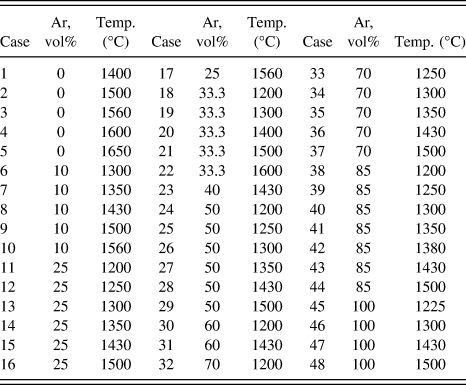
The FBCVD method was used to prepare the SiC coating layers as shown in Fig. 1. The fluidized bed here was a kind of spout bed with the conical bottom to fluidize high density particles. The gas and precursor were mixed at first in a cylinder tube and then injected into the coating furnace by a single-hole distributor with the diameter of 2 mm. The diameter of the main body of the spout bed was 50 mm. Spherical ZrO2 kernels with average diameters of 500 μm as surrogate particles were fluidized in the whole coating process in the conical spouted bed coating furnace. The PyC buffer layer and inner high-density PyC layer were deposited from acetylene at 1200 °C and the mixture of acetylene and propylene at 1400 °C, respectively. The SiC layer was deposited by the decomposition of MTS on the ZrO2/C/C particles at different temperatures using H2 and/or Ar as the fluidizing gas. The temperature of MTS was controlled as constant at 35 ± 0.1 °C by a water bath. The initial particle loading was 20 g and the coating time was 90 min, which were not changed in all the experiments for comparing the deposition rate directly. The bed temperature measured by an infrared pyrometer was changed from 1200 to 1650 °C. Hydrogen was used as the carrier gas with a gas flow of 0.6 SLM. The fluidization gas ratio of Ar (Ar/Ar + H2, vol%) was changed from 0 to 100%, but the total gas flow of Ar + H2 was kept unchanged as 6.0 SLM. Forty-eight experimental cases have been completed and the details of experimental parameters are given in Table I.
Schematic diagram of the fluidized bed chemical vapor deposition system.

Experimental parameters for SiC coating layers produced by the FBCVD method.

B. Characterization
The microstructure of the products was observed on a field emission scanning electron microscope (SEM). Raman scatterings were excited employing a He–Ne laser (λ = 633 nm), and were collected by a micro-Raman spectrometer in the wave number of 400–2000 cm−1 at room temperature. The crystal structure of the samples was examined by X-ray diffraction (XRD) on a D/max-RB diffractometer (Rigaku Corporation, Tokyo, Japan) using Cu Kα radiation (λ = 1.5418 Å) from 20–80° with a scanning rate of 4°/min. Particles were pasted onto a horizontal glass slide and kept close-packed in the XRD measurement.
III. RESULTS AND DISCUSSION
A. Effect of deposition temperature
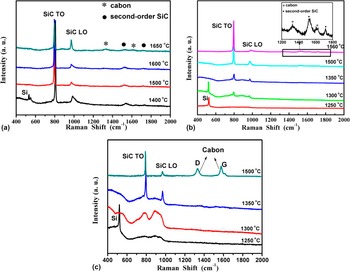
A series of experiments were carried out to investigate the effect of temperature on the phase and microstructure of the SiC coating layer at a fixed Ar gas ratio. Raman spectra of the SiC coating obtained at different temperatures with Ar volume ratio of 0, 25, and 50% were given in Fig. 2. Two main bands of 796 and 972 cm−1 were observed clearly for all the samples obtained from 1500 to 1600 °C in pure H2 atmosphere, which were the TO and LO modes of 3C SiC, respectively. Reference Liu, Liu, Zhang, Liu, Shao and Tang20,Reference Nakashima and Harima21 The small peak around 520 cm−1 emerged for the sample obtained at 1400 °C, which was representative band of silicon. Reference Lopez-Honorato, Meadows, Tan and Xiao15 For the sample prepared at 1650 °C, two weak bands around 1340 and 1600 cm−1 were observed, which were attributed from the Raman scattering of carbon. Reference Ma, Wang and Chen22 The results indicate that stoichiometric SiC can be produced in the range of 1500 and 1600 °C in pure H2 atmosphere, with silicon or carbon co-deposited below or above these temperatures respectively [Fig. 2(a)], which were in agreement with the literature. Reference Lopez-Honorato, Meadows, Tan and Xiao15,Reference Minato and Fukuda17
Raman spectra of the SiC coating layers obtained at different temperatures with Ar/(Ar + H2) gas ratio of: (a) 0%, (b) 25% and (c) 50%.

Compared with pure H2 atmosphere, the formation temperatures of silicon and carbon were varied by the addition of Ar. For Ar ratio of 25%, only silicon phase was detected at 1250 °C and SiC mixed with free silicon was obtained at a temperature of 1300 °C. Stoichiometric SiC was formed in the temperature range of 1350–1500 °C. Under relatively high temperature of 1560 °C, minor free carbon was found as shown in the insert of Fig. 2(b). Further increasing Ar ratio to 50%, silicon was also formed at the temperature of 1250 °C, but disappeared when the temperature was increased to 1300 °C and distinct carbon with high concentration was already observed at 1500 °C [Fig. 2(c)].
The morphology of the products also changed significantly with temperature, as shown in Fig. 3. Cauliflower structure composed by subordinate small particles was observed on the surface of the SiC coating at temperatures below 1350 °C at Ar ratio of 25%. At higher temperatures of 1500 °C, SiC was well crystallized and the dense surface with multi-faceted shape crystals was obtained. The crystal grain of SiC was enlarged significantly with increasing temperature.
SEM images of the surface of SiC coating layer obtained at different temperatures with Ar/(Ar + H2) gas ratio of 25%: (a) 1250 °C, (b) 1350 °C, (c) 1500 °C and (d) 1560 °C.

The results above indicated that the temperature played a key role on the formation process of SiC phase and morphology. It can be explained by the formation mechanism of SiC. In general, SiC can be deposited by two separate reaction sequences, one involving silicon chlorides and the other one involving hydrocarbons. The two reaction sequences occur in parallel and lead to deposition of silicon sites and carbon sites, respectively. Stoichiometric SiC is formed by the reaction of these two kinds of radicals. Compared with hydrocarbons, silicon chlorides react more efficiently with the surface. At low deposition temperatures, the formation of carbon sites is the limiting step and the lack of carbon sites will result in the formation of excess silicon. When the deposition temperature increased to some extent, the concentrations of reactive hydrocarbons and their rates of reaction with the surface are increased. So free carbon will form at very high temperatures when the deposition rate of carbon species start to compete against silicon species. Reference Lopez-Honorato, Meadows, Tan and Xiao15,Reference Papasouliotis and Sotirchos16,Reference Allendorf and Kee23
B. Effect of argon ratio
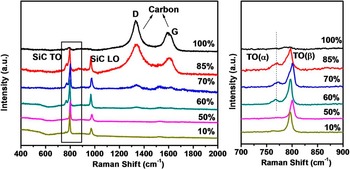
From the results above, it has been found that Ar ratio also has important influence on the phase and microstructure of SiC besides the effect of temperature. Silicon formation can be suppressed by increasing Ar ratio and carbon formation was promoted. Figure 4 shows Raman spectra of the obtained SiC coating layers at 1430 °C with different Ar/(Ar + H2) gas ratios. Free carbon began to form when the Ar ratio was higher than 50%, and the carbon concentration increased with increasing Ar ratio. Carbon was mainly detected with very weak SiC bands in Raman spectrum at the atmosphere of pure Ar. The results showed that the addition of Ar to the reaction system could effectively change the stoichiometry of SiC by promoting the formation of carbon sites. It should be indicated that H2/MTS ratio is decreased resulting of the addition of Ar in the present study. As confirmed by previous studies, when the hydrogen content in the coating furnace decreases and the temperature increases, the formation of surface reactive hydrocarbons becomes favored thermodynamically, therefore resulting in eliminating the excess Si and promoting the formation of carbon sites. Reference Minato and Fukuda13,Reference Lopez-Honorato, Tan, Meadows, Marsh and Xiao24
Raman spectra of the obtained SiC coating layers at 1430 °C with different Ar/(Ar + H2) gas ratios.

A wide small peak close to the main TO peak was observed in the Raman spectra for the samples obtained with Ar ratios higher than 50% at 1430 °C. The appearance of the new peak indicated the existence of a polytype, supposedly α phase SiC. The peak is located at 767 cm−1 which matches well with the TO band of 6H SiC. Reference Nakashima and Harima21 The peak intensity of the TO band of 6H SiC increased with increasing Ar ratio from 60% to 85%, consistent with the concentration increase of carbon. The results indicated that the formation of 6H SiC was coupled with the formation of carbon.
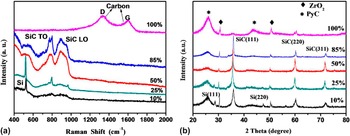
Experiments were also performed at other temperatures. Figure 5 shows Raman and XRD results of the phase change of the products obtained at 1300 °C with different Ar ratios. No free silicon was detected with Ar ratios higher than 25%. Although the main phase of SiC is 3C SiC from XRD patterns, the existence of α phase SiC was also confirmed by Raman results. For the Ar ratios from 50% to 85%, both the TO and LO peaks of SiC bands were boarded. The boarden of the Raman peak is attributed to the high density defects which may mainly originated from stacking faults. Reference Rohmfeld, Hundhausen and Ley25 No carbon was formed even at the Ar ratio as high as 85%. In pure Ar condition, carbon mixed with amorphous SiC was the main product. The experimental results at 1300 °C demonstrated consistent influence of Ar as discussed above.
Raman spectra (a) and XRD patterns (b) of the as-obtained SiC coating layers at 1300 °C with different Ar/(Ar + H2) gas ratios.

It was found that Ar ratio also influenced the surface morphology of the SiC layer. Evident cauliflower structure was observed on the surface of the SiC obtained at 1430 °C 10% Ar [Fig. 6(a)]. The subordinate particles were crystallized well by increasing Ar ratio [Fig. 6(b)]. For conventional CVD SiC obtained in pure H2 atmosphere at relatively higher temperatures, the main morphology was the faceted columnar structure with large grains, which was formed by the mass transfer controlled mechanism via layer-wise deposition. When Ar was introduced into the deposition system, the cauliflower structure was formed. The formation of the hemispherical granular structure was attributed to the surface kinetics controlled deposition mechanism by decreasing the H2/MTS ratio. In the surface kinetics controlled regime, the nucleation period was prolonged due to the small mobility of adsorbed atoms on the surface, which can produce nuclei continuously and facilitate the aggregation of nuclei. Reference Jung-Hwan, Byung-Jun, Doo-Jin, Geung-Ho and Hue-Sup26,Reference Yang, Wang, Ji, Han and Li27 The microstructure of the SiC obtained at 85% Ar was very different with that of lower Ar ratios. Pyramid shaped structure composed of highly aligned nanorods was observed [Fig. 6(c)]. As the composition of this sample was SiC mixed with carbon, high concentration of carbon may promote the formation of this structure. However, fine formation mechanism of this structure still needs further investigation. When pure Ar was used as the fluidized gas, the dense coating layer became porous [Fig. 6(d)]. A great amount of carbon was formed as confirmed by Raman result of Fig. 4.
SEM images of the surface of SiC coating layer at 1430 °C with Ar/(Ar + H2) gas ratio of: (a) 10%, (b) 50%, (c) 85% and (d) 100%.

C. Experimental phase diagram
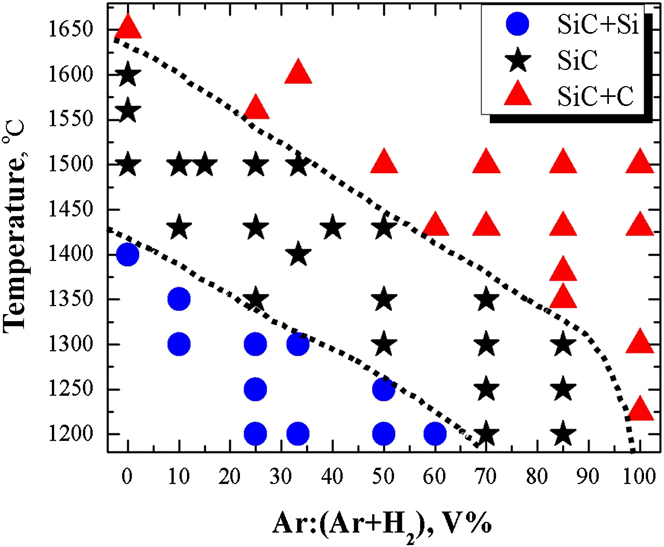
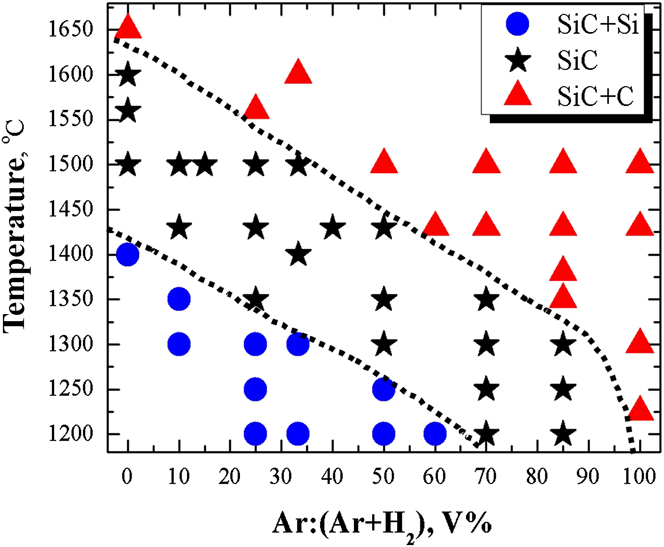
Summarized all the experimental results, the CVD phase diagram of SiC in CH3SiCl3–Ar–H2 system can be obtained as shown in Fig. 7. Three regions of SiC + Si, SiC, and SiC + C can be distinguished in the experimental phase diagram. In the previous studies, it was indicated that the calculated CVD phase diagram could be obtained by equilibrium calculations, which could be performed with the computer software SOLGASMIX-PV. Reference Besmann28 The experimental CVD phase diagram here is in agreement with the calculated phase diagram qualitatively. It can be found that free silicon was co-deposited in the area of low temperature and high hydrogen concentration. On the contrary, free carbon was easily co-deposited in the area of high temperature and low hydrogen concentration. Although the calculated CVD phase diagram can be used to guide the experiments qualitatively, its accuracy should be validated and the boundaries of different phases should be confirmed by experiments exactly. The experimental phase diagram can be used as a base for directive guidance of the fabrication parameters design of SiC-based series materials.
The experimental CVD phase diagram of SiC in CH3SiCl3–Ar–H2 system.
D. Deposition rate
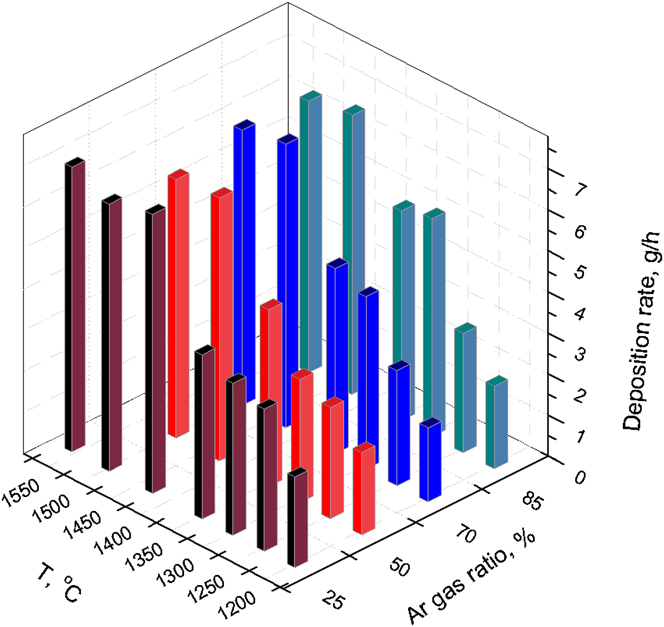
The deposition rate of typical samples for different temperatures and gas ratios are summarized in Fig. 8. It can be found that the deposition rate is mainly determined by the temperature, while the gas ratio has no significant effect in the experimental range. The deposition rate is increased dramatically from 1200 to 1430 °C, which is attributed to the increasing decomposition efficiency of MTS with temperature. After 1430 °C, the deposition rate is increased inconspicuously with temperature, which means that the decomposition efficiency of MTS is high enough after 1430 °C, and the surface growth kinetics becomes the determinate factor of the SiC layer growth process.
Deposition rate of the CH3SiCl3–Ar–H2 system at different gas ratios and temperatures.

IV. APPLICATIONS OF THE SiC PHASE DIAGRAM IN NUCLEAR FIELD
A. Low-temperature dense SiC
For industrialized TRISO coated fuel particles used in HTGR, the deposition is performed at nearly 1600 °C in pure H2 atmosphere. The temperature is too high and it will induce many technical problems on designing and manufacturing the deposition system and relevant accessory equipments. In addition, it requires a great deal amount of H2 because of the low density of H2 in the fluidization process. From the SiC phase diagram obtained above, SiC coating layers with high density can be produced at lower temperatures by the addition of Ar. As shown in Fig. 9, SiC layers with density close to the theoretical density of SiC (3.21 g/cm3) can be obtained under the conditions of 1430 and 1300 °C with Ar ratios of 50 and 85%, respectively. It is more than 150 °C lower than the temperature used now at 1600 °C, which will provide more degree of freedom in the reactor design of the coating system. Moreover, the low temperature will benefit for prolonging the lifespan of heating element which is critical in the industrial line. It should be indicated here that although the layer is dense enough, the grain size and morphology is changed with the addition of Ar. For the microstructure of the SiC layer, evident columnar grains can be observed (1600 °C, 0% Ar). However, for the samples obtained at lower temperature with higher Ar ratios (1300 °C, 85% Ar), the whole layer is formed by very small uniform equal axial grains. The function of the low-temperature dense SiC should be investigated by the irradiation test in the future.
Dense SiC layers obtained at: (a) 1600 °C (0% Ar), (b) 1430 °C (50% Ar) and (c) 1300 °C (85% Ar).

B. Porous SiC layer
Besides dense SiC, the obtained phase diagram is also very useful to synthesis porous SiC layer with tunable densities. At high Ar ratios, especially in the condition of pure Ar as fluidization gas, SiC mixed with high concentration of carbon can be obtained. The density of this kind of coating layer is relatively low because of the formation of carbon. Carbon can be easily removed by low temperature oxidation (∼700 °C), and pure SiC with porous structure can be obtained. The density of the SiC layer can be adjusted by changing the free carbon concentration, which is determined by the temperature and Ar ratio. Typical microstructures of the porous SiC layer are shown in Fig. 10. Using this phase diagram, SiC with densities from 30% to 90% of theoretical density of SiC was prepared. Based on these results, a novel design of TRISO particle with porous SiC layer to replace the porous PyC layer used in traditional TRISO coated fuel particles has been proposed in our previous study. Reference Liu, Liu, Chang, Shao and Liu29 The total internal pressure of the particles will be reduced by eliminating the formation of CO by using the porous SiC, which is expected to reduce the failure possibility of the TRISO particles in irradiated conditions. The porous SiC layer can also be very useful to construct some other types of coated particles such as full SiC coatings in some accident tolerance fuels.
Porous SiC layer obtained at 1430 °C with Ar/(Ar + H2) gas ratio of 100%. The sample was then oxidized at 700 °C after deposition to remove carbon.

C. Small grained SiC
The grain size of the stoichiometric SiC coating layer can be reduced by the addition of Ar in the deposition system based on the SiC phase diagram. SiC layer obtained at temperatures around 1600 °C is composed of large columnar grains. The growth direction of the columnar grains is usually parallel to the coating layer with some extreme large ones penetrating the whole layer. From irradiation results, most radioactive fission products could be hindered by this type SiC layer except silver. It was observed that 90% of the silver produced would release from large columnar grains, whereas only 30% of silver released from small grains validated by post irradiation tests. The results suggested that the formation of large columnar grains was responsible for the diffusion of silver. Reference Petti, Buongiorno, Maki, Hobbins and Miller30,Reference Nabielek, Brown and Offermann31 It has also been indicated that the expected improvement in radiation resistance upon grain size reduction. Reference Jamison, Sridharan, Shannon and Szlufarska32
From the as-obtained phase diagram, we found that in a wide region of lower temperatures and higher Ar concentrations, the stoichiometric SiC layer showed very fine grains. For conventional columnar grained SiC, the grain size is usually larger than 5 μm, however, the observed grain size in the surface of SiC layer is 1–2 μm and 300–800 nm for the condition of 1500 °C with 33.3% Ar and 1430 °C with 50% Ar, respectively [Figs. 11(a)–11(b)]. SiC with grain size in the range of 100 to 200 nm was obtained by further decreasing the temperature and increasing Ar ratio [Figs. 11(c)–11(d)]. Except enhanced property for hindering silver, this SiC layer with fine grains is expected to exhibit other better performances, such as higher oxidation resistance, higher mechanical properties, and higher heavy metal fission products blocking ability. The effect and functionalization of the fine grained SiC will also need further investigation by irradiation experiments in the next step.
SiC layer with fine grains obtained along the SiC/SiC + C boundary in the phase diagram: (a) 1500 °C, 33.3% Ar, (b) 1430 °C, 50% Ar, (c) 1350 °C, 70% Ar and (d) 1300 °C, 85% Ar.

D. SiC composite materials for jointing
Because of the importance of SiC, the deployment of monolithic ceramic or composite form SiC in advanced reactor designs necessitates the development of joining methods and joint materials. One critical application for nuclear-grade joining is the sealing of fuel within a cylindrical SiC cladding. For this fully ceramic system, an end-cap seal is required. The ability of joining SiC to itself or other materials is a critical, unresolved technological need regarding the application of SiC ceramics and composites in nuclear systems. Reference Khalifa, Deck, Gutierrez, Jacobsen and Back33–Reference Katoh, Snead, Cheng, Shih, Lewis, Koyanagi, Hinoki, Henager and Ferraris35 Although many jointing technologies such as diffusion bonding using various active fillers, transient eutectic-phase routes, glass-ceramic joining, pre-ceramic polymer routes were developed, a key issue is that the materials making up those joints have demonstrated poor irradiation stability. A reliable SiC joining technique is still a challenge for nuclear applications. From the diagram obtained, a new jointing idea can be proposed. SiC + Si and SiC + C can be deposited on the surface of the separated jointing parts and SiC can be formed by an in-situ reaction from free Si and C in the SiC composites under high temperature. From this jointing strategy, no other element will be introduced and the content of Si and C can be well controlled from the phase diagram. The in situ reaction jointing experiments are ongoing based this novel proposed idea.
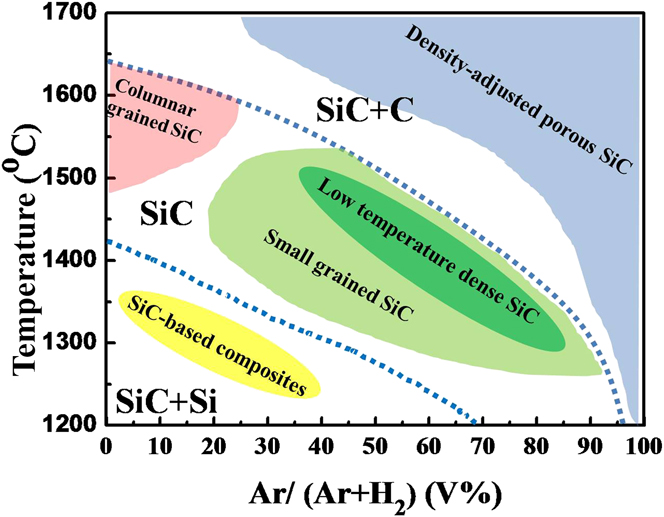
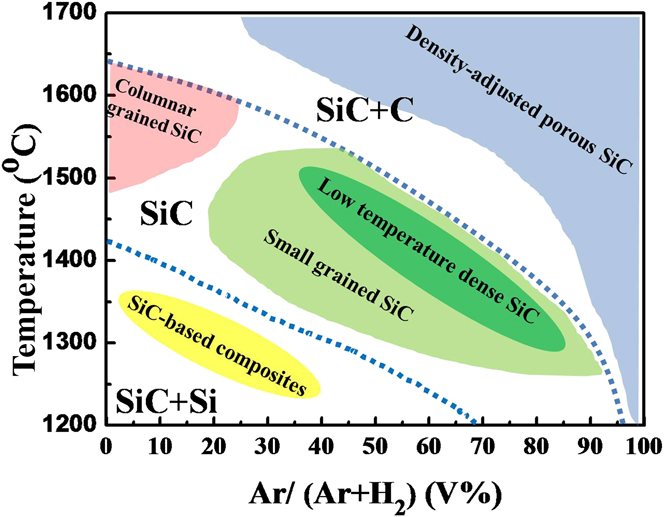
From the results and discussion above, different kinds of SiC-based series products can be developed from the as-obtained CVD SiC phase diagram, which were summarized in Fig. 12. As the development of the advanced fission or fusion reactor systems, SiC materials prepared by CVD method will show more and more promising and important applications and the materials with special microstructures and properties will meet diverse requirements. The phase diagram of SiC with integrated information will be very useful for fine manipulation of phase and microstructures of the SiC material, and also it will promote the new applications of SiC in many kinds of fields.
SiC-based series products aimed at potential applications in many kinds of fields based on the CVD SiC phase diagram.
V. CONCLUSIONS
A systematic study of SiC coating layer preparation at different temperatures and gas ratios in CH3SiCl3–Ar–H2 system by FBCVD is given in the present work. Based on the above discussions, the following conclusions can be drawn out:
-
(1) Free silicon was co-deposited at lower temperature and higher hydrogen concentration and free carbon was co-deposited at higher temperature and lower hydrogen concentration. Silicon formation could be suppressed by increasing Ar ratio and carbon formation was promoted. The morphology and microstructure of the SiC coating layer were influenced by the temperature and gas ratio of argon.
-
(2) The phase diagram of CVD SiC in CH3SiCl3–Ar–H2 system was established based on detailed experimental studies, which composed of three regions of SiC + Si, SiC and SiC + C. Two continuous and distinct boundaries between the three regions were obtained.
-
(3) The deposition rate was mainly determined by the temperature, while the gas ratio had no significant effect on the deposition rate in the experimental range.
-
(4) The phase diagram can be used to guide the potential applications of SiC based series materials. The low-temperature dense SiC, density-adjusted porous SiC, small grained SiC, and composite SiC materials were prepared successfully, and SiC jointing technology can be developed accordingly in the future. The as-obtained experimental phase diagram of SiC will benefit the whole research community of C–Si related materials.
ACKNOWLEDGMENTS
This work was supported by National Natural Science Foundation of China (Grant Nos: 51302148, 21306097), and Research Fund for Independent Research Projects of Tsinghua University (Grant Nos: 20131089217, 20121088038).