1. INTRODUCTION
The fast ignition scheme of inertial confinement fusion is an attractive way to igniting thermonuclear burn. In this scheme, the fast electron flow generated by ultra-high intensity laser heats and ignites a compressed core. First, a cone attached to the fuel capsule is imploded. Subsequently, the imploded core achieves an area density high enough to stop the electron flow. Then the ultra-high intense laser irradiates the tip inside the cone, resulting in generation of a fast electron flow. Finally, the kinetic energy of the fast electron flow is converted to the thermal energy of the compressed core, heating it to the temperature that ignites the thermonuclear burn. The advantage of this scheme is that it requires relatively small laser energy for ignition, compared to the conventional central ignition scheme (Azechi & FIREX Project, Reference Azechi2008).
However, in order to achieve the high-gain of the thermonuclear burn, we need to increase the energy coupling efficiency between the ultra-high intense laser and the compressed core. Kodama et al. (Reference Kodama2001) conducted the first experiment on this fast ignition in 2000. They observed an increased neutron yield from the highly dense core plasma heated by the ultra-high intense laser. Also, they showed the neutron yield scalability with the heating laser energy (Kodama et al., Reference Kodama2002). Their key discovery is to have demonstrated a large energy coupling ranging from 15% to 30% between the ultra-intense laser and the imploded plasma core. This finding attracted attention to the fast ignition scheme by many researchers. For carrying out fast ignition experiments using increased heating laser energy, an ultra-high intensity laser (LFEX) was constructed at Osaka University (Miyanaga et al., Reference Miyanaga2006), and also the OMGA-EP laser system was constructed at the University of Rochester (Maywar et al., Reference Maywar2008). Osaka University started the fast ignition realization experiment (FIREX) in 2009 (Nishimura et al., Reference Nishimura2010). This project has two phases. In FIREX-I, the goal is to achieve the ignition temperature of 5 keV by ultra-high intense laser heating. FIREX-II aims at achieving high gain thermonuclear burn. In order to get the core temperature of 5 keV, the energy coupling from the heating laser to imploded core must be increased from the current value. In her pioneering work, Baton et al. (Reference Baton2008) pointed out that pre-formed plasma inside the cone significantly disturbs the fast electron flow to the core. Cai et al. (Reference Cai2009) showed that existence of the pre-formed plasma inside the cone reduces creation of fast electrons of the energy less than 5 MeV. These electrons are the dominant contributor to heating of the core plasma. Johzaki et al. (Reference Johzaki, Nagatomo, Sunahara, Cai, Sakagami, Nakao and Mima2011) simulated generation of fast electrons using ultra-high intense laser and its transport to the core plasma, to investigate effects of the pre-formed plasma on the coupling between the laser and the core. They compared 1 micron and 10 micron scale pre-formed plasma, to study its effects on the energy coupling, and found that 10 micron scale pre-formed plasma lowered the coupling efficiency by about 20%, compared to the case of 1 micron, indicating that 1 micron-scale pre-formed plasma is better in gaining a high coupling efficiency. We investigated the pre-formed plasma formation in various pre-pulse conditions using one-dimensional (1D) radiation hydrodynamic simulations. The results show that 1 micron scale pre-formed plasma is obtainable using the laser of 1 × 10¹⁰ W/cm2 and 1 ns duration. We also found that when laser of 1 × 10¹¹ W/cm2 and 1 ns duration is used; the density gradient scale length of pre-formed plasma was about 7 microns (Sunahara & Tanaka, Reference Sunahara and Tanaka2010). In 2009, the first FIREX integrated experiment was carried out at Osaka University, using a beam of LFEX laser. We studied the pre-plasma formation using the same conditions as in the experiment by 2D radiation hydrodynamic simulation. In this work, we present estimation of the pre-pulse level of the 2009 FIREX experiment in Section 2, generation of the pre-formed plasma inside of the cone in Section 3, the CH film pre-pulse absorber in Section 4, and the advanced cone tip for reduction of undesirable effects of implosion shock on generation of the pre-plasma inside the cone in Section 5, respectively. Our conclusion is given in Section 6.
2. PRE-PULSE LEVEL
In this section, we estimate the pre-pulse intensity by comparing our simulation results with the experimental data obtained from the 2009 FIREX experiment at Osaka University. In this experiment, the gold plate was irradiated by a pre-pulse, and the generated pre-plasma was measured by a streak-camera with backlight. The experiment showed the density scale length of pre-plasma to be about 100 microns at the distance of 150 microns from the target surface. The measured blow-off velocity was 1 × 107 cm/s. The laser spot diameter and the pre-pulse duration, estimated from the self-emission of pre-plasma, were 40 microns (FWHM) and 1 ns, respectively. Here we assumed that the focal spot diameter of pre-pulse is the same as that of the main short pulse. However, the intensity of the pre-pulse could not be determined. Therefore, in order to estimate the intensity of the pre-pulse, we conducted 2D radiation hydrodynamic simulations using Star2D code (Sunahara et al., Reference Sunahara, Sasaki and Nishihara2008), with the laser intensity ranging from 1 × 10¹¹ to 1 × 10¹³ W/cm2 at 1 ns duration, 1.06 micron laser wavelength, and 40 micron laser spot. In the actual experimental condition, the plate, irradiated by pre-pulse, was gold. However, in our simulation, we used a tin plate, since we have accurate tin opacity data used in the extreme-ultra violet light research, and the accuracy of the data base has been confirmed (Nishihara et al., Reference Nishihara2008). From the 1D simulations (Sunahara & Tanaka, Reference Sunahara and Tanaka2010), the difference of the density scale lengths of the expanding plasma was estimated to be less than 50% between tin (Z = 50) and gold (Z = 79) at the laser intensities ranging from 1011 to 1013 W/cm2 (Sunahara & Tanaka, Reference Sunahara and Tanaka2010). We used the SESAME equation of state of tin (Johnson, Reference Johnson1994) and the tin opacity for radiation transport (Sasaki et al., Reference Sasaki2010). In our simulation, the hydrodynamic part is based on the HLLC scheme (Toro, Reference Toro1997) using the Euler coordinates. We calculated the laser absorption from the inverse-bremsstrahlung by straight ray tracing, and the electron thermal conduction using the flux-limited Spitzer- Härm model with the flux-limiter of 0.1 (harmonic mean). The radiation transport is calculated by the multi-group flux-limited diffusion approximation (Minerbo, Reference Minerbo1978) with 40 groups for the radiation energy from 0 to 1.5 keV. The target is irradiated by a normal incident laser without refraction. For making the calculation mesh, the axis symmetry is assumed. The three-dimensional (3D) effect of non-axis symmetry will be discussed in the future.
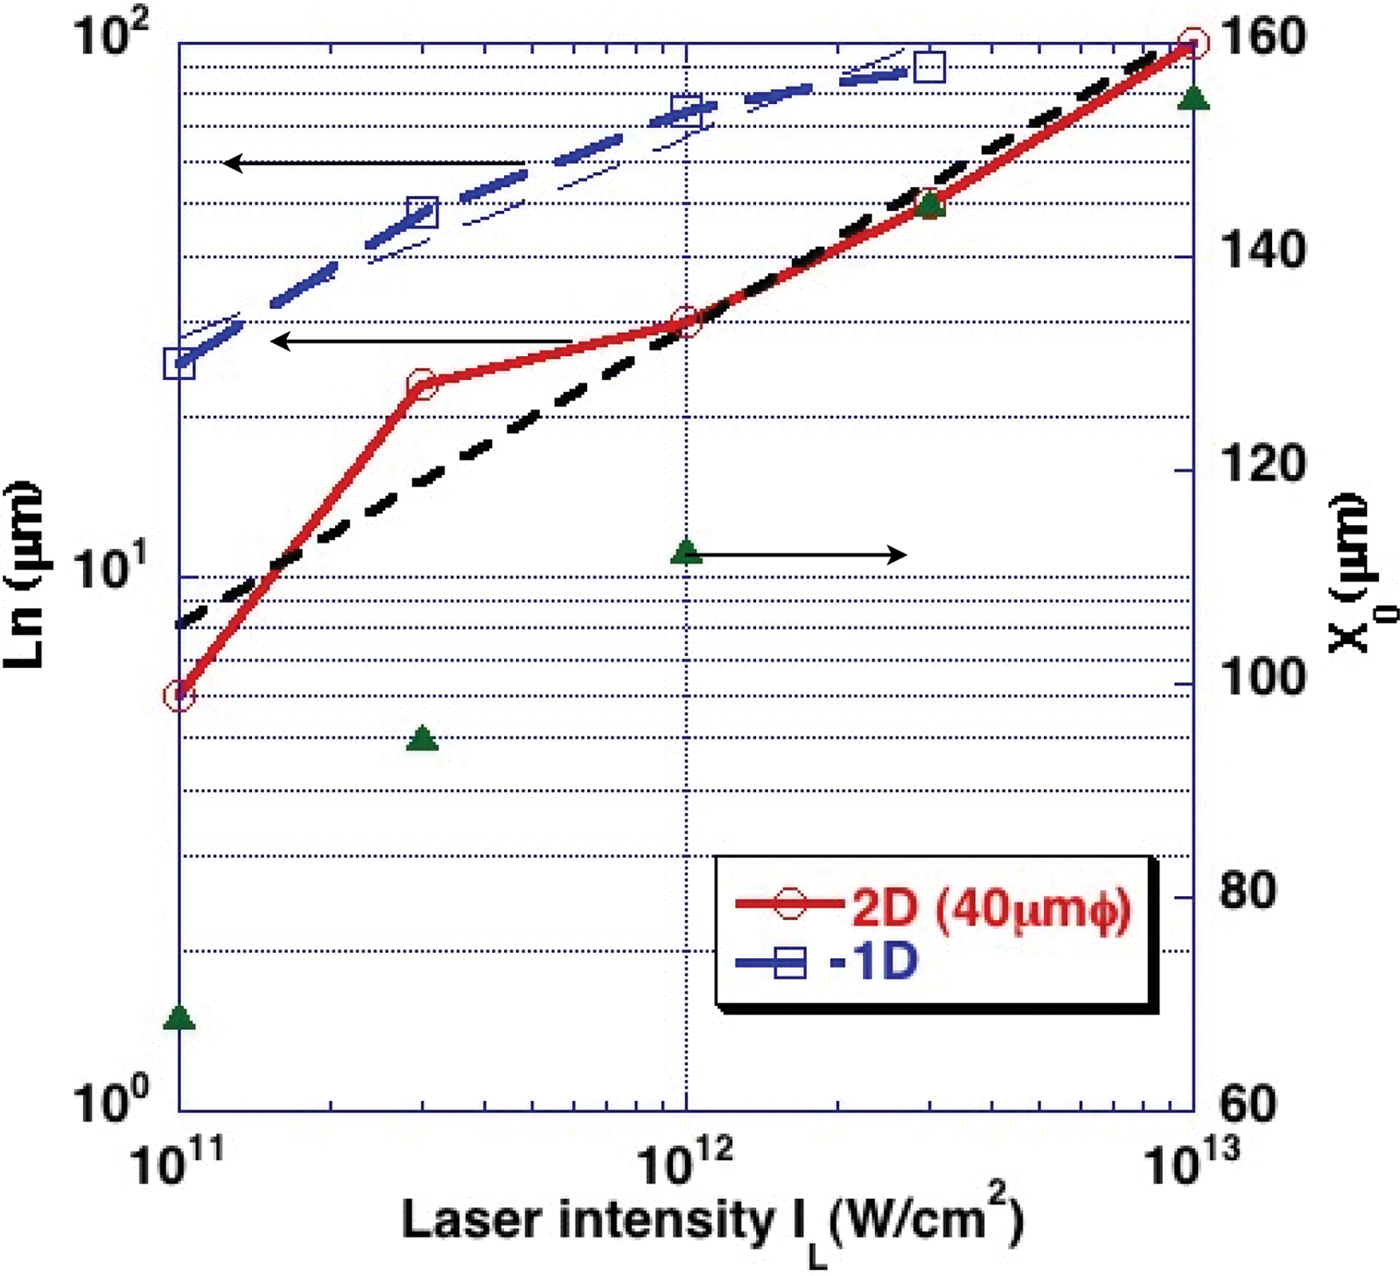
In Figure 1, we show the profile of the ion and electron densities and the electron temperature after 1 ns irradiation, at various laser intensities. The difference in the laser intensity results in different spatial scales of plasma expansion. We measured the density gradient scale length L n defined by L n = n e/(dn e/dx) at the mean position of n e = 5 × 1018 cm−3 and n e = 1 × 1018 cm−3. The results are shown in Figure 2. Also, in the same figure, we plotted the fitting point where the density gradient was fitted, and this point is almost the same as the length X 0 from the target surface to the mean position of n e = 5 × 1018 cm−3 and n e = 1 × 1018 cm−3. In order to estimate the spot size effect on the density scale length, we also plot the 1D calculation in the same figure.
(Color online) Profiles of electron number density n e, ion number density n i and electron temperature T e for tin plate irradiated by 1.06 µm wavelength 1 ns duration pulse with 40 µm laser diameter (FWHM). The n e and n i contour color bars are common for all the intensities. The T e color bar is different for each intensity.

(Color online) The density gradient scale length L n between n e = 5 × 1018 cm−3 and n e = 1 × 1018 cm−3 for 1D (dotted line) and 2D (solid line) as function of laser intensity I L. The small dashed line shows the fitting line in 2D case. The longer dashed line shows fitting line in 1D case. X 0 (triangle) shows the fitting point, giving L n from the target surface in 2D.
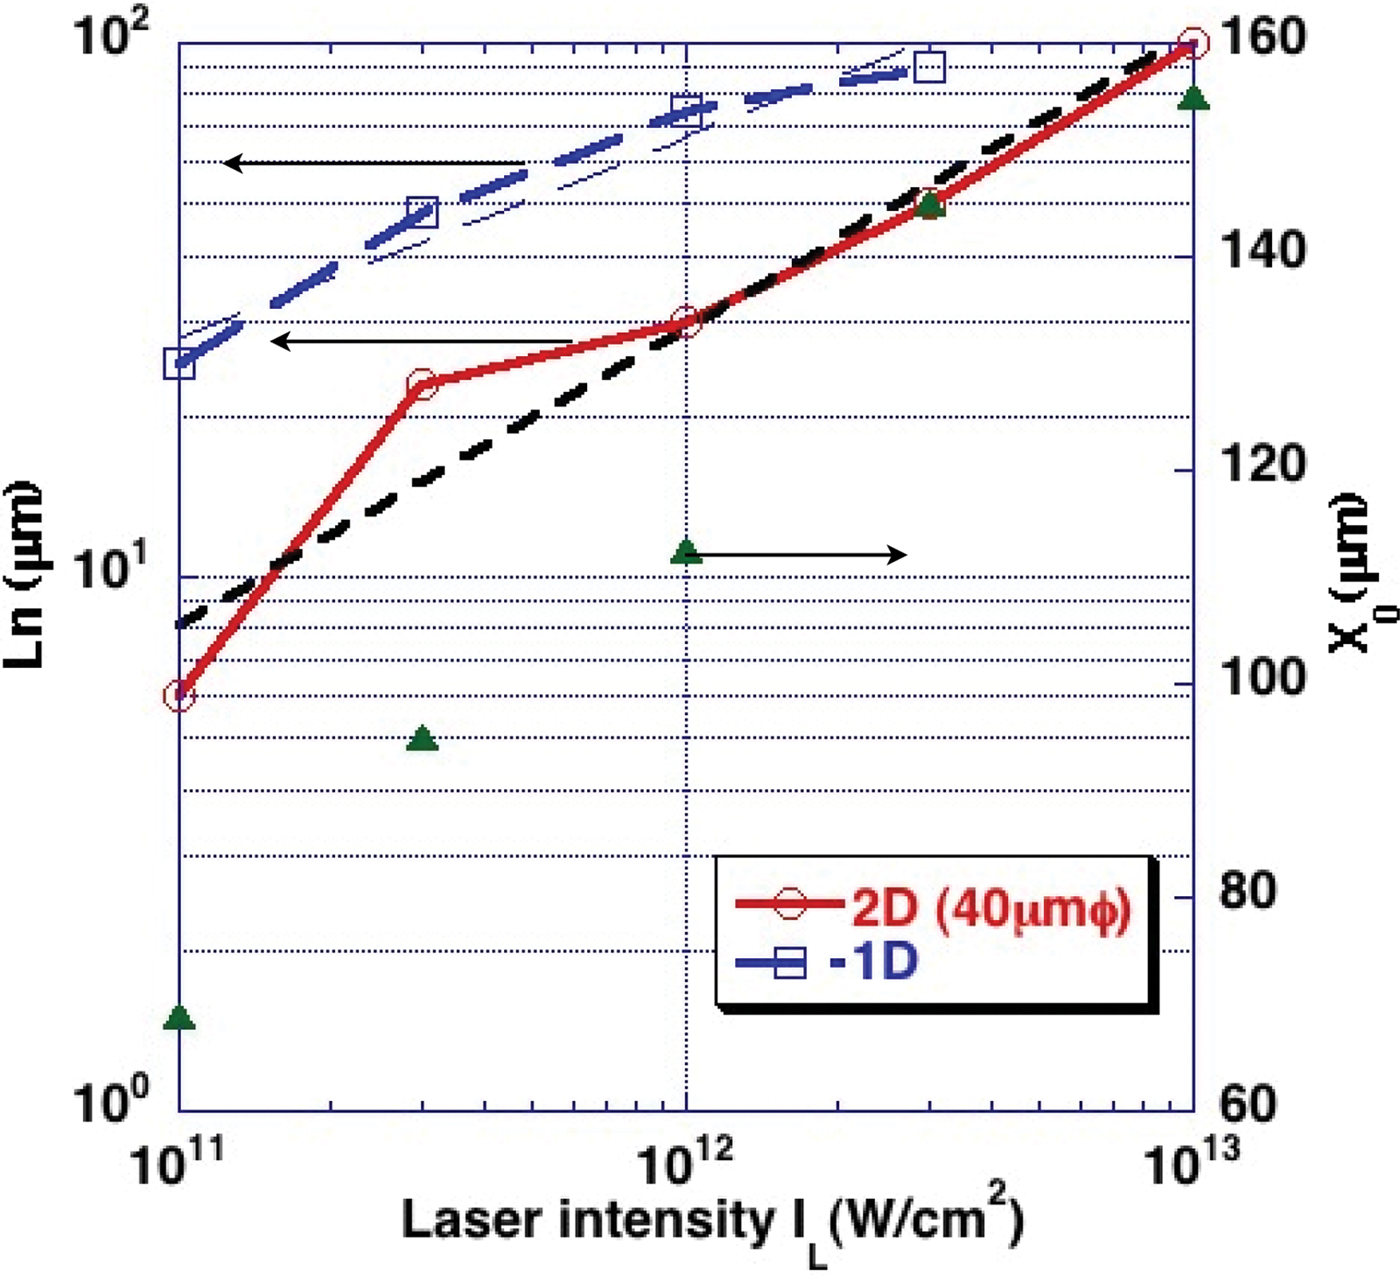
Figure 2 shows that 1D and 2D simulations give different density scales for the same laser intensity. We consider that this difference between 2D and 1D was caused by the spot size effect. Here, we see that when the laser spot diameter is 40 microns, the plasma expansion scale is less than a half of that obtained from 1D simulation for all the laser intensities. The scaling law of the intensity dependence on the scale length of pre-plasma is proportional to I L0.55, where I L is the laser intensity. On the other hand, the 1D dependence is roughly proportional to I L0.37. In the iso-thermal expansion model, the electron temperature is proportional to I L(2/3), and the sound velocity is proportional to I L(1/3). Therefore, the 1D scaling is consistent with the iso-thermal expansion model (Fabbro et al., Reference Fabbro, Max and Fabre1985). On the other hand, in the 2D scaling law, the exponent is 0.55. Generally speaking, at smaller laser intensity, the plasma expansion length is smaller, compared to the laser spot diameter because of the lower sound velocity, and the plasma expansion is close to the case of 1D cylindrical expansion, leading to a larger density scale length. In fact, at high laser intensity, the plasma expansion scale length can easily exceed the laser spot diameter due to the large sound velocity, and consequently, the plasma expansion is close to the case of 3D spherical expansion. This leads to a relatively smaller density scale length, compared to that of 1D expansion. However, our result does not follow this general idea, since the 2D simulation results show the case of non iso-thermal expansion. As seen in Figure 1, the temperature nearly peaks at the critical density of n e = 1021 cm−3. When the laser intensity is 1011 W/cm2, the high temperature region has a relatively flat profile and includes a large fraction of expanded plasma. In this case, the density profile shows an exponential decay as shown in Figure 3a. In other words, this profile is consistent with the profile of iso-thermal expansion. However, at the laser intensity of 1013 W/cm2, the high temperature region does not have a flat profile because of the 3D expansion and energy loss, and the electron temperature in the outer region is relatively low. Consequently, the density profile shows two gradient components and gives a longer gradient scale length in the outer region as shown in Figure 3b. This is the reason why the intensity dependence of 2D simulation has a larger exponent than the index of the 1D simulation.
(Color online) The electron and ion densities and electron temperature with (a) 1011 W/cm2 case, (b) 1013 W/cm2 case, respectively.

Next, we compare the simulation results with experimental data. In Figure 3b with the laser intensity 1013 W/cm2, we see the density scale length of 100 microns at X 0 = 150 microns, which is comparable to the experimental observation. Also, in Figure 3b, the electron temperature is 150 eV at X 0 = 150 microns, where the calculated blow off speed was 1 × 107 cm/s, in agreement with experimental observations. These comparisons show that in this experiment a pre-pulse, before the arrival of the main pulse of LFEX laser, was 1 × 10¹³ W/cm2 and 1 ns duration. The corresponding pre-pulse energy is estimated to be 130 mJ. For this pre-pulse of 1 × 10¹³ W/cm2 and 1 ns, the 2D radiation hydrodynamic simulations yielded the density gradient scale length of 100 microns, located at the 150 microns away from the target surface.
3. PRE-FORMED PLASMA
We simulated the pre-plasma formation inside the cone, using the pre-pulse estimated in Section 2. The laser wavelength and the spot diameter are set to 1.06 microns and 40 microns (Gaussian FWHM), respectively. The laser temporal profile is a flat top profile. The diameter of the tip of the cone target is 30 micron. The laser intensity is set to 1 × 10¹¹ W/cm2, 1 × 10¹² W/cm2, and 1 × 10¹³ W/cm2, and the open angle of the cone was set to 30°, 45°, and 60°, respectively. The wall thickness of the cone tip and the wall near the tip were both 10 microns. We again used tin for the target cone material, instead of gold used in the experiment.
In Figure 4, we show simulation results for various cone open angles and laser intensities: (a) 1 ns pulse duration, (b) 2 ns, and (c) 10 ns, respectively. In Figure 4a, we see that as the laser intensity increases, the generated pre-formed plasma fills the space inside the cone. For 30° open angle and the laser intensity of 1011 W/cm2, the pre-formed plasma is localized around the tip.
(Color online) The electron number density n e (cm−3) with (a) 1 ns duration pulse, (b) 2 ns, and (c) 10 ns. I L is the laser intensity of 1 × 10¹¹ W/cm2, 1 × 10¹² W/cm2, and 1 × 10¹³ W/cm2, respectively. The cone open angle is 30°, 45°, and 60°, respectively.

However, when the intensity increases to 1013 W/cm2, the pre-formed plasma expands into the entire space. This effect is reduced when the open-angle of the cone increases, since a larger open-angle cone has a larger volume to be filled with the pre-formed plasma. Also, the pre-formed plasma flow from the sidewall collides along the center axis of the cone, and yields a plasma jet. This jet was observed in the Hydra simulation (Kemp et al., Reference Kemp, Cohen and Divol2010), and as the laser spot diameter increases, this jet-like structure becomes prominent.
In Figure 4a, the critical density of n e = 1021 cm−3 of Nd: YAG laser is still very close to the position of the original surface of the tip. In Figure 4b, we show simulation results for 2 ns pulse duration and three different open-angle cases. The position of the critical density of n e = 1021 cm−3 shifts outward, when the laser intensity is 1013 W/cm2 and the open angle is 30°. Also the density scale length is larger than that of the previously studied 1 ns cases. In Figure 4c, we show results for 10 ns. Now the pre-formed plasma fills the inside cone, and the position of the critical density, n e = 1021 cm−3, shifts outward in all cases. Also, the shock wave breaks through the tip and sidewall near the tip.
In Figure 5, we show the density gradient scale length as a function of the laser intensity for 1 ns duration pulse and the cone open-angle of 30°, 45°, and 60°, respectively. Here, we measured the density gradient scale length along the cone axis, with assumption of n e(X 0) = n e exp(-X 0/L n), where X 0 is the distance from the critical surface, and L n is the gradient scale length for three different density regions; from 3 × 1021 cm−3 to 1 × 1021 cm−3, from 1 × 1021 cm−3 to 3 × 1020 cm−3, and from 3 × 1021 cm−3 to 1 × 1020 cm−3. L n is obviously longer than in the case shown in Figure 1, because the cone is a semi-closed system, and therefore, the expanding pre-formed plasma is confined by the sidewall, and the sidewall itself generates the pre-formed plasma. Also, in this confined system, the radiation transport is important. X-ray, emitted from the laser-heated region around the tip, heats and ablates the sidewall. From the estimation of pre-pulse level given in Section 2 and Figure 5, we conclude that in the FIREX 2009 experiment, the density scale length of pre-formed plasma for the 45° cone is 1 micron, 27 microns, and 47 microns, respectively, in the three different density regions described above.
(Color online) The density gradient scale length L n (μm) between (1) 3 × 1021 cm−3 and 1 × 1021 cm−3 (solid line), (2) 1 × 1021 cm−3 and 3 × 1020 cm−3 (dashed line), and 3 × 1020 cm−3 and 1 × 1020 cm−3 (dotted line), for 30°, 45°, and 60° cone open-angles as function of laser intensity.

4. CH FILM ABSORBER
For the purpose of reducing the pre-pulse, we investigate use of a thin film as an absorber of the pre-pulse (Kinoshita et al., Reference Kinoshita2004). First, a CH film absorbs the pre-pulse. Then, before the arrival of the main ultra-high intense pulse, it will expand to below the critical density. If the density is sufficiently low, the ultra-intense laser can penetrate the low density CH plasma. This idea is rather straightforward. However, choosing an appropriate film thickness is crucial for accurately controlling the expansion time. In order to see the general features of expansion, we conducted 2D simulations for a 0.1 micron thick 1 g/cm3 CH film, irradiated by the pre-pulse of 3 × 10¹¹ W/cm2. The laser spot diameter is 100 microns (Gaussian FWHM) and the temporal profile of the laser is a flat top. In Figure 6, we show the density profile at 1.2 ns after the irradiation began. At this time, the plasma density along the laser axis is 1/10 of the critical density.
(Color online) The density profile at after 1.2 ns laser irradiation with the laser intensity of 3 × 10¹¹ W/cm2. Laser is coming from the right hand side.

In Figure 7, we show the temporal laser absorption fraction f of light at 1.06 micron wavelength for two different CH thicknesses, 0.05 micron, and 0.1 micron, respectively. The laser intensity is 1 × 10¹¹ W/cm2. As the thickness increase, the duration of expansion, below the critical density, increases. Also, we see that after the expansion, the transmittance, defined by 1-f, slowly increases with time. In Figure 8, we show the laser absorption fraction for three different laser intensities of 1 × 10¹¹ W/cm2, 3 × 10¹¹ W/cm2, and 1 × 10¹² W/cm2, respectively. The CH foil thickness is 0.1 micron.
(Color online) The temporal laser absorption fraction f of light at 1.06 micron wavelength for two different CH thicknesses, 0.05 micron, and 0.1 micron, respectively. Laser starts to penetrate into the plasma at 0.5 ns for 0.05 micron thickness and 1.0 ns for 0.1 micron thickness.

(Color online) Dependence of the laser intensity on the laser absorption fraction with 0.1 micron CH foil for 1 × 10¹¹ W/cm2, 3 × 10¹¹ W/cm2, and 1 × 10¹² W/cm2, respectively. t 1 (solid arrow) is defined as the start timing of laser penetration into the plasma, t 1* (dashed arrow) as 10% transmittance of laser, and t 2 (dotted arrow) as the timing that electron density along laser axis inside the spot of 100 microns becomes under n e = 1020 cm−3.
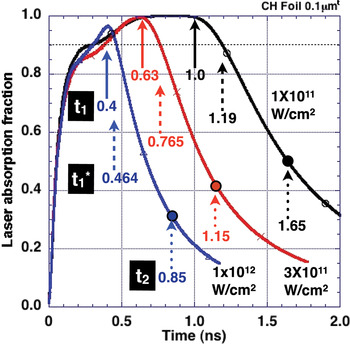
As the laser intensity increases, the duration of expansion below the critical density decreases. Here, we defined t 1 as the start timing of laser penetration into the plasma, t 1* as 10% transmittance, and t 2 as the timing that the electron density along the laser axis and inside the 100 micron spot becomes less than n e = 1020 cm−3, respectively. Also we see that after t 1, further expansion takes place for about 1 ns, until the plasma expands sufficiently so that 80% of 1 micron wavelength light penetrates into the plasma. In order to find the proper film thickness, we estimated the mass ablation rate in a CH film from t 1 to t 1*, compared with scaling law in the published articles (Fabbro et al., Reference Fabbro1982; Burdt et al., Reference Burdt2009), and found a scaling law similar to that given by Fabbro et al. (Reference Fabbro1982). Both the results of simulation and of Fabbro's formula agree reasonably well as shown in Figure 9. This enables us to find an appropriate thickness of CH films for a given pre-pulse level.
(Color online) Dependence of the laser intensity on the mass ablation rate. (1) is calculated from t 1 in the present work, and (1*) is calculated from t 1* in the present work. (2) is given by Fabbro et al. (Reference Fabbro1982). (3) is given by Burdt et al. (Reference Burdt2009).

5. POINTED CONE TIP
For the purpose of preventing penetration of the shock wave from the imploded core to the interior of the cone and creating pre-formed plasma, we propose using a pointed cone tip shown in Figure 10. In the conventional fast ignition experiment, a gold cone with a 5–10 micron thick flat-tip has been used. However, protection of the cone tip is very important to the future fast-ignition design, since when the implosion energy is increased, a high-pressure shock wave can easily destroy the cone tip. Using the pointed shape, we can increase the shock-traveling time from the imploded core to the inner surface of the tip. The shock speed is determined by the sound velocity, and in some high Z materials the sound velocity could be slow. On the other hand, concerning the fast electron transport, use of low-Z material for the cone tip is preferable, since high-Z materials tend to increase scattering of fast electrons (Johzaki et al., Reference Johzaki, Sentoku, Nagatomo, Sakagami, Nakao and Mima2009a, 2009b, Reference Johzaki, Nagatomo, Sunahara, Cai, Sakagami and Mima2010). We simulated the shock propagation in an aluminum pointed tip from the implosion plasma under the typical implosion condition of FIREX. The length from the inner surface to the tip is 50 microns, and the tip is located at the center of the implosion. The areal density is 2.7 g/cm3 × 50 microns = 0.0135 g/cm2, which is still smaller than 0.0193 g/cm2, the value for the conventional 10 micron gold flat tip.
(Color online) Schematic of the pointed cone.

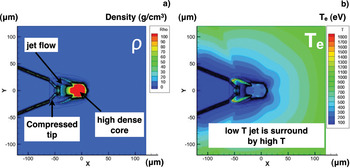
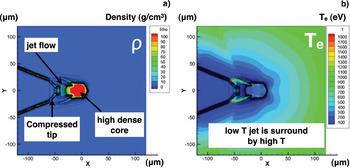
In Figure 11, we show profiles of the density and the electron temperature at the time of 2.77 ns, which corresponds to the maximum compression time of the implosion. The shock wave is propagating inside the pointed tip, but still does not break through the tip. The pointed tip is compressed from the original shape, by being shocked and punched by the shock wave. However the inner surface of the tip remains clean. Also we measured the maximum density of imploded core, and found it the same as that of the conventional 10 micron gold flat tip. This indicates the effect of the pointed tip on the implosion is small. In Figure 12, we show the delay time of the shock break-through from the imploded core to the inner surface, and compare it with the conventional 10 micron gold case. From this figure, when we use diamond-like carbon or aluminum of the solid density 2–3 g/cm3, we can increase the delay time to 20–30 ps, even though the lower-Z material has a smaller area density compared to that of the conventional gold tip with 10 micron. Further optimization of the pointed tip geometry should enable us to design a fast ignition tip target irradiated by ultra-intense laser which is clean, namely, a target that does not create pre-plasma by the shock break through.
(Color online) (a) The density profile and (b) the electron temperature profile at the maximum compression of implosion for aluminum pointed cone shocked by the high pressure of the imploded core.
(Color online) The delay time of shock break-through of the tip compared to the conventional gold flat tip with 10 micron thickness in the typical implosion condition of GXII laser in FIREX experiment.

Also, in Figure 12, the shocked and punched pointed tip is surrounded by the high temperature implosion plasma. The plasma resistivity given by Spitzer (Reference Spitzer1962) is a function of the degree of ionization and the temperature. At this time, the resistivity increases from the implosion plasma of the low density and high temperature to the pointed tip of the high density and low temperature. In this situation, when fast electrons flow because of ultra-high intense laser irradiation, a magnetic field will be generated along the boundary between the implosion plasma and the pointed tip. Subsequently the magnetic field may focus the electron flow to the imploded core. We will investigate this magnetic focus of the electron flow in the future.
6. SUMMARY
In conclusion, we estimated the pre-pulse level, which could not be measured in the FIREX experiment in 2009, to be 130 mJ, using the laser spot diameter of 40 microns that were measured in the same experiment. From 2D radiation hydrodynamic simulations, we estimated the density gradient scale length of the pre-formed plasma inside the cone to be 27–47 microns at the densities between the critical density n cr and 1/10n cr. This density scale length is still too large, and generation of fast electrons by an ultra-short pulse is significantly affected. In order to reduce pre-formed plasma, we investigated effects of using a CH foil pre-pulse absorber. It reduces the pre-plasma level, but its expansion duration increases considerably. Thus, foil is useful only at the highly intense pre-pulse level. We also proposed use of a pointed cone to protect the cone tip from the break through of the shock wave from the implosion plasma, before the main pulse irradiation starts. Our preliminary analysis shows that an aluminum pointed tip can increase the shock arrival time to 20 ps, longer than that for the conventional gold tip of 10 micron used in the typical implosion of GXII at Osaka University. Our proposed methods will be investigated in detail, especially generation of a magnetic field between the pointed tip and implosion plasma caused by the resistivity gradient in the fast electron flow.
ACKNOWLEDGMENT
This work was partially supported by the JSPS-CAS Core-University Program in the field of Laser Plasma and High Energy Density Physics.