


1. Introduction
Hurricanes regularly affect the southeastern United States, especially Atlantic coastal states from Virginia to Texas. According to the National Hurricane Center (2025), the Atlantic basin experiences an average of 14 named storms, 7 hurricanes, and 3 major hurricanes (Category 3 or higher on the Saffir-Simpson Hurricane Wind Scale) per season (June 1 to November 30). Between 1851 and 2023, approximately 270 hurricanes made landfall in one of the southeastern states (Atlantic Oceanographic & Meteorological Laboratory, 2024). Hurricanes impact socioecological systems through human health and mortality (Miller et al., Reference Miller, Fitch, Swilley-Martinez, Agha, Alam, Kavee and Pence2024; Young and Hsiang, Reference Young and Hsiang2024), infrastructure and buildings (Klepac et al., Reference Klepac, Subgranon and Olabarrieta2022; Rafi et al., Reference Rafi, Meng, Santos and Mozumder2024), local economies (Nair et al., Reference Nair, King, Gulledge, Preston, McManamay and Clark2020; Weinkle et al., Reference Weinkle, Landsea, Collins, Musulin, Crompton, Klotzbach and Pielke2018), agricultural crops (Bundy et al., Reference Bundy, Gensini and Van Den Broeke2023; Miller et al., Reference Miller, Arias and Alvarez2021), forest ecosystems and product markets (Henderson et al., Reference Henderson, Abt, Abt, Baker and Sheffield2022; Sharma et al., Reference Sharma, Ojha, Dimov, Vogel and Nowak2021; Sun, Reference Sun2016; Susaeta et al., Reference Susaeta, Carter and Adams2014), and environmental quality (Aly et al., Reference Aly, Casillas, Luo, McDonald, Wade, Zhu and Rusyn2021; Han et al., Reference Han, Whitworth, Christensen, Afshar, Han, Rammah and Symanski2022).
Effects from hurricanes on forest ecosystems include tree damage and mortality, and supply of standing inventory and harvested wood (Rutledge et al., Reference Rutledge, Cannon, McIntyre, Holland and Jack2021; Stanturf et al., Reference Stanturf, Goodrick and Outcalt2007). More specifically, hurricanes may lead to forest crown damage, defoliation, broken treetops, canopy fragmentation, downed limbs, and snapped or uprooted trees (Brandeis et al., Reference Brandeis, Turner, Baeza Castro, Brown and Lambert2022; Rutledge et al., Reference Rutledge, Cannon, McIntyre, Holland and Jack2021). In some cases, economic losses from tree damage and mortality can be partially mitigated through salvage logging operations, particularly prior to the damaged wood decays (Prestemon and Holmes, Reference Prestemon and Holmes2004). During salvage logging operations, which could persist for months or longer (Clarke et al., Reference Clarke, Stein, Sharma, Vogel and Nowak2025), wood product markets in the affected area are saturated with an oversupply of wood, leading to lower stumpage prices in the short run and impacts to consumer surplus and producer surplus in the short- and long-run (Henderson et al., Reference Henderson, Abt, Abt, Baker and Sheffield2022, Prestemon and Holmes, Reference Prestemon and Holmes2000, Reference Prestemon and Holmes2004; Sun, Reference Sun2016). At the same time, demand for lumber to meet reconstruction and recovery needs tends to increase following a natural disaster (Liu et al., Reference Liu, Lu and Tang2012; Sun, Reference Sun2016). Accordingly, forest sector labor (e.g., professionals in logging, trucking, and wood mills) is needed to address the shocks to wood product markets associated with impacts from a hurricane; however, productivity of the workforce may be constrained or delayed due to impacts to forests and wood products facilities such as ease of access to timber stands in need of remediation, safety of logging professionals and workers, and wood mill damage and closures (McConnell, Reference McConnell2007; Skerritt, Reference Skerritt2018; Stanturf et al., Reference Stanturf, Goodrick and Outcalt2007).
The literature on employment impacts from hurricanes is mixed; some research has found that aggregate employment decreased following a hurricane (e.g., Coffman and Noy, Reference Coffman and Noy2012), while other analyses suggest that impacts vary by industry, time, and the case study characteristics (e.g., Garber, Reference Garber2006; Martínez-Rivera et al., Reference Martínez-Rivera, Carvalhaes, Jevtić and Reddy2023). For example, Coffman and Noy (Reference Coffman and Noy2012) estimated private sector employment pre- and post-Hurricane Iniki in 1992 on the island of Kauai as compared to employment in a synthetic control based on Hawaiian Islands not affected by the hurricane. The study found that private sector employment in Kauai was significantly lower than private sector employment in the counterfactual scenario from the years 1992 to 1997 (Coffman and Noy, Reference Coffman and Noy2012). Meanwhile, Martínez-Rivera et al. (Reference Martínez-Rivera, Carvalhaes, Jevtić and Reddy2023) estimated an overall reduction in the employment rate in municipalities in Puerto Rico following Hurricane Maria when only the hurricane intervention was included as a determinant, but when other predictors were included in the model, results suggest that the employment rate slightly increased one to two years after the hurricane. In the case of Hurricane Katrina, total employment in private industry in heavily affected areas decreased by approximately 24% during the year after the storm (Garber, Reference Garber2006). Nearly half of the employment loss was concentrated in two industries: (1) leisure and hospitality and (2) trade, transportation, and utilities. During the same period, employment in (1) manufacturing and (2) natural resources and mining in heavily affected areas declined by approximately 22% and 2%, respectively, equating to over 9% of total private industry job loss (Garber, Reference Garber2006).
Furthermore, results from Groen et al. (Reference Groen, Kutzbach and Polivka2020) show that the duration of impacts from Hurricane Katrina also varied by industry. For instance, the construction industry experienced increased earnings in the short (up to one year after the storm), medium (two to three years after the storm), and long (six to seven years after the storm) terms, while the agriculture and resources industry experienced increased earnings in the medium and long terms, likely due to the impacts on labor demand and supply and not changes in average wages (Groen et al., Reference Groen, Kutzbach and Polivka2020). Schwam and Coe (Reference Schwam and Coe2023) modeled labor market effects of Hurricane Harvey on a single county as well as all 96 counties in the full sample, which includes counties in Arkansas, Illinois, Indiana, Kentucky, Louisiana, Mississippi, Ohio, Tennessee, and Texas. The researchers found that the unemployment rate was higher in Fort Bend, Texas (single county case study) as compared to the synthetic control case for up to six months after the storm, and the sign and magnitude of labor market impacts varied by county in the full-sample analysis, with some counties experiencing a slight decrease in unemployment and other experiencing larger increases in unemployment one month after the storm. When comparing the effects of multiple storms, Schwam and Coe (Reference Schwam and Coe2023) also observed that the distribution of magnitudes was greater for category 3 to 5 storms than category 1 to 2 storms. As the forest sector is linked to multiple industries (e.g., forestry and logging, sawmills and paper mills, and furniture manufacturing), it is not known how employment impacts from hurricanes are distributed, and if certain industries within the forest sector are more sensitive than others to differences in storm intensity.
This study uses a novel causal inference approach, specifically a weighted difference-in-difference (DID) model with heterogenous treatments, to assess the impacts of Hurricane Michael on employment in forest sector industries including forestry and logging, wood product manufacturing, paper manufacturing, and furniture manufacturing industries in affected counties of Florida, Georgia, and Alabama. Hurricane Michael was a category 5 storm that made landfall in the Florida Panhandle (northwestern part of the state along the Gulf coast) on October 10, 2018 (Beven et al., Reference Beven, Berg and Hagen2019). The hurricane led to human mortality, billions in economic damages, and significant impacts to forests and wood products markets in Florida, Georgia, and Alabama (Brandeis et al., Reference Brandeis, Turner, Baeza Castro, Brown and Lambert2022). Hurricane Michael represents an informative case study to evaluate the overall impacts on forest-based labor markets, as some research reveals that the frequency of intense hurricanes, categories 4 and 5, in the Atlantic basin as well as the impacts of hurricanes (e.g., rainfall and strong winds) in the southeastern United States and elsewhere globally may increase in the future (Bender et al., Reference Bender, Knutson, Tuleya, Sirutis, Vecchi, Garner and Held2010; Knutson et al., Reference Knutson, Sirutis, Vecchi, Garner, Zhao, Kim and Villarini2013, Reference Knutson, Camargo, Chan, Emanuel, Ho, Kossin and Wu2020; IPCC, 2022). Additionally, this event exhibited spatially heterogeneous impact severity along its path (Brandeis et al., Reference Brandeis, Turner, Baeza Castro, Brown and Lambert2022). Unlike traditional DID, the weighted DID method allows us to evaluate the causal impacts of the hurricane by accounting for spatial heterogeneity in treatments. Quasi-experimental and natural experimental methodologies, including but not limited to matching estimators, regression discontinuity design, and DID models, are used in socioecological research to evaluate the causal effects of a treatment or intervention on an outcome variable when randomized controlled trials are not feasible (Butsic et al., Reference Butsic, Lewis, Radeloff, Baumann and Kuemmerle2017; Leatherdale, Reference Leatherdale2019). Within the forest economics literature, causal inference techniques have been used to assess the effects of Hurricane Michael (Lamica et al., Reference Lamica, Parajuli and Brandeis2025), policies related to the COVID-19 Pandemic (Bruck et al., Reference Bruck, Parajuli, Chizmar and Sills2023; Chizmar et al., Reference Chizmar, Parajuli, Bruck, Frey and Sills2024), and the growth of the industrial wood pellet industry (Parajuli et al., Reference Parajuli, Brandeis and Chizmar2024) on the southern forest sector. While Lamica et al. (Reference Lamica, Parajuli and Brandeis2025) utilized a regression discontinuity framework to model Hurricane Michael’s impact on stumpage prices, the study does not explore impacts to forest-based employment following the storm, which is the primary objective of this study. Furthermore, our approach deviates from the framework used by Schwam and Coe (Reference Schwam and Coe2023) as we assess how employment impacts vary across counties according to different levels of a single storm’s intensity, instead of how effects vary across disparate storms. Similarly, our analysis addresses a potential bias discussed by Schwam and Coe (Reference Schwam and Coe2023) by distinguishing the impact of the storm at the county level as opposed to the storm level, given that hurricanes tend to weaken after landfall as they proceed inland.
The findings from this study provide evidence on the resiliency of the southern forest sector following a strong shock with varying levels of damage to timberland and the supply chain. Knowledge on the resiliency of the forest sector is needed to understand how the forest sector may respond to changes in the frequency and intensity of forest disturbances, which can be informative for planners, policymakers, and industry professionals in areas where disturbances occur now and in the future.
2. Methods
2.1. Quasi-experimental setup
Following Hurricane Michael, the National Oceanic and Atmospheric Administration (NOAA) delineated the storm’s path and severity based on observed wind speeds. Based on NOAA’s classification and observed forest damage, Brandeis et al. (Reference Brandeis, Turner, Baeza Castro, Brown and Lambert2022) classified the affected areas into three categories: Light to moderate, severe, and catastrophic. Light to moderate forest damage include areas that experienced wind speeds up to 110 mph and for which some type of forest disturbance was expected to be over approximately 45% of the trees in the range of damage. Severely damaged forests experienced winds in the range of 111–129 mph, very large rainfall amounts, and areas of widespread destruction of forest stands. Around 25–40% of trees have been laid on the ground, and some type of destruction was expected to be over 60% of trees or area. Catastrophically damaged forests are those in areas that experienced winds from 130–156 mph and above. Most trees were snapped and uprooted, and damage was expected to reach 95% or more.
Hurricane impact studies often include a binary treatment level, i.e., the treatment group has experienced the hurricane while the control group has not. The above description of varying levels of hurricane damage on the forest resources demonstrates different levels of economic impact in the affected region. Hence, this study includes Brandeis et al. (Reference Brandeis, Turner, Baeza Castro, Brown and Lambert2022) three levels of treatment to capture the heterogenous impacts of hurricane damage on forest employment (Figure 1). Treatment 1 corresponds to twenty-three counties with light to moderate damage; Treatment 2 represents seven counties with severe damage, and Treatment 3 represents four counties with catastrophic damage. A few counties intersected with multiple wind speed zones. In those cases, counties were assigned to the treatment category representing the largest share of area exposed to a given wind speed range. For example, if the majority of a county experienced winds up to 110 mph, it was classified under Treatment 1. The control group consists of a total of 60 counties in the southern states west of Alabama that did not experience any impact from Hurricane Michael and mimic the median harvest level as that of treated/affected counties. The county-level timber harvest information was obtained from the USDA Forest Service Timber Product Output (USDA Forest Service, 2026). This step ensures a reasonable number of counties in the control group so that the comparison across the different groups provides reliable estimates. We selected control counties from other southern states with broadly similar climate, economic, demographic, supply chain logistics, and forest policy landscapes to minimize the risk that the hurricane could affect our control group.
Hurricane Michael pathway and various damage groups, categorized by Brandeis et al. (Reference Brandeis, Turner, Baeza Castro, Brown and Lambert2022).

Figure 1. Long description
A map of the southeastern United States highlighting the pathway of Hurricane Michael and different damage groups. The map includes states from Virginia to Texas, with a blue line indicating the hurricane’s pathway. The damage groups are color-coded: yellow for Control, light red for Treatment 1, red for Treatment 2, and dark red for Treatment 3. The affected areas are primarily in the southeastern states, with the most severe damage (Treatment 3) concentrated in parts of Florida and Georgia.
2.2. Data
We examined the impact of Hurricane Michael on forest sector employment using monthly data from January 2017 to December 2019. Five sectors were included in the analysis based on the North American Industry Classification System (NAICS): Wood Product Manufacturing (NAICS 321), Paper Manufacturing (NAICS 322), Furniture and related product manufacturing sector (NAICS 337), Forestry and Logging (NAICS 113), and Support Activities for Forestry (NAICS 1,153). The analysis was conducted both in aggregate and for each sector individually. Employment data were obtained from the Quarterly Census of Employment and Wages compiled by the US Bureau of Labor Statistics.
Figure 2 illustrates the monthly trends in average total forest sector employment across the control group (top panel) and three treatment groups (bottom panel) from January 2017 to December 2019. Prior to the hurricane, employment levels in the control group remained relatively stable, fluctuating around 320–335 employees with no clear long-term trend. The treated groups exhibited distinct pre-hurricane trajectories, reflecting differences in baseline forestry activity and seasonal variation across counties. Following Hurricane Michael, the control group experienced a gradual but persistent decline in forestry employment, falling from approximately 325 employees in late 2018 to near 310 employees by the end of 2019. In contrast, the treated groups displayed heterogeneous responses. Treatment 1 experienced a sharp decline immediately after the hurricane, reaching its lowest level around the event period, followed by a partial recovery during 2019, although employment remained below pre-hurricane levels. Treatment 2 showed a modest decline immediately after the hurricane but then exhibited a sustained increase during early 2019 before stabilizing at a higher level than observed prior to the event. Treatment 3 experienced only a small immediate decrease and quickly recovered, returning to and slightly exceeding its pre-hurricane employment levels by late 2019.
Monthly average county forest industry employment by treatment groups. The vertical dashed line indicates the landfall of Hurricane Michael (October 2018).

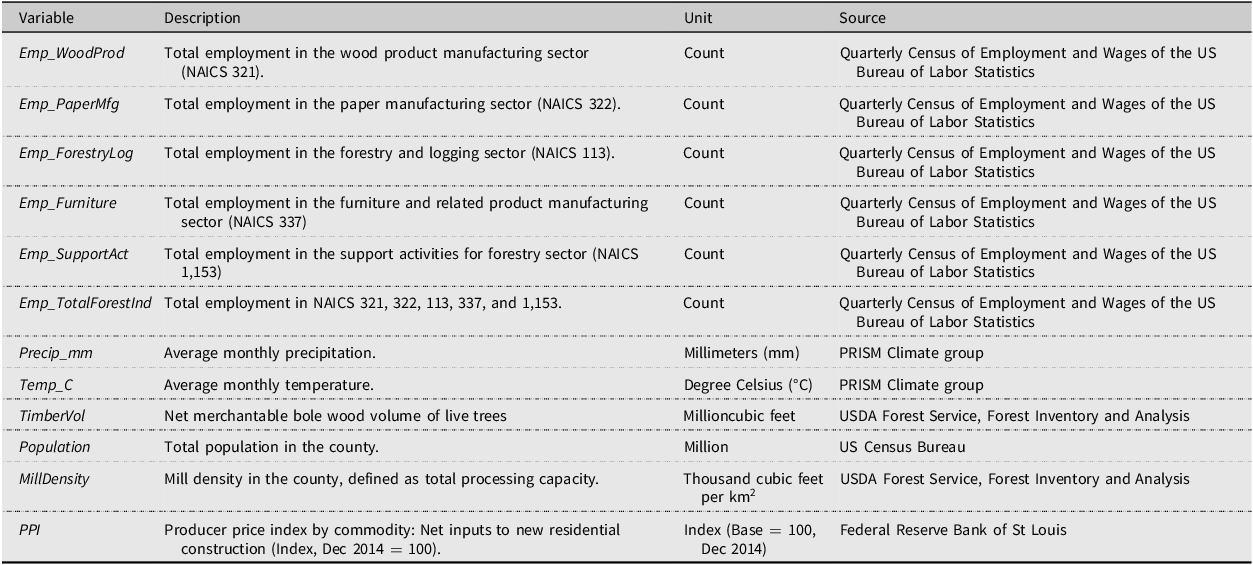
We included several covariates to account for additional factors influencing forest sector employment, including average monthly precipitation (Precip_mm), average monthly temperature (Temp_C), standing timber volume (TimberVol), total population (Population), county mill density (MillDensity), and producer price index (PPI). Table 1 provides definition and data source for all variables. Prior research has established that extreme weather conditions such as temperature and precipitation affect forest-sector employment (Lamica et al., Reference Lamica, Parajuli and Brandeis2025; Parsons et al., Reference Parsons, Masuda, Kroeger, Shindell, Wolff and Spector2022). Standing TimberVol and population play critical roles in sustaining sectoral employment, while mill density reflects local industrial capacity, directly influencing employment levels over time. The county mill density was constructed as
 ${1 \over n-1}{\sum }_{i=1}^{n}{vol_{i} \over {dist}_{i}^{2}};$
where n is the total no. of mills, dist is estimated from county centroid to each mill within a 200 mile radius, expressed in kilometers, and vol is the receipts, in thousand cubic feet, for mill i at time t. The final dataset consists of a monthly county-level panel covering treatment and control counties from January 2017 through December 2019. To see if the hurricane has long-term impacts, we also analyzed data from 2015 to 2021, results of which are presented in the Supplementary Material.
Description of variables. The dataset is a monthly panel at a county level from Jan 2017 to Dec 2019

Table 1. Long description
A table with 12 rows and 4 columns. The columns are labeled Variable, Description, Unit, and Source. The table lists various variables related to forest sector employment, including employment in different sectors, environmental factors, and economic indicators. Each row provides the variable name, a brief description, the unit of measurement, and the data source. The variables include total employment in wood product manufacturing, paper manufacturing, forestry and logging, furniture manufacturing, support activities for forestry, and total forest industry employment. Environmental factors include average monthly precipitation and temperature. Economic indicators include timber volume, population, mill density, and producer price index.
2.3. Analysis
We used the causal inference framework to analyze the impact of hurricane Michael on forest sector employment. Social science researchers have used causal inference models to estimate the impacts of hurricanes on human health, behavior, attitudes, and economic wellbeing (e.g., Bleemer and van der Klaauw, Reference Bleemer and van der Klaauw2019; Martínez-Rivera et al., Reference Martínez-Rivera, Carvalhaes, Jevtić and Reddy2023; Tian and Guan, Reference Tian and Guan2015; Spurlock et al., Reference Spurlock, Guignet, Runkle and Sugg2025; Visconti and Young, Reference Visconti and Young2024), prices (e.g., Beatty et al., Reference Beatty, Lade and Shimshack2021; Contat et al., Reference Contat, Doerner, Renner and Rogers2025; Zhao et al., Reference Zhao, Brooks and Du2024), and labor markets (e.g., Coffman and Noy, Reference Coffman and Noy2012; Schwam and Coe, Reference Schwam and Coe2023). Analysis was done in two steps: entropy balancing and weighted DID model estimation.
2.3.1. Entropy balancing
A key methodological challenge in this study is the presence of multiple treatment intensities (0, 1, 2, 3) rather than a simple binary treatment. Traditional two-way fixed effects models or generalized DIDs approaches risk double-counting, mis-weighting, and misrepresenting treatment effects in such settings. In addition, the non-random assignment of treatment may lead to biased estimates. To address these issues, we adopt a matching approach designed to approximate a setting where treatment assignment is as-if random (Apeti et al., Reference Apeti, Bambe and Combes2025). Specifically, we apply the entropy balancing method developed by Hainmueller (Reference Hainmueller2012) to construct a valid counterfactual for treated counties, similar to empirical strategy used in Tao et al. (Reference Tao, Wen, Sheng and Poletti2024). Entropy balancing proceeds in two steps. In the first step, control units are re-weighted so that pre-treatment means of covariates in the control group align with those of the treatment groups. This ensures that pre-treatment distributions are balanced across groups.
For each treatment level k ∈ {1, 2, 3}, we reweight control counties (Treatment i = 0) such that their pre-treatment covariate distribution matches that of treated group (Treatment i = k). Entropy balancing chooses weights w i (k) for control units by solving the following optimization problem:
 $\matrix{ {{{\min }_{{w_i}}}\sum\limits_{i \in C} {{w_i}^{\left( k \right)}} ln{w_i}^{\left( k \right)}} \cr } $
subject to the moment-balancing constraints:
 $\matrix{ {\sum\limits_{i \in C} {{w_i}^{\left( k \right)}} {X_{ij}} = {1 \over {{N_k}}}\sum\limits_{i \in Treatmen{t_k}} {{X_{ij}}}, j = 1, \ldots J,} \cr } $
where,
Treatment k is the set of counties in treatment group k,
C is the set of control counties,
X ij are pre-treatment covariates for county i, and covariate j,
N k = |Treatment k | is the number of counties in treatment group k.
Thus, entropy balancing enforces that the weighted control group exactly reproduces the mean covariate values of each treated group in the pre-treatment distribution across treatment intensities. This produces a set of group-specific weights w i (k), ensuring balanced pre-treatment distributions across treatment intensities. As in Tao et al. (Reference Tao, Wen, Sheng and Poletti2024), we restrict balancing to the first moments (means) because these capture the dominant pre-treatment differences in our data and avoid instability that may arise when constraining higher moments.
In the second step, the resulting weights are incorporated into a weighted regression framework, with the treatment indicator included as an explanatory variable.
 ${Y_{it}} = {\beta _0} + \sum _{k = 1}^3{\beta _k}\left( {Treatmen{t_{ik}} \times Pos{t_t}} \right) + {{\boldsymbol{\gamma}}^{{\boldsymbol{\prime}}}} {{\boldsymbol{X}}_{{\boldsymbol{it}}}} + {\alpha _i} + {\delta _t} + {\varepsilon _{it}}$
where Y it is the forest sector employment in county i at time t; Treatment ik is the county indicator which takes value 1–3 if the county was affected by Hurricane Michael; k indicates the level at which county was affected, i.e., 1: Moderately affected; 2: Severe affected; 3: Catastrophic affected. Control counties have Treatment ik = 0 for all k. Post t is the time indicator that takes value 1 after “October 2018,” i.e., the month when hurricane Michael took place, and 0 otherwise; and X it is a vector of time- and county-varying controls: average precipitation, average temperature, standing TimberVol, population, mill density, and the PPI. α i and δ t are county and time fixed effects; ϵ it is an error term.
The regression is estimated using the entropy-balancing weights:
 $\hat \theta = arg\ {\min _\theta }\sum\limits_{i,t} {{w_i}^{\left( k \right)}} {\left( {{Y_{it}} - \theta {\rm{ }}{Z_{it}}} \right)^2}$
where, Z it includes (Treatment ik ×Post t ), and X it . θ = (β k , γ′ , α i , δ t ).
Because the weights ensure that treated and control counties are comparable in the pre-treatment period, each coefficient β k corresponds to the average treatment effect on treated counties at damage level k.
Entropy balancing has several advantages. First, it explicitly balances covariates, whereas inverse probability of treatment weighting only ensures balance implicitly. Second, unlike propensity score matching or standard DIDs approaches, entropy balancing is non-parametric and does not require assumptions about the functional form of the treatment assignment process. Finally, by orthogonalizing covariates with respect to treatment, the weighting scheme helps mitigate multicollinearity concerns (Apeti et al., Reference Apeti, Bambe and Combes2025; Parish et al., Reference Parish, Keyes, Beadles and Kandilov2018).
2.3.2. Empirical model
We estimate the impacts of Hurricane Michael at three intensity levels (moderate, severe, catastrophic) across the US Southeast using weighted DID framework. The DID model compares changes in employment before and after Hurricane Michael between treated and control counties while accounting for observable differences through entropy balancing. Because treatment is represented by three hurricane-damage intensity levels (moderate, severe, and catastrophic), we estimate separate interaction terms for each treatment level with the post-hurricane indicator. The coefficients on these interaction terms (β k ) measure the average change in employment attributable to Hurricane Michael for each damage category relative to the control counties, after controlling for observed covariates, county fixed effects, and common time effects. Our empirical model specification is primarily guided by related past literature (Chizmar et al., Reference Chizmar, Parajuli, Bruck, Frey and Sills2024; Ferris and Frank, Reference Ferris and Frank2021; Lamica et al., Reference Lamica, Parajuli and Brandeis2025; Schwam and Coe, Reference Schwam and Coe2023). Besides our variable of interest, we include county-level, climate-average, precipitation and temperature to control for climate impacts on forest-based employment (Lamica et al., Reference Lamica, Parajuli and Brandeis2025; Parsons et al., Reference Parsons, Masuda, Kroeger, Shindell, Wolff and Spector2022) Similarly, we consider TimberVol, Population, and PPI for all commodities (PPI) to control for demand, supply and macroeconomic factors affecting the forest product supply chain (Chizmar et al., Reference Chizmar, Parajuli, Bruck, Frey and Sills2024; Ferris and Frank, Reference Ferris and Frank2021; Lamica et al., Reference Lamica, Parajuli and Brandeis2025). Additionally, we include MillDensity to account for the local mill capacity which should also partly control the changing mill dynamics including mill closures in the study region. The final specification is as follows:
 $\small{{X_{it}}{\rm{ }} = f[\ln {\left( {Preci{p_{mm}}} \right)_{it}},\ln {\left( {Tem{p_C}} \right)_{it}},\ln {\left( {TimberVol} \right)_{it}},\ln {\left( {Population} \right)_{it}},\ln {\left( {MillDensity} \right)_{it}},\ln {\left( {PPI} \right)_t}]}$
In a linear form,
 $\eqalign{ {Y_{it}} = \,\,& {\beta _0} + \sum\limits_{k = 1}^3 {{\beta _k}} \left( {Treatmen{t_{ik}} \times Pos{t_t}} \right) + {\gamma _1}\ln {\left( {Preci{p_{mm}}} \right)_{it}} \cr & + {\gamma _2}\ln {\left( {Tem{p_C}} \right)_{it}} + {\gamma _3}\ln {\left( {TimberVol} \right)_{it}} + {\gamma _4}\ln {\left( {Population} \right)_{it}} \cr & + {\gamma _5}\ln {\left( {MillDensity} \right)_{it}} + {\gamma _6}\ln {\left( {PPI} \right)_t} + {\alpha _i} + {\delta _t} + {\varepsilon _{it}} \cr} $
We estimate Equation (5) using the entropy balancing weights obtained from Equations (1)–(2), ensuring covariate balance between treated and control counties. The weighted regression includes county fixed effects (α i ) to control for time-invariant county characteristics and monthly time fixed effects (δ t ) to account for time-varying common shocks affecting all counties. Standard errors are clustered at the county level to account for within-county serial correlation.
3. Empirical results
3.1. Descriptive statistics
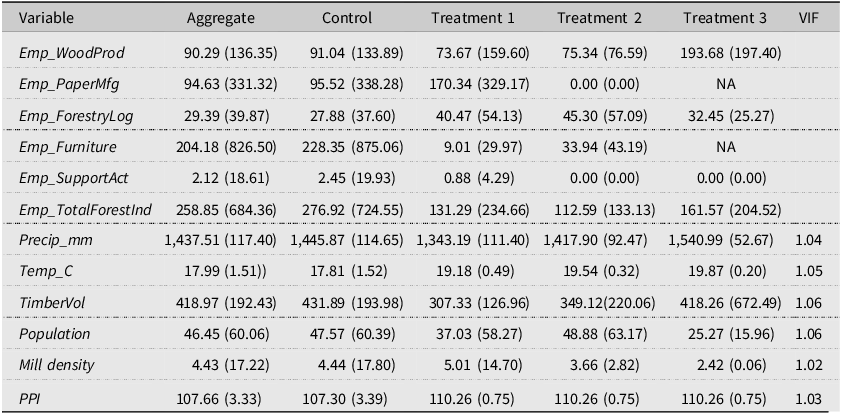
Table 2 provides the summary statistics of the variables used in the analysis. On average, counties had 90 employees in the wood product manufacturing sector (NAICS 321), 95 in the paper manufacturing sector (NAICS 322), 29 in forestry and logging (NAICS 113), 204 in the furniture (NAICS 337), and only two in the forestry support activities (NAICS 1153). Total employment across all five forestry-related industries (Emp_TotalForestInd) averaged 259 workers per county per month, though this figure varied widely, with some counties reporting zero employment and others exceeding 6,000 workers. Moreover, the results of the variance inflation factor (VIF) test confirm no potential multicollinearity among the regressors, as suggested by the low VIF scores.
Summary statistics of variables (Jan 2017-Dec 2019). Values are reported as means and standard deviations in parentheses. “NA” indicates that the statistic could not be computed because of no observations in the treatment group. VIF denotes variance inflation factor

Table 2. Long description
A table comparing summary statistics of various employment and environmental variables across different groups. The table has 13 rows and 6 columns. The columns are labeled as Variable, Aggregate, Control, Treatment 1, Treatment 2, Treatment 3, and VIF. The rows list different variables such as Emp_WoodProd, Emp_PaperMfg, Emp_ForestryLog, Emp_Furniture, Emp_SupportAct, Emp_TotalForestInd, Precip_mm, Temp_C, TimberVol, Population, Mill density, and PPI. Each cell contains mean values and standard deviations in parentheses. Some cells contain ‘NA’ indicating that the statistic could not be computed due to no observations in the treatment group. The VIF column denotes variance inflation factors.
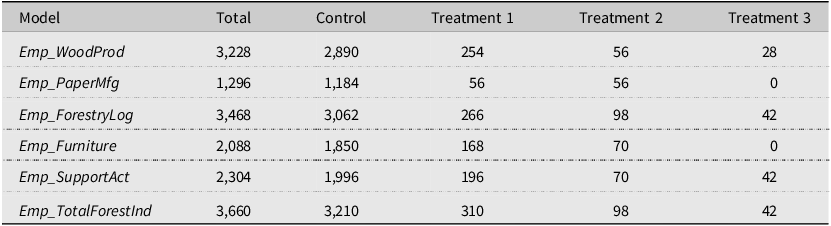
Table 2 also reports the summary statistics of employment outcomes and covariates by treatment groups. Before balancing, notable differences exist between control and treated counties. Control counties generally have higher average total forest industry employment, while treatment counties differ in observable characteristics such as climate conditions, TimberVol, population, and mill density. Table 3 presents the distribution of observations across treatment groups, which are the products of the number of counties having non-zero employment and the number of months. The number of observations varies across industries due to differences in industry presence across counties. In particular, paper manufacturing and furniture manufacturing have limited representation in some treatment groups, which reflects the uneven distribution of these industries across hurricane-affected counties.
Total observations across treatment groups. These numbers represent the product of the number of months data are available and the number of counties in each group

Table 3. Long description
The table presents the distribution of employment outcomes across different treatment groups in the forest industry. It includes six rows labeled as Emp_WoodProd, Emp_PaperMfg, Emp_ForestryLog, Emp_Furniture, Emp_SupportAct, and Emp_TotalForestInd, and five columns labeled as Total, Control, Treatment 1, Treatment 2, and Treatment 3. Each row shows the number of observations for each treatment group. For example, Emp_WoodProd has 3228 total observations, with 2890 in the control group, 254 in Treatment 1, 56 in Treatment 2, and 28 in Treatment 3. Emp_PaperMfg has 1296 total observations, with 1184 in the control group, 56 in Treatment 1, 56 in Treatment 2, and 0 in Treatment 3. Emp_ForestryLog has 3468 total observations, with 3062 in the control group, 266 in Treatment 1, 98 in Treatment 2, and 42 in Treatment 3. Emp_Furniture has 2088 total observations, with 1850 in the control group, 168 in Treatment 1, 70 in Treatment 2, and 0 in Treatment 3. Emp_SupportAct has 2304 total observations, with 1996 in the control group, 196 in Treatment 1, 70 in Treatment 2, and 42 in Treatment 3. Emp_TotalForestInd has 3660 total observations, with 3210 in the control group, 310 in Treatment 1, 98 in Treatment 2, and 42 in Treatment 3.
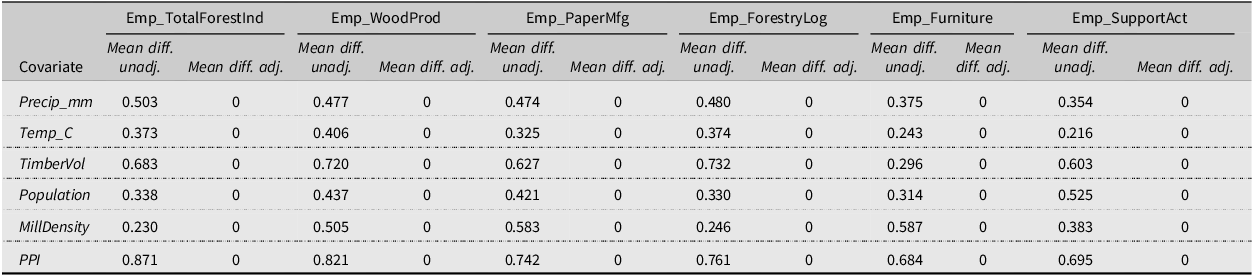
Table 4 presents the before and after balance summary of the covariates included in models. There was a substantial difference across treatment groups prior to entropy balancing. The pre-balance maximum pairwise standardized mean differences ranged from 0.230 to 0.871 in case of the total forest-based employment, indicating notable imbalance among covariates. After applying entropy balancing, the post-balance standardized mean differences for all covariates were reduced to zero, indicating that the weighting procedure achieved balance across treatment groups for the covariates included in the models. The results confirm that the weighting procedure effectively addressed pre-existing covariate imbalances, aligning the distribution of covariates across treatment levels to support unbiased estimation of treatment effects.
Covariate means and balance summary after entropy balancing

Table 4. Long description
The table presents a comparison of covariate means and balance summary before and after entropy balancing. It includes seven covariates: Precip_mm, Temp_C, TimberVol, Population, MillDensity, and PPI. Each covariate has two columns for mean differences: unadjusted and adjusted. The table has seven rows for covariates and two columns for mean differences. Row 1: Precip_mm, Mean diff. unadj. 0.503, Mean diff. adj. 0. Row 2: Temp_C, Mean diff. unadj. 0.373, Mean diff. adj. 0. Row 3: TimberVol, Mean diff. unadj. 0.683, Mean diff. adj. 0. Row 4: Population, Mean diff. unadj. 0.338, Mean diff. adj. 0. Row 5: MillDensity, Mean diff. unadj. 0.230, Mean diff. adj. 0. Row 6: PPI, Mean diff. unadj. 0.871, Mean diff. adj. 0.
Note: Mean diff. unadj. indicates pre-balance maximum pairwise standardized mean difference. Mean diff. adj. indicates post-balance maximum pairwise standardized mean difference.
3.2. Model results
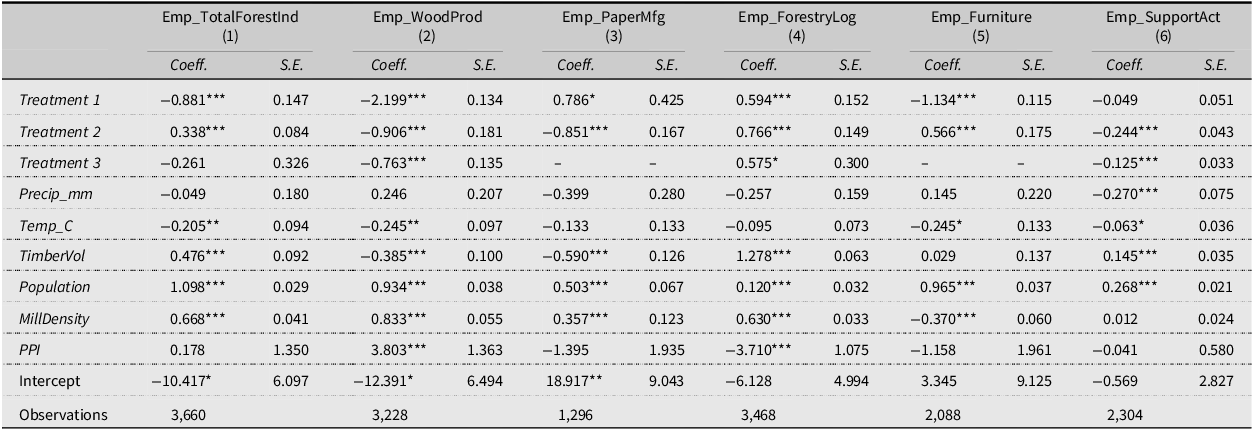
The results from the weighted DID model, following entropy balancing, examining the impact of Hurricane Michael on employment in the forestry sector are presented in Table 5. Column 1 provides estimates for total employment across forestry-related industries (NAICS 321, 322, 113, 337, and 1,153), while columns 2, 3, 4, 5, and 6 show results for employment specifically within the wood products manufacturing (NAICS 321), paper manufacturing (NAICS 322), forestry and logging (NAICS 113), furniture (NAICS 337), and forestry support activities (NAICS 1,153) sectors, respectively.
Model estimates from weighted difference-in-difference model with entropy balancing. S.E represents heteroskedasticity-consistent standard errors, adjusted for estimation of weights

Table 5. Long description
A table presenting model estimates from a weighted difference-in-difference model with entropy balancing. The table has 6 columns and 12 rows, including headers and footers. Column headers are Emp_TotalForestind, Emp_WoodProd, Emp_PaperMfg, Emp_ForestryLog, Emp_Furniture, and Emp_SupportAct. Each column shows coefficients and standard errors for different treatments and variables. Row labels include Treatment 1, Treatment 2, Treatment 3, Precip_mm, Temp_C, TimberVol, Population, MillDensity, PPI, Intercept, and Observations. Each row provides specific values for each column, detailing the impact on employment in various forestry sectors.
Note: ***p < 0.01; **p < 0.05; *p < 0.1.
The estimated treatment effects indicate heterogeneous impacts across subsectors based on the severity of hurricane damage. For the moderately affected counties (Treatment 1), total forest-sector employment significantly declined by about 58.56% (% change = (exp(coefficient)-1) × 100) relative to control counties and relative to the pre-Hurricane Michael period. This result appears driven largely by a substantial decrease in wood products employment by about 88.90% and furniture by about 67.83%, although employment in paper manufacturing, and forestry and logging increased significantly by about 119.46% and 81.12%.
Counties severely affected (Treatment 2) experienced significant increase in the total forest sector employment by about 40.21%, due to Hurricane Michael. There was a significant rise in forestry logging employment (115.11%), and furniture (76.12%). Conversely, employment in wood products manufacturing (−59.59%), paper manufacturing (−55.73%), and support activities (−21.65%) declined significantly in the Treatment 2 region. In the catastrophic damage zone (Treatment 3), the hurricane effect on total forest-based employment was negative but statistically insignificant. However, sector-specific analyses revealed a statistically significant employment reduction in wood products manufacturing (−53.37%) and support activities (−11.75%), but a significant increase in forestry and logging employment (77.71%) due to hurricane Michael.
Regarding control variables, total forest-sector employment had a significantly positive relationship with population, TimberVol, and mill density, but significantly negative relationship with temperature. Wood products employment was positively and significantly associated with population, mill density and PPI, while negatively and significantly affected by temperature and TimberVol. Paper manufacturing employment had a negatively significant relationship with TimberVol, and a positively significant association with population and mill density. Forestry and logging employment had a positive and significant relationship with TimberVol, population, and mill density, but this employment group was negatively affected by PPI. Furniture was positively and significantly associated with population but had a negative significant relationship with temperature and mill density. Lastly, forestry support activities had a significant negative relationship with temperature and precipitation, while this subsector was positively associated with TimberVol and population.
4. Discussion
Using the case of Hurricane Michael as a quasi-experimental setup with three pre-defined treatment levels, we evaluated the forestry labor market impacts of the hurricane in the affected counties in the Southern states. Some recent studies particularly evaluated the timber price impacts of Hurricane Michael (Henderson et al., Reference Henderson, Abt, Abt, Baker and Sheffield2022; Hernandez-Diaz et al., Reference Hernandez-Diaz, Musah, Morgan, Richey, Maggard, Via and Peresin2024; Lamica et al., Reference Lamica, Parajuli and Brandeis2025), and the focus of this study was employment impacts of the hurricane on the overall forest sector as well as subsectors within the forestry supply chain. While recent studies also utilized rapidly evolving causal inference approaches in evaluating the impacts of various policies and market events on forest-based employment (Ferris and Frank, Reference Ferris and Frank2021; Chizmar et al., Reference Chizmar, Parajuli, Bruck, Frey and Sills2024), this is the first study to quantify the impacts of a hurricane on labor markets of the forestry supply chain in the US South.
Our results reveal heterogeneous impacts of Hurricane Michael on the overall forest-based employment and forestry subsectors within the supply chain, depending on the intensity of hurricane damage and local market characteristics. The varying impacts of the hurricane by different treatment levels and subsectors could be explained by the availability and utilization of salvage wood, local timber market dynamics, post-disaster recovery and stand reestablishment efforts, and additional demand for wood for reconstruction and remodeling activities (Henderson et al., Reference Henderson, Abt, Abt, Baker and Sheffield2022; Prestemon and Holmes, Reference Prestemon and Holmes2004; Sun, Reference Sun2016). In the counties light-to-moderately affected by Hurricane Michael, represented by Treatment 1, after controlling other market factors, results suggest a significant overall decline in total forest sector employment. The fall in employment for moderately affected counties is largely driven by a substantial decrease in the forestry support activities, wood products, and furniture manufacturing subsectors, which overshadowed the significant positive impact on paper manufacturing and forestry and logging jobs. This suggests that even in areas with less direct physical damage, salvage utilization, trade between affected and unaffected regions, disruptions to supply chains, market demand, or labor availability following a major event can have a cascading effect on downstream processing industries (Johnston et al., Reference Johnston, Henderson, Guo, Prestemon and Costanza2024; Prestemon and Holmes, Reference Prestemon and Holmes2004; Sun, Reference Sun2020). Wood product processing facilities, which are usually more infrastructure-dependent and capital-intensive, are particularly more sensitive to operational disruptions such as power outages and facility damages. The positive impact on forestry and logging jobs is not surprising as there might be additional demand for clearing salvage logging activities within the region and surrounding counties (Johnston et al., Reference Johnston, Henderson, Guo, Prestemon and Costanza2024; Prestemon and Holmes, Reference Prestemon and Holmes2000; Sartorio et al., Reference Sartorio, da Silva, Henderson, Marufuzzaman, Crosby and Tanger2024).
In the severely affected region (Treatment 2), results reveal an overall increase, in total forest-based employment, primarily driven by a substantial increase in forestry and logging and furniture manufacturing industries, while both sawmills and pulp and paper mills, and forestry support activities realized a significant decline in jobs due to Hurricane Michael. The local timber market dynamics, availability and accessibility of salvage wood, and the severity of direct damage on wood processing facilities can explain the mixed impacts of the hurricane on forestry labor markets in the Treatment 2 counties. While salvage extraction through logging activities and timber tract operation efforts led to additional forestry and logging jobs, the manufacturing capacity for wood using facilities might have been significantly hampered by damage to infrastructure, power outage, or labor disruptions, leading to a bottleneck in wood product manufacturing in the region (Etters, Reference Etters2019; WJHG, 2018).
In the catastrophic damage zone (Treatment 3), results indicate no statistically significant change in overall forest sector employment, despite significant impacts of the hurricane on the wood products manufacturing, forestry and logging, and support activities subsectors. While forestry and logging employment again rose due to the hurricane, sawmills and supporting employment fell markedly, indicating a structural difference in the dynamics of subsectors and their operational complexity. Only three large-scale sawmills utilizing pine products existed in these catastrophic counties in Florida and Georgia (Forestproductlocator, 2024), which might have been severely disturbed by strong windfall and the aftermath of Hurricane Michael. Conversely, forestry and logging jobs would have been in high demand for salvage harvests, land clearing and timber tract operation efforts (Henderson et al., Reference Henderson, Abt, Abt, Baker and Sheffield2022; Johnston et al., Reference Johnston, Henderson, Guo, Prestemon and Costanza2024), since about one-fourth of the total utilized salvage was from catastrophic counties (Brandeis et al., Reference Brandeis, Turner, Baeza Castro, Brown and Lambert2022). Similarly, Johnston et al. (Reference Johnston, Henderson, Guo, Prestemon and Costanza2024) also assumed a 25% salvage rate for softwood in the Southeast region. For instance, one million cubic feet of timber harvests would require eight additional forestry and logging jobs in the context of the Southeast US (Sorenson et al., Reference Sorenson, Keegan III, McIver and Niccolucci2016).
Our findings demonstrate that Hurricane Michael induced mixed employment impacts within the forest sector varied by the subsector group and damage intensity. Regardless of the damage intensity (treatment level), the forestry and logging subsector realized positive employment impacts of the hurricane, while the forest products manufacturing group consistently lost a significant portion of jobs in the hurricane-affected region. The immediate surge in the requirement of clean-up and salvage operations as well as post-disaster timber tract activities drive up the demand for forestry and logging jobs. Additionally, loggers are usually flexible in terms of expanding their procurement zones depending on the market conditions and wood availability (Conrad and Blinn, Reference Conrad IV and Blinn2024). On the other hand, the wood product manufacturing facilities are relatively more vulnerable to negative employment impacts, likely due to damage to infrastructure and processing plants, and supply chain disruptions (Etters, Reference Etters2019; Henderson et al., Reference Henderson, Abt, Abt, Baker and Sheffield2022; Roos, Reference Roos2023). While reconstruction and remodeling activities in and around the affected zone could increase the immediate demand for wood products, wood processing firms would need to alter their wood procurement zones going forward due to significant damage in timber resources leading to a distortion of a sustained flow of wood supply (Johnston et al., Reference Johnston, Henderson, Guo, Prestemon and Costanza2024). Henderson et al. (Reference Henderson, Abt, Abt, Baker and Sheffield2022) estimated that both pine and hardwood sawmills lost the total welfare of around 0.5-0.8 times the no-hurricane baseline scenario, due to Hurricane Michael.
These findings have significant implications for disaster preparedness and economic recovery strategies in regions dependent on forest resources. Several rural counties in the US South are forestry dependent (Frey et al., Reference Frey, Kallayanamitra, Wilkens and James2022), where forest operations and forest-based industries are the main economic engine in the county economy. Sun (Reference Sun2020) pointed out that salvage wood and its utilization is the main market distortion following catastrophic storms and argued that more focus should be on the prompt utilization and processing of such wood. Furthermore, multiple studies included in a review by Zhai and Ning (Reference Zhai and Ning2022) found that impacts from forest disturbances persist in the long-run, drawing attention to the long-term resilience of the entire forestry supply chain and its ability to mitigate the adverse economic consequences of increasingly frequent and intense natural disasters, particularly in the US South. Findings from this study could help inform emergency preparedness strategies, specifically, which forest operations and product manufacturing subsectors are priorities for promoting resilient infrastructure and supply chains. Moreover, targeted support for labor mobility, training, and financial aid programs for wood processing facilities directly affected by extreme events may reduce the long-term dwindling effects of hurricanes on rural forest-based economies.
5. Conclusions
Hurricane Michael was a major catastrophic weather event that wreaked havoc on commercial timberland in the coastal region in Florida, Georgia, and Alabama (Brandeis et al., Reference Brandeis, Turner, Baeza Castro, Brown and Lambert2022). This study quantified the impacts of Hurricane Michael on forest-based employment throughout the timber supply chain in the affected region. We employed the weighted DID method as a causal inference approach, which allowed us to estimate average effects of hurricane damage with varying intensity by controlling potential imbalance in covariates. Results suggest that hurricane effects are not uniformly distributed across the forestry subsectors and vary by both hurricane damage intensity and forest industry subgroups within the supply chain.
With significant disruptions in standing timber inventory, the intensity of salvage wood utilization and stand management, post-hurricane recovery and remodeling efforts in the construction sector, and trade between damaged and undamaged regions explain the varying impacts of hurricanes on forest markets (Prestemon and Holmes, Reference Prestemon and Holmes2000; Sun, Reference Sun2016; Sun, Reference Sun2020). Our findings provide empirical evidence that through the forest supply chain, the catastrophic event negatively affected the wood product manufacturing sector while the forestry and logging sector offset the overall employment loss to some extent. Findings also underscore the critical role of adaptive logging responses in the face of broader demolishing timber resources. These findings may be informative for policymakers seeking to identify adaptive, location-specific forest sector policy needs that consider sub-sectoral vulnerabilities and capacity to respond to shocks pertaining to extreme events such as hurricanes.
It is important to note that our analysis is based on a case of a single catastrophic hurricane event, while forestland in the US South has constantly been hit hard by numerous large-scale hurricanes in the last few decades (Weinkle et al., Reference Weinkle, Landsea, Collins, Musulin, Crompton, Klotzbach and Pielke2018). Nevertheless, the majority of similar studies analyzed the impact of a single event, particularly Hurricane Hugo (Prestemon and Holmes, Reference Prestemon, Holmes, Prestemon and Holmes1998, Reference Prestemon and Holmes2000, Reference Prestemon and Holmes2004; Sun, Reference Sun2020) and Hurricane Michael (Henderson et al., Reference Henderson, Abt, Abt, Baker and Sheffield2022; Hernandez-Diaz et al., Reference Hernandez-Diaz, Musah, Morgan, Richey, Maggard, Via and Peresin2024; Lamica et al., Reference Lamica, Parajuli and Brandeis2025) on forest product markets. With evolving causal inference approaches in recent years, future studies could incorporate multiple events to draw a broader conclusion on the hurricane impacts such as Schwam and Coe (Reference Schwam and Coe2023). Another potential limitation of this study is that we employed the sub-industry level employment data reported by the Quarterly Census of Employment and Wages from the Bureau of Labor Statistics, which often suffer from data suppression, coverage exclusions such as self-employed workers, and time lags in reporting (US BLS, 2023). However, this is the best dataset for the 3-digit NAICS industries in a monthly frequency, and several studies (Chizmar et al., Reference Chizmar, Parajuli, Bruck, Frey and Sills2024; Ferris and Frank, Reference Ferris and Frank2021; Lamica et al., Reference Lamica, Parajuli and Brandeis2025) utilized this dataset to evaluate the forestry labor market impacts of various policies and events. In terms of future line of research, it would be interesting to explore the long-term employment trajectories, spillover effects of the hurricane from treated to control counties, and the role of policy interventions in facilitating resilience, recovery, and sustainability within these vulnerable sectors in the hurricane-prone coastal regions.
Supplementary material
The supplementary material for this article can be found at https://doi.org/10.1017/aae.2026.10063.
Data availability statement
The data and code used to produce results are available upon request to the corresponding author. We haven’t posted them in any public repository, but will be provided freely if needed. AI was used only for improving the flow and clarity once the manuscript draft was completed.
Author contributions
Conceptualization, S.L., R.P., S.C., C.B., A.N.; Methodology, S.L., R.P., S.C., C.B., A.N.; Formal Analysis, S.L., R.P., A.N.; Data Curation, S.L., A.N.; Writing—Original Draft, S.L., R.P., S.C., A.N. Writing—Review and Editing, S.L., R.P., S.C., C.B., A.N., T.O.; Supervision, R.P., C.B.; Funding Acquisition, C.B., and R.P.
Financial support
This study is supported by the USDA Forest Service, Agreement Number: 22-CR-11330145-036. The USDA Forest Service also supported Brandeis and Chizmar’s time dedicated to this study. The findings and conclusions in this publication are those of the authors and should not be construed to represent any official USDA or U.S. Government determination or policy.
Competing interests
No conflict of interest exists.




 Open access

