Introduction
Most animals are bilaterally symmetrical, but the symmetry is rarely perfect. Asymmetries can be conspicuous or subtle on the order of <5% of the trait size. There are three forms of bilateral asymmetry: directional asymmetry (DA), fluctuating asymmetry (FA) and antisymmetry (Palmer, Reference Palmer and Markow1994). DA reflects a consistent bias towards the greater development of one side of the body than on the other, whereas antisymmetry occurs when the side that is larger varies at random among individuals (Palmer, Reference Palmer and Markow1994; Palmer & Strobeck, Reference Palmer and Strobeck1986). In turn, FA is characterized by small, random deviations from the perfect symmetry of bilaterally symmetrical traits (Palmer & Strobeck, Reference Palmer, Strobeck and Polak2003). It is believed that DA and antisymmetry may be adaptive, whereas FA reflects developmental instability (DI; Palmer, Reference Palmer and Markow1994).
There are a few methods for estimating DI such as the level of FA or the frequency of phenodeviants. It is thought that FA reflects DI because both body sides of a bilaterally symmetrical individual share the same genotype and environment. Consequently, all deviations from bilateral symmetry are the result of perturbations during development (Mather, Reference Mather1953). These perturbations are believed to arise from stochastic molecular and cellular processes (Babbitt et al., Reference Babbitt, Kiltie and Bolker2006; Graham et al., Reference Graham, Raz, Hel-Or and Nevo2010). Thus, FA provides a measure of how well an individual can buffer its development against internal genetic and external environmental stresses during morphogenesis (Møller & Swaddle, Reference Møller and Swaddle1997). However, the results of studies using FA as a measure of DI remain inconsistent. In insects, FA have increased under environmental stress factors such as temperature (Chapman & Goulson, Reference Chapman and Goulson2000; Trotta et al., Reference Trotta, Calboli, Garoia, Grifoni and Cavicchi2005, nutritional stress (Imasheva et al., Reference Imasheva, Bosenko and Bubli1999), parasitic infection (Polak, Reference Polak1993) or chemicals (Abaga et al., Reference Abaga, Alibert, Dousset, Savadogo, Savadogo and Sedogo2011), as well as under genetic stress factors such as inbreeding (Carter et al., Reference Carter, Weier and Houle2009), homozygosity (Messier & Mitton, Reference Messier and Mitton1996) or hybridization (Ross & Robertson, Reference Ross and Robertson1990). Nevertheless, some studies did not demonstrate considerable changes in the level of FA caused by environmental stress (e.g., nutritional stress, Vijendravarma et al., Reference Vijendravarma, Narasimha and Kawecki2011; crowding, Chapman & Goulson, Reference Chapman and Goulson2000; temperature, Jones et al., Reference Jones, Helliwell, Beekman, Maleszka and Oldroyd2005) or genetic stress (e.g., inbreeding, Clarke et al., Reference Clarke, Brand and Whitten1986; Fowler & Whitlock, Reference Fowler and Whitlock1994; Carter et al., Reference Carter, Weier and Houle2009; hybridization, Smith et al., Reference Smith, Crespi and Bookstein1997). These differences may result from the fact that the impact of stress on FA seems to be species-, trait- or stressor-specific (Bjorksten et al., Reference Bjorksten, Fowler and Pomiankowski2000; Beasley et al., Reference Beasley, Bonisoli-Alquati and Mousseau2013). Additionally, Babbitt et al. (Reference Babbitt, Kiltie and Bolker2006) suggested that the conflicting results of FA studies may also be a consequence of their undersampling.
Another measure of the level of DI is the frequency of phenodeviants. A phenodeviant is a phenotype different from the average phenotype occurring at low frequency in the population (Rasmuson, Reference Rasmuson1960; Møller & Swaddle, Reference Møller and Swaddle1997). In insects, an example of phenodeviance can be the unusual pattern of wing venation such as protrusions, incomplete wing veins, extra or missing veins (Akahira & Sakagami, Reference Akahira and Sakagami1959; Smith et al., Reference Smith, Crespi and Bookstein1997; Zhou et al., Reference Zhou and Zhu2009). Like asymmetry, phenodeviance is assumed to be a product of random accidents during the development of a particular trait (Rasmuson, Reference Rasmuson1960). Both genetic and environmental factors can be responsible for those phenotypic abnormalities (e.g., hybridization, Ross & Robertson, Reference Ross and Robertson1990; Smith et al., Reference Smith, Crespi and Bookstein1997; inbreeding, Rasmuson, Reference Rasmuson1960; temperature, Zhou et al., Reference Zhou and Zhu2009; pollution, Graham et al., Reference Graham, Freeman, Emlen, Landis, Hughes and Lewis1993). Because phenodeviants have negligible heritability, they are not a result of genetic polymorphisms (Møller & Swaddle, Reference Møller and Swaddle1997; Graham et al., Reference Graham, Fletcher, Tigue and McDonald2000). Nevertheless, in some cases abnormalities can be inherited traits which occur even in optimal environmental conditions, and are therefore independent of developmental stability (DS). For example, it was shown that an unusual venation of honey bee wings occurred in all species of the genus Apis s. str. and was recognized as a reacquisition of a vein (Tan et al., Reference Tan, Fuchs and Engel2008). However, in other study the same unusual venation has also been considered an abnormality and used to assess DI (Smith et al., Reference Smith, Crespi and Bookstein1997).
Assuming that phenodeviance is a good indicator of DI, phenodeviants should be more asymmetrical in comparison with typical individuals. This prediction was confirmed in a few studies in insects demonstrating a higher level of FA in phenodeviants than in non-phenodeviants (Groenendijk et al., Reference Groenendijk, Zeinstra and Postma1998; Babbitt et al., Reference Babbitt, Kiltie and Bolker2006; Polak & Taylor, Reference Polak and Taylor2007). However, there is a range of phenotypes which differ from the average phenotype to a greater or lesser degree. In honey bees, variation is particularly large in drones (Casteel & Phillips, Reference Casteel and Phillips1903; Brückner, Reference Brückner1976). Thus, the increased asymmetry should be present not only in individuals with extreme deviations from the average phenotype but also in intermediate cases.
In insects, the pattern of wing venation is commonly used to measure FA and phenotypic abnormalities (Clarke et al., Reference Clarke, Brand and Whitten1986; Ross & Robertson, Reference Ross and Robertson1990; Smith et al., Reference Smith, Crespi and Bookstein1997; Mazeed, Reference Mazeed2011) because wing venation has been shown to be a sensitive trait (Zhou et al., Reference Zhou and Zhu2009). Therefore, in this study, asymmetry (FA and DA) was also evaluated based on forewing venation in queens, workers and drones of honey bees (Apis mellifera) categorized as normal individuals (without abnormalities) and phenodeviants with minor or major abnormalities. The aim of the study was to compare the level of asymmetry and body size between normal individuals and phenodeviants as well as between phenodeviants with minor or major abnormalities based on both geometric and traditional morphometrics analyses.
Materials and methods
Samples
The analysed samples of honey bees (A. mellifera) included: 466 queens, 765 workers and 617 drones. The queens were obtained from one queen breeder (Jerzy Kubeczek) and were produced in years 2004–2007. They represented Beskidka breeding line which is Apis m. carnica. The breeding apiary was free of any diseases because it was under control of governmental breeding program. The workers were collected from 86 colonies located in two apiaries in 2012. They were A. m. carnica, Apis m. mellifera or hybrids of the two subspecies. The drones were collected from nine colonies in another apiary where A. m. carnica was only bred in 2013 and 2014. The colonies from which workers and drones were collected did not show any symptoms of diseases and were kept in Wielkopolski hives commonly used in Poland. The queens, workers and drones derived from various sources what facilitated to collect a bigger number of individuals and to assess wing asymmetry as well as the abnormalities in the wing venation pattern.
The queens and the drones were frozen and stored at −20°C whereas the workers were preserved in concentrated ethanol. Forewings were removed from each individual and mounted on glass photographic slide frames using a small amount of concentrated ethanol to prevent any movement. The image of each wing was obtained using the photographic scanner Nikon Coolscan 5000 ED. The image resolution was 2400 dpi. All damaged specimens were excluded from further analysis.
Geometric morphometrics analysis
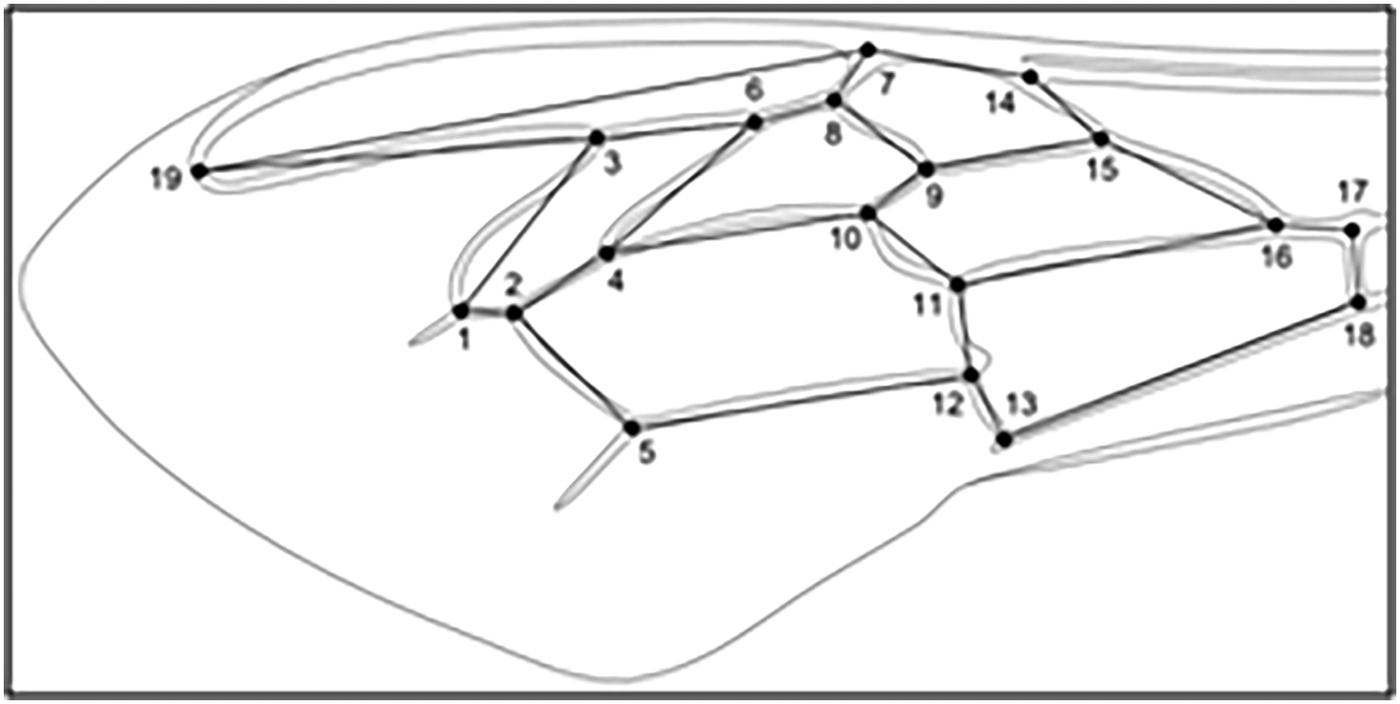
Wing size and shape asymmetry were analysed using geometric morphometrics based on landmarks. A set of 19 landmarks positioned at veins junctions were collected from all images of wings (fig. 1) using DrawWing (Tofilski, Reference Tofilski2014). The right wings were mirrored in order to be comparable with the left wings. Each wing was measured automatically three times. These three measurements were independent from each other and were used as replications in order to estimate and reduce the possible effects of measurement error (ME). The landmark configurations were aligned using Generalized Procrustes Analysis (Rohlf & Slice, Reference Rohlf and Slice1990). They were scaled to unite centroid size (CS), superimposed and rotated to achieve an optimal fit. The wing asymmetry was analysed using Klingenberg & McIntyre's method (1998) in MorphoJ software (Klingenberg, Reference Klingenberg2011).
The location of landmarks used in geometric morphometric analysis of forewing venation in honey bees.

Shape asymmetry was analysed using two measures: Procrustes distance and Mahalanobis distance. Procrustes distance is a measure of absolute shape differences, whereas Mahalanobis distance measures differences between groups relative to the within-group variation (Klingenberg & Monteiro, Reference Klingenberg and Monteiro2005; Zeldich et al., Reference Zeldich, Swiderski and Sheets2012). On the basis of Procrustes distance and Mahalanobis distance, FA shape scores were calculated to quantify the amount of FA for each individual. Because the two shape FA measures were highly correlated with each other (N = 466, r = 0.74, P = 0.000 for queens, N = 765, r = 0.66, P = 0.000 for workers, and N = 617, r s = 0.75, P = 0.000 for drones), they could be considered as equivalents, and further analyses were limited to the FA shape score based on Procrustes distance which is defined as the square root of the sum of the squared distances between the corresponding landmarks (Zeldich et al., Reference Zeldich, Swiderski and Sheets2012). CS was used as a size estimator which is defined as the square root of the sum of squared distance between each landmark and the centroid (i.e., the centre of the form; Zeldich et al., Reference Zeldich, Swiderski and Sheets2012). CS asymmetry was calculated as the absolute difference between the CS of the left and the right wing.
Traditional morphometrics analysis
Wing asymmetry was also analysed using traditional morphometrics. The coordinates of 19 landmarks were converted to 25 distances along wing veins (fig. 1). FA2 index (Palmer, Reference Palmer and Markow1994) was used as a measure of asymmetry because it is independent of size. It was calculated for each distance as the absolute difference between the right and left side divided by the mean value of the right and left sides.
Abnormalities in the pattern of wing venation
In order to assess whether phenodeviants show a higher level of FA than normal individuals, and the amount of FA depends on the degree of phenodeviance, all pairs of forewings were analysed to identify any abnormalities in the pattern of wing venation such as: protrusions, incomplete wing veins, extra or missing veins. Phenodeviants were defined as individuals demonstrating any abnormalities of wing venation. According to presence or absence, as well as the degree of phenodeviance, three categories were formed: normal individuals without any abnormalities, minor phenodeviants with small abnormalities and major phenodeviants with large abnormalities. Minor abnormalities in wing venation usually included protrusions, whereas major abnormalities included incomplete wing veins and extra or missing veins. Additionally, the frequency of individuals which had one wing without any abnormalities and the other one with abnormalities was assessed. The frequency of individuals with abnormalities on the right or left wing was also estimated.
Statistical analysis
Data were examined to detect any possible outliers (i.e., specimens strongly deviated from the average) which were excluded from further analyses. Additionally, data distribution was checked for antisymmetry. Subsequently, Procrustes analysis of variance (ANOVA) was conducted to assess the contribution of individual variation, FA, DA and ME to the overall variation in wings (Klingenberg, Reference Klingenberg2011). In this model, the effect called individuals was a random factor that assessed variation among individuals and the effect called sides referred to a fixed factor that evaluated DA. The individuals by sides interaction was a mixed effect assessing FA, whereas the error term evaluated ME (Klingenberg & McIntyre, Reference Klingenberg and McIntyre1998; Klingenberg, Reference Klingenberg2011). An additional main effect called category was a fixed factor that assessed variation among individuals in terms of wing venation abnormalities.
Individual data for CS and CS FA as well as Procrustes FA score were used in further analyses to compare individuals with or without abnormalities in wing venation as well as the relationships between analysed measures. All data were checked for deviation from normality. In case of a lack of normal distribution the analysed data were ln-transformed. When deviation from normal distribution was large, nonparametric tests were used. One-way ANOVA or nonparametric Kruskal–Wallis ANOVA were conducted to evaluate differences among categories of individuals, whereas repeated measure ANOVA was performed to assess differences among categories and between sides of the body. Levene's test was used to assess the homogeneity of variances. If needed, post hoc tests were conducted for pairwise comparisons; an unequal honest significant difference (HSD) test was used after parametric ANOVAs, whereas Dunn's test was performed after nonparametric ANOVA. Additionally, Pearson correlation or nonparametric Spearman rank correlation were conducted to assess the strength of the associations between the analysed data. Frequencies of individuals in categories were compared using G test or χ2 test. Differences in the level of asymmetry between veins with abnormalities and without abnormalities were assessed using Wilcoxon test. Because queens, workers and drones derived from various sources, and a part of the data was not normally distributed, the statistical analyses were performed separately for them. All morphometric and statistical analyses were performed using MorphoJ, version 1.06c (Klingenberg, Reference Klingenberg2011) and Statistica, version 10.0 (Statsoft Inc., 2011).
Results
Abnormalities in the pattern of wing venation
Abnormalities were observed in the following veins: 1–3, 2–4, 2–5, 3–6, 3–19, 4–6, 4–10, 7–19, 8–9, 9–10, 9–15, 10–11, 11–12, 11–16, 12–13 (fig. 1). The remaining veins did not have any abnormalities. Abnormalities were found in ten veins in queens, eight veins in workers, and 15 veins in drones. All castes had abnormalities in veins: 1–3, 2–4, 4–6, 4–10, 10–11, 11–12, 12–13.
Proportion of phenodeviants
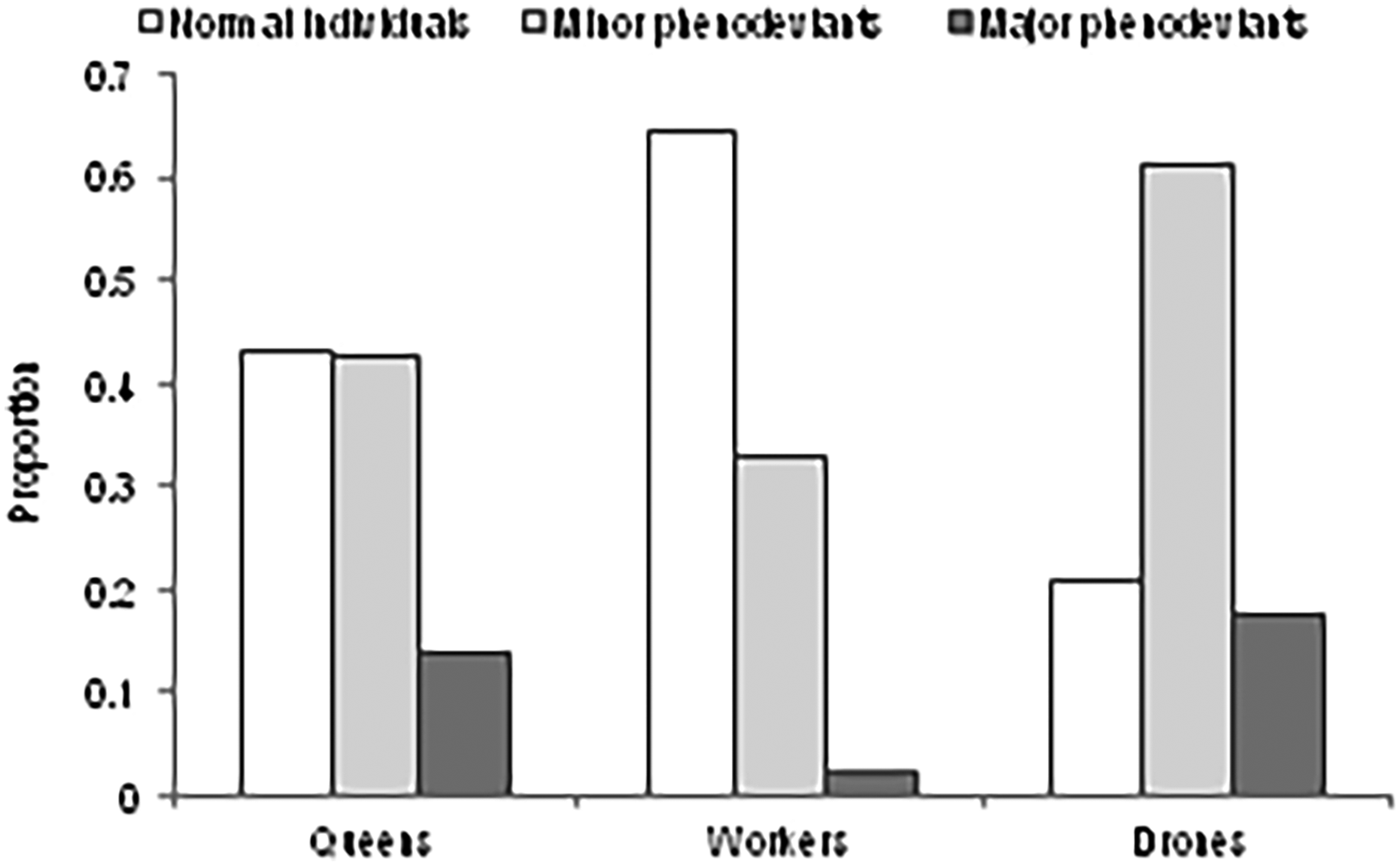
The analysed samples of queens, workers and drones were divided into three categories: normal individuals (43.3, 64.7 and 20.7%), minor phenodeviants (42.7, 33.1 and 61.4%) and major phenodeviants (13.9, 2.2 and 17.8%). Proportions of phenodeviants significantly differed among castes (G test: G = 323.93, df = 4, P = 0.000), occurring most often in drones and least often in workers (fig. 2). There were also significant differences among castes in the proportion of minor compared with major phenodeviants (G test: G = 44.82, df = 2, P = 0.000), as castes having a high proportion of phenodeviants also had a higher proportion of major to minor phenodeviants. Moreover, the presence of abnormalities on one or both wings differed significantly among castes (G test: G = 17.38, df = 2, P = 0.000). In the case of major abnormalities, the difference among castes was greater (G test: G = 19.72, df = 2, P = 0.000) than in the case of minor abnormalities (G test: G = 6.45, df = 2, P = 0.040). Abnormalities occurred more often on one wing than on both wings in workers (52.2 vs. 47.8%), whereas the opposite was true for queens (48.9 vs. 51.1%) and drones (37.8 vs. 62.2%). Additionally, significantly fewer minor phenodeviants had abnormal venation only in one wing compared with major phenodeviants in workers (50.6 vs. 76.5%; test χ2: χ2 = 4.28, P = 0.039), but the opposite was true for drones (41.4 vs. 25.5%; test χ2: χ2 = 9.25, P = 0.002). There were no significant differences in queens (49.7 vs. 46.2%; test χ2: χ2 = 0.25, P = 0.615). The proportion of both minor and major abnormalities only on the right or left wing was similar among castes (test G: G = 0.81, df = 2, P = 0.666) as abnormalities on the right wing were observed in 47.7% of queens, 42.6% of workers and 46.5% of drones.
The proportion of normal individuals and minor or major phenodeviants among honey bee queens, workers and drones.
Geometric morphometric analysis
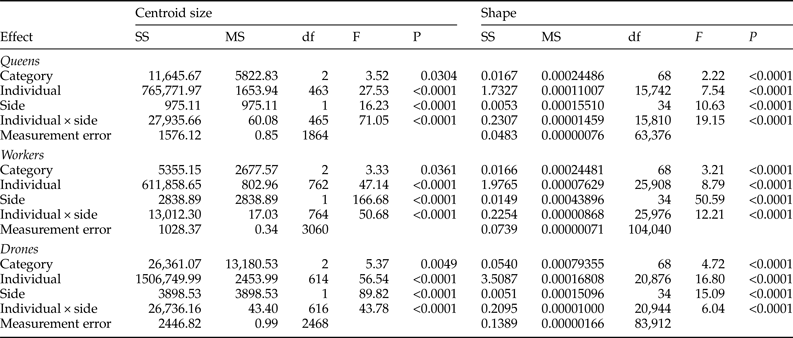
The results of Procrustes ANOVA on wing size and shape for all castes were summarized in table 1. The ANOVA showed statistically significant individual variation both in shape and size of wings (P < 0.0001). There were also significant differences between sides which meant that left and right wings were markedly different in shape and size (P < 0.0001). Since the effect called sides in the Procrustes ANOVA was a measure of DA, the results indicated the considerable contribution of DA to the overall variation. The interaction between individuals and sides evaluated the amount of FA and was also statistically significant both in wing shape and size (P < 0.0001). Since the mean squares were much higher for individual variation, DA and FA than for ME, the contribution of ME to the overall variation both in shape and size of wings was negligible. Additionally, there were significant differences among categories in wing shape (P < 0.0001) and size (P = 0.030 for queens, P = 0.0361 for workers and P = 0.005 for drones). Visual analysis of data distribution demonstrated a lack of significant antisymmetry.
The Procrustes ANOVA of CS and shape of forewings for honey bee queens, workers and drones.
SS, sum of squares; MS, mean squares; df, degree of freedom.
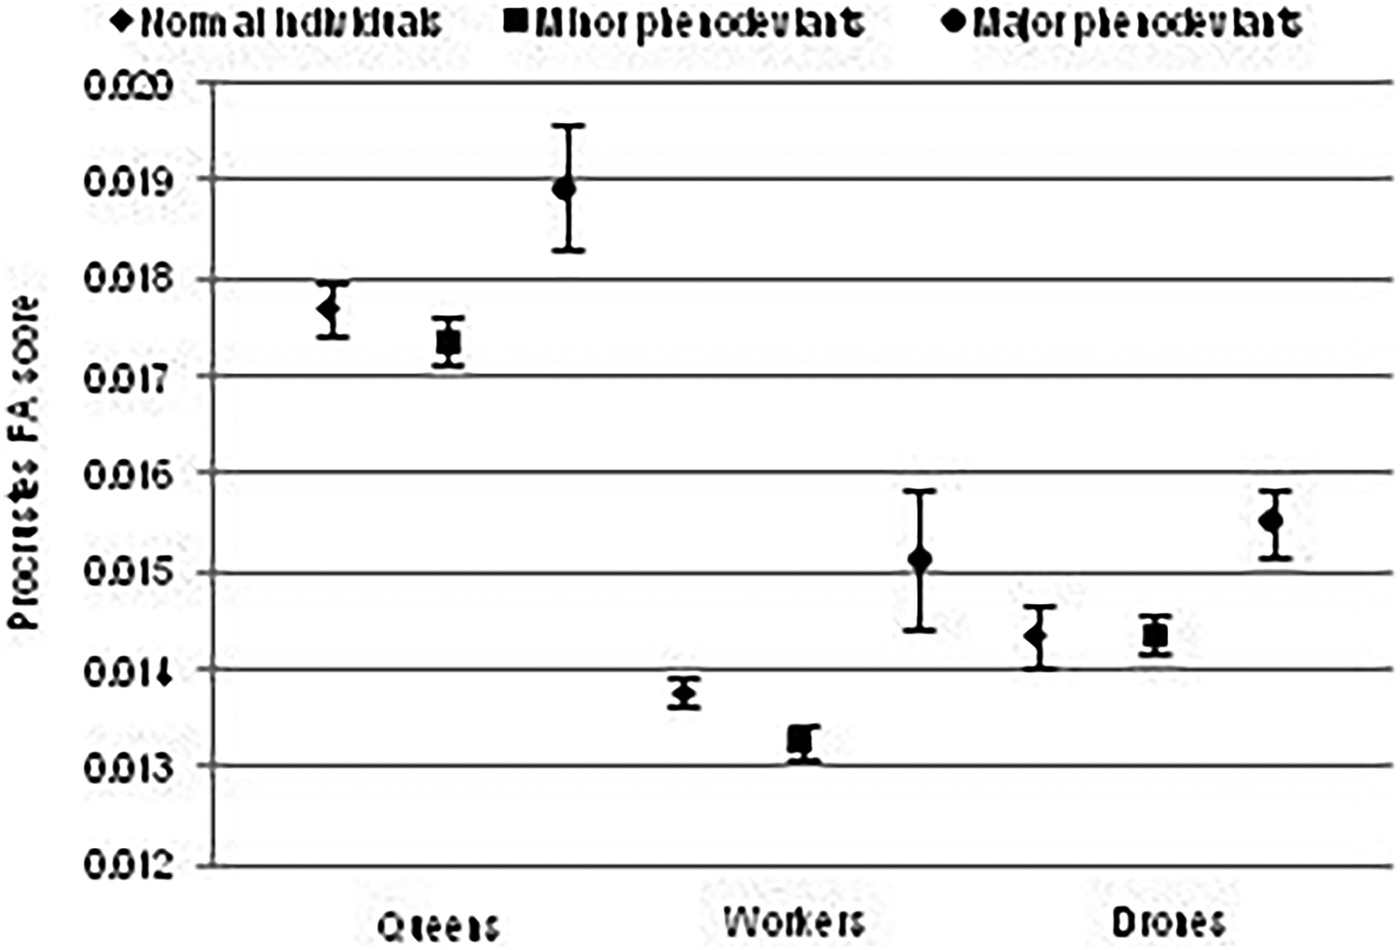
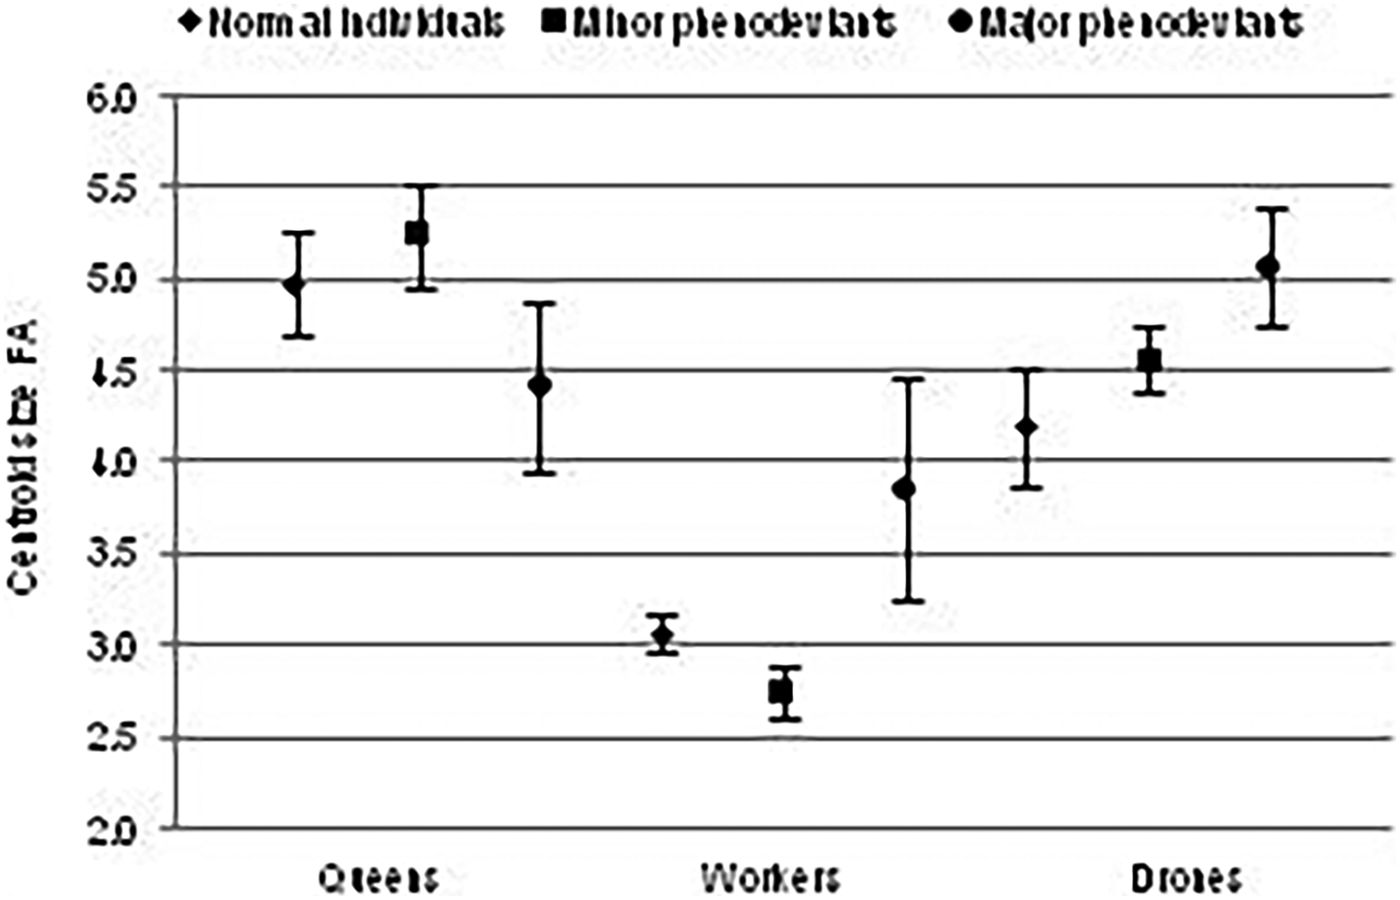
For shape FA, there were significant differences among categories in Procrustes FA score in workers and drones (one-way ANOVA: F2,762 = 3.99, P = 0.019 and F2,614 = 5.30, P = 0.005, respectively), but not in queens (Kruskal–Wallis ANOVA: H(2, 466) = 3.68, P = 0.158; fig. 3). As expected, the Procrustes FA score was significantly lower in normal individuals compared with major phenodeviants (post hoc test: P = 0.029), as well as in minor phenodeviants compared with major phenodeviants (post hoc test: P = 0.031) in drones. For workers, the post hoc test did not show significant differences between these categories (post hoc tests: P = 0.397 and P = 0.191, respectively). Moreover, there were insignificant differences in FA shape between normal individuals and minor phenodeviants in workers and drones (post hoc tests: P = 0.201 and P = 1.000, respectively). For FA size, there were significant differences in CS FA among categories in workers and drones (Kruskal–Wallis ANOVA: H(2, 765) = 9.16, P = 0.010 and H(2, 617) = 6.49, P = 0.039, respectively), but not in queens (Kruskal–Wallis ANOVA: H(2, 466) = 2.14, P = 0.343; fig. 4). As expected, FA size was significantly lower in normal individuals compared with major phenodeviants in drones (post hoc test: P = 0.034). Surprisingly, FA size was significantly higher in normal individuals compared with minor phenodeviants in workers (post hoc test: P = 0.030). The remaining comparisons were insignificant. Correlations between Procrustes FA score and CS FA were insignificant for queens and workers (r s = 0.04, P = 0.360 and r s = 0.052, P = 0.147, respectively), but it was significant for drones (r s = 0.08, P = 0.039) indicating that individuals more asymmetric in shape were also more asymmetric in size. The lack of significant correlations in two castes suggests that FA shape and FA size were largely independent.
FA shape (mean ± SE) of normal individuals and minor or major phenodeviants among honey bee queens, workers and drones.
FA size (mean ± SE) of normal individuals and minor or major phenodeviants among honey bee queens, workers and drones.
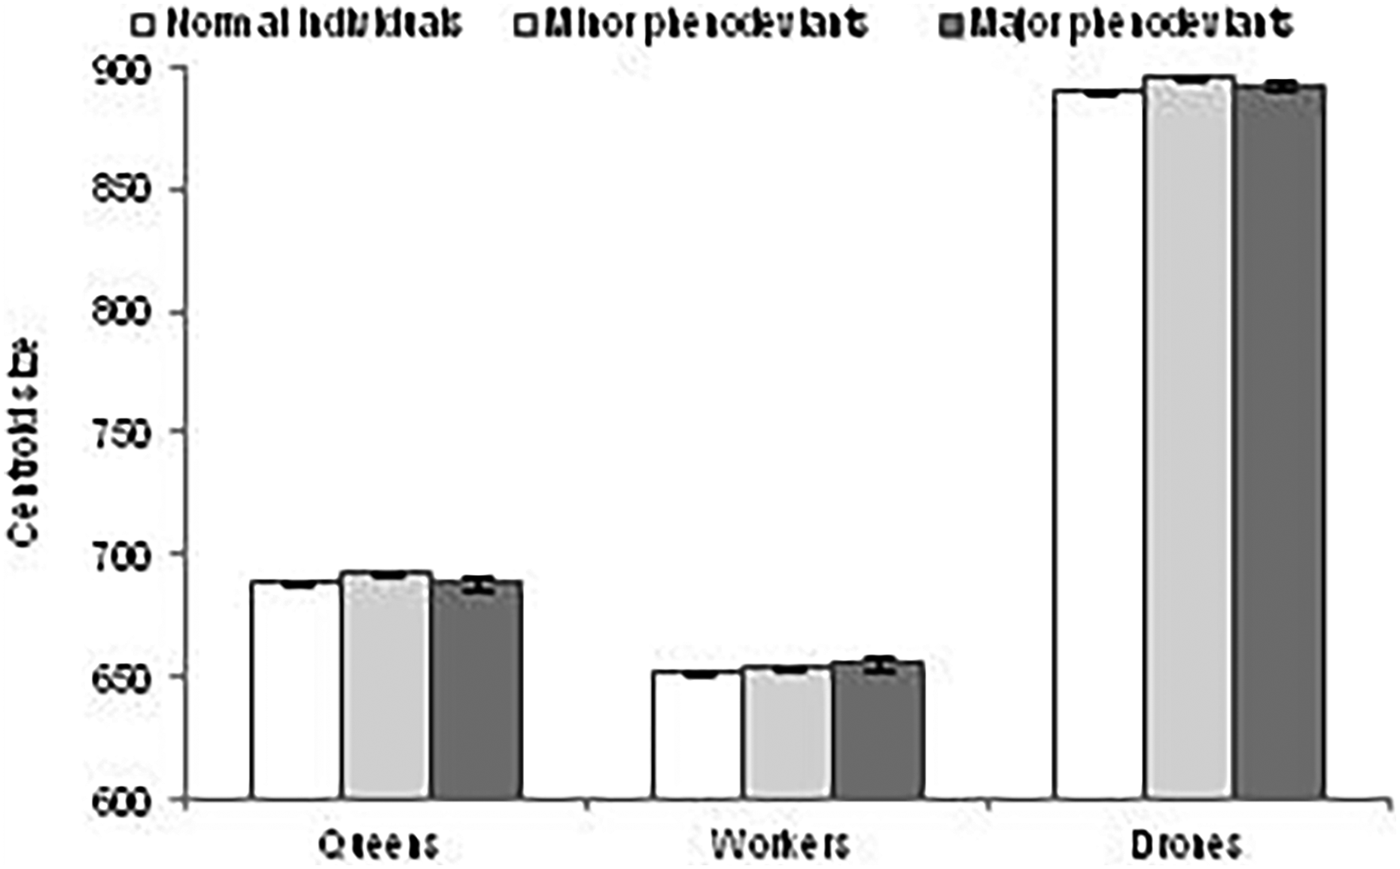
For all castes, the right wings were consistently bigger than the left ones (repeated measures ANOVA: F 1,463 = 13.00, P = 0.000 for queens; F 1,762 = 22.00, P = 0.000 for workers; F 1,614 = 70.00, P = 0.000 for drones). There were also significant differences in CS among categories for all castes (repeated measures ANOVA: F 2,463 = 4.00, P = 0.031 for queens; F 2,762 = 3.00, P = 0.036 for workers; F 2,614 = 5.00, P = 0.005 for drones; fig. 5). Surprisingly, the smallest were normal individuals in workers as well as normal individuals and major phenodeviants in queens and drones. Normal individuals were significantly smaller than minor phenodeviants in queens and drones (post hoc tests: P = 0.027 and P = 0.034, respectively). The remaining comparisons were insignificant.
The CS (mean ± SE) of normal individuals and minor or major phenodeviants among honey bee queens, workers and drones.
Moreover, there was a relationship between the wing size and presence of phenodeviants. A significant negative correlation was found between CS and CS FA for queens (r s = −0.09, P = 0.044) indicating that smaller individuals were more asymmetrical. However, there were no significant correlations between CS and CS FA for workers (r s = −0.003, P = 0.936) and drones (r s = −0.06, P = 0.111). Regarding the association between CS and FA shape, there was a significant negative correlation between CS and Procrustes FA score in queens (r = −0.19, P = 0.000) and drones (r s = −0.09, P = 0.019), and marginally insignificant correlation in workers (r = −0.069, P = 0.058), confirming previous findings that smaller individuals were more asymmetrical.
Traditional morphometric analysis
Measures of 25 distances between landmarks (fig. 1) were used to assess the amount of FA and DA in different parts of wings as well as between the left and right sides. Traditional morphometric analysis demonstrated that ten distances in queens (3–19, 7–8, 7–14, 8–9, 10–11, 11–16, 12–13, 15–16, 16–17, 17–18), as well as nine distances in workers (3–19, 5–12, 7–8, 7–14, 8–9, 10–11, 11–16, 12–13, 16–17) and drones (2–5, 3–6, 3–19, 5–12, 7–8, 7–19, 8–9, 10–11, 11–12) showed a significant level of DA after Bonferroni correction (P < 0.002). In case of distances such as 7–8, 11–12, 12–13 and 16–17, the left vein was longer, whereas the other distances were longer in the right wing. Longer left veins were localized in the proximal part of the wing, but longer right veins were distributed on the whole wing. It is also worth noting that distances such as 1–3, 2–4, 4–6, 4–10, 9–10, 9–15 and 13–18 did not indicate DA in any of the castes, whereas distances 3–19, 5–12, 7–8, 8–9, 10–11, 16–17 and 17–18 constantly showed a significant amount of DA. This finding suggests that some parts of the wing remain conservative, but others are more variable.
These distances with significant DA were excluded from the comparison of FA, calculated as the FA2 index, among categories. There were significant differences in the level of FA among categories in the case of three distances: one in queens (2–4) and two in drones (4–10 and 12–13) in the middle part of the wing. All distances had some abnormalities. Interestingly, two distances which constantly showed an insignificant level of DA in all castes (2–4 and 4–10), also showed a significant level of FA. However, after Bonferroni correction, the difference in FA remained significant only in one distance in drones (Kruskal–Wallis ANOVA: H(2, 617) = 13.61, P = 0.001); major phenodeviants were more asymmetric than minor phenodeviants in the case of distance 4–10 (post hoc test: P = 0.001) showing higher values of FA2 index. Thus, different parts of the wing varied among each other, indicating that they are not susceptible to disturbances at the same level.
As expected, a significantly higher level of asymmetry was found in veins with abnormalities compared with veins without abnormalities in phenodeviant queens and drones (Wilcoxon test: Z = 4.31, P = 0.000 and Z = 5.24, P = 0.000, respectively). In phenodeviant workers, the level of asymmetry was comparable between veins with abnormalities and veins without abnormalities (Wilcoxon test: Z = 1.30, P = 0.194); however, in this caste only eight veins out of 25 had any abnormalities.
Discussion
The results presented here demonstrate a significant level of FA, DA and individual variation in forewing size and shape of honey bees categorized as normal individuals or phenodeviants with minor or major abnormalities in wing venation pattern.
Fluctuating asymmetry
Geometric morphometric analysis showed a considerable level of FA, both in the shape and size of honey bee forewings. As predicted, the highest amount of FA in wing shape was detected in major phenodeviants compared with normal individuals and minor phenodeviants. In insects, a few studies showed greater FA in phenodeviants compared with normal individuals (Rasmuson, Reference Rasmuson1960; Groenendijk et al., Reference Groenendijk, Zeinstra and Postma1998; Babbitt et al., Reference Babbitt, Kiltie and Bolker2006; Polak and Taylor, Reference Polak and Taylor2007). However, this study, for the first time, demonstrated that the amount of FA was similar between normal individuals and minor phenodeviants. Thus, minor phenodeviance do not have to be associated with a higher level of FA.
Regarding the level of FA in wing size, all categories were comparable in queens, whereas normal individuals were more asymmetrical than minor phenodeviant workers and less asymmetrical than major phenodeviant drones. These results suggest that wing size response to developmental disturbances is irrespective of wing shape and that there is only a weak developmental connection between shape and size of wings in insects. The results are also consistent with findings that suggest that wing shape and size are under independent genetic control (Bitner-Mathé & Klaczko, Reference Bitner-Mathé and Klaczko1999). Moreover, it has been shown that the level of FA in one trait rarely correlates with the level of FA in others (Clarke, Reference Clarke1998a; Graham et al., Reference Graham, Raz, Hel-Or and Nevo2010). Thus, an individual that is more asymmetrical for one trait does not have to be more asymmetrical for another traits (Clarke, Reference Clarke1998a). A lack of strong correlation between FA shape and FA size of wings in this study as well as in other studies (Ludoški et al., Reference Ludoški, Djurakic, Ståhls and Milankov2012, Reference Ludoški, Djurakic, Pastor, Martinéz-Sánchez, Rojo and Milankov2014) also confirms these conclusions. However, significant positive correlations found between FA shape and FA size in some insects, suggest at least a weak developmental connection (Breuker et al., Reference Breuker, Patterson and Klingenberg2006; Ludoški et al., Reference Ludoški, Djurakic, Ståhls and Milankov2012, Reference Ludoški, Djurakic, Pastor, Martinéz-Sánchez, Rojo and Milankov2014).
Traditional morphometric analysis confirmed that normal individuals and minor phenodeviants differed from major phenodeviants in the amount of FA, measured as the FA2 index, in the case of a few wing veins in queens and drones, but not in workers. In line with our earlier results, normal individuals and minor phenodeviants were less asymmetrical than major phenodeviants. As expected, all these veins with a considerable level of FA had some abnormalities. It supports the prediction that the presence of abnormalities on wing veins is connected with a higher level of asymmetry. It also indicates that various parts of the wing may respond in a diverse way to perturbations occurring during development which may reflect their differential sensitivity to disturbances. For instance, a base part of the house fly (Musca domestica) wing was more variable than other parts (Ludoški et al., Reference Ludoški, Djurakic, Pastor, Martinéz-Sánchez, Rojo and Milankov2014). Moreover, veins with abnormalities were more asymmetrical compared with those without abnormalities in queens and drones.
DA and size
Geometric morphometric analysis demonstrated a considerable difference between the left and right wing, indicating the presence of DA. Similar results were found in honey bees in other studies (Smith et al., Reference Smith, Crespi and Bookstein1997; Schneider et al., Reference Schneider, Leamy, Lewis and DeGrandi-Hoffman2003). In all studies the right wing was larger than the left one. However, DA was not always found in honey bees (Clarke & Oldroyd, Reference Clarke and Oldroyd1996; Jones et al., Reference Jones, Helliwell, Beekman, Maleszka and Oldroyd2005; Abaga et al., Reference Abaga, Alibert, Dousset, Savadogo, Savadogo and Sedogo2011). Traditional morphometric analysis confirmed that some veins showed a significant level of DA. Some parts of wings appeared to be conservative and stable, whereas others seemed to be more variable, as a few veins did not indicate DA across all castes, whereas a few others constantly showed DA. Interestingly, a few veins constantly showing a negligible level of DA in all castes, simultaneously demonstrated a marked amount of FA. These results are consistent with the finding that DA in shape and size is widespread in insect wings; however, it is very small in magnitude and estimated to be 0.7% of the wing size on average (Pélabon & Hansen, Reference Pélabon and Hansen2008).
Contrary to expectations, normal individuals had smaller wings than minor phenodeviants and a comparable size of wings to major phenodeviants. However, the relationship between wing size and FA size or FA shape was negative, indicating that smaller individuals were more asymmetrical. In another study, smaller honey bee queens were also more asymmetrical than larger ones (Tofilski & Czekońska, Reference Tofilski and Czekońska2014). In general, the relationship between size and asymmetry is ambiguous in insects. In the midge (Chironomus plumosus) and damselfly (Lestes viridis) smaller males were more symmetrical (McLachlan & Cant, Reference McLachlan and Cant1995; De Block & Stoks, Reference De Block and Stoks2007), whereas no correlation was observed between size and FA in two species of Euglossine bees (Eulaema nigrita and Euglossa pleosticta) (Silva et al., Reference Silva, Lomônaco, Augusto and Kerr2009), between size and FA shape in the house fly (Ludoški et al., Reference Ludoški, Djurakic, Pastor, Martinéz-Sánchez, Rojo and Milankov2014), as well as between FA size and shape in the fruit fly (Drosophila melanogaster) (Breuker et al., Reference Breuker, Patterson and Klingenberg2006). Body size, which is highly correlated with wing size in insects (Clarke & Oldroyd, Reference Clarke and Oldroyd1996), has low heritability. This means that it is influenced by many environmental conditions, which may cause substantial variability (Bitner-Mathé & Klaczko, Reference Bitner-Mathé and Klaczko1999).
The frequency of phenodeviants
Wing venation pattern is generally stable in honey bees, but some minor variations exist among individuals (Akahira & Sakagami, Reference Akahira and Sakagami1959). As expected, individuals without abnormalities in wing venation were the most numerous group in workers and queens, but not in drones. Distinct proportions of phenodeviants among castes may have resulted from different selection pressures on DS, because queens, workers and drones play various roles in a colony and this is reflected in their many morphological, physiological and behavioural differences (Hrassnigg & Crailsheim, Reference Hrassnigg and Crailsheim2005), as well as from different rearing conditions which could be responsible for the large variability in wing venation among castes. The lowest proportion of phenodeviants in workers was likely to be associated with their work as foragers, which involves spending a lot of time in flight covering foraging distances and therefore they have to fly efficiently (Abou-Shaara, Reference Abou-Shaara2014). The higher proportion of phenodeviants among queens compared with workers might be due to the weaker selection pressure on their flight abilities as honey bee queens do not fly a lot. They perform only a few mating flights early in life and later during swarming when weather conditions are good (Schlüns et al., Reference Schlüns, Moritz, Neumann, Kryger and Koeniger2005; Koeniger and Koeniger, Reference Koeniger and Koeniger2007; Heidinger et al., Reference Heidinger, Meixner, Berg and Büchler2014). Rearing conditions could also be responsible for the higher proportion of phenodeviants in queens produced by queen breeding, and many environmental and genetic factors could cause substantial variation among them (Kruk & Skowronek, Reference Kruk and Skowronek2002; Mahbobi et al., Reference Mahbobi, Farshineh-Adl, Woyke and Abbasi2012; Kamel et al., Reference Kamel, Osman, Mahmoud, Mohamed and Abd Allah2013). The highest proportion of phenodeviants in drones was found despite selection pressure on their flight abilities which should be strong as the single task of drones is mating which entails good flight skills as mating occurs in flight at drone congregation areas (Ruttner & Ruttner, Reference Ruttner and Ruttner1972; Koeniger et al., Reference Koeniger, Koeniger, Gries and Tingek2005). It was also shown that drones were superior to workers or queens in some aspects of flight performance (Coelho, Reference Coelho1996). The high proportion of drones with abnormalities is consistent with the results of other studies showing that haploid drones were more variable than diploid queens or workers (Casteel & Phillips, Reference Casteel and Phillips1903; Akahira & Sakagami, Reference Akahira and Sakagami1959; Owen, Reference Owen1989; Smith et al., Reference Smith, Crespi and Bookstein1997). For instance, Smith et al. (Reference Smith, Crespi and Bookstein1997) showed that the mean number of wing venation abnormalities per individual was almost three times higher in drones compared with workers. Moreover, most major phenodeviants in drones had abnormalities on both wings contrary to workers which had an abnormal venation usually on one wing.
Overall, an abnormal venation was present only in one wing in approximately half of phenodeviants (44%) which was a slightly lower proportion compared with the results of the study of Akahira & Sakagami (Reference Akahira and Sakagami1959) where the proportion of individuals with abnormalities in one wing was 54% in A. mellifera and Apis cerana. Moreover, minor abnormalities in wing venation such as protrusions occurred surprisingly often (33–61% individuals), whereas major abnormalities, including incomplete wing veins, extra or missing veins were rare (2–18% individuals). Węgrzynowicz et al. (Reference Węgrzynowicz, Gerula, Panasiuk and Bieńkowska2009) detected 30% of honey bee (A. mellifera) samples with some abnormalities in wing venation. These discrepancies may result from different assumptions about the difference between normal and abnormal wing venation. There was also no reference as to whether all castes were included. In turn, Tan et al. (Reference Tan, Fuchs and Engel2008) reported the frequency of adventitious vein termed αRS2 in honey bee workers (A. mellifera) in the range of 1.67–31.67%. The usefulness of the frequency of phenodeviants as a measure of DI was questioned as, by definition, phenodeviants occur at a relatively low frequency in the population. For that reason, the frequency of phenodeviants in comparison with FA may be a less sensitive measure of DI (Møller & Swaddle, Reference Møller and Swaddle1997). Undoubtedly, it is true for major phenodeviants which are rare in populations. Nevertheless, most populations contain a variety of minor phenodeviants, which are more common and thus they should be more useful for measuring DI. Contrary to expectations, minor phenodeviants were not always intermediate between normal individuals and major phenodeviants as they were comparable with normal individuals in the case of FA shape. Because of the high number of minor and major phenodeviants, their frequency may be a useful measure of DI. However, an estimation of FA seems to be a much more accurate and reliable measure, especially so in that asymmetry and abnormalities appear to be independent phenomena as they responded differentially to inbreeding in honey bee workers (Brückner, Reference Brückner1976). A similar conclusion was drawn by Smith et al. (Reference Smith, Crespi and Bookstein1997) in response to a lack of correlation between them for both workers and drones. These findings confirm that asymmetry and abnormalities may reflect DI to a varying extent.
Herein, we can only presume what factors (environmental or genetic) were responsible for abnormalities appearing in the pattern of wing venation, as this study was not designed to examine it. The presence of some extra veins with relatively high frequency and constancy of the positions where abnormalities appear in several species of the genus Apis s. str. indicate that it is not a case of teratology, but it may represent a reacquisition of long suppressed veins (Akahira & Sakagami, Reference Akahira and Sakagami1959; Tan et al., Reference Tan, Fuchs and Engel2008). Thus, the genes of these veins still existed, but could not be expressed under normal conditions. This explanation seems to be likely because wing venation has been shown to be sensitive and influenced by environmental conditions such as developmental temperature (Zhou et al., Reference Zhou and Zhu2009). For instance, the adventitious vein termed αRS2 was very frequent (40–60%) in the northern part of the A. cerana range where the climate was colder (Tan et al., Reference Tan, Fuchs and Engel2008), and honey bee workers reared in mating nuclei had more abnormalities than those reared in full size colonies as they were probably exposed to greater temperature fluctuations (Porporato et al., Reference Porporato, Laurino, Balzola and Manino2014). Likewise, a surprisingly high proportion of phenodeviant queens in this study could be explained by rearing conditions. The high proportion of major phenodeviants in castes with a high proportion of minor phenodeviants also indicates that these two groups were affected by related factors. Thus, both environmental and genetic factors were likely to participate in the forming of abnormal venation. In honey bees, the proportion of individuals with venation abnormalities is high which may be caused by environmental factors related to beekeeping practices like moving frames, the transport of hives and use of drugs to prevent diseases. It is also possible that the presence of phenodeviants is related to genetic factors: either inbreeding or hybridisation between subspecies (Schiff & Sheppard, Reference Schiff and Sheppard1996).
FA and the frequency of phenodeviants among castes
The results presented here demonstrated that drones were more variable than queens and workers which was clear in the higher proportion of phenodeviants, especially those with major abnormalities in wing venation. The high proportion of phenodeviants found in queens compared with workers and drones could be caused by rearing conditions. In other studies, drones also showed more variability than queens and workers. Drones were more asymmetrical than queens in red-belted bumble bee (Bombus rufocinctus) (Owen Reference Owen1989) and workers in honey bees (Brückner, Reference Brückner1976; Clarke et al., Reference Clarke, Brand and Whitten1986, Reference Clarke, Oldroyd and Hunt1992; Smith et al., Reference Smith, Crespi and Bookstein1997). Drones also showed a higher frequency of wing venation abnormalities than honey bee workers (Smith et al., Reference Smith, Crespi and Bookstein1997). All these results indicate that haploidy may be associated with higher frequency of abnormalities and asymmetry. Haploid drones and diploid females may differ in their sensitivity to developmental disturbances and in their ability to suppress asymmetry and venation abnormalities. However, despite males being more unstable than females for some traits, the phenomenon is neither consistent within or across species in haploid–diploid Hymenoptera and Thysanoptera (Clarke, Reference Clarke1997), but there is one exception. In honey bees, haploid males were consistently more asymmetric than diploid females for all examined traits (Brückner, Reference Brückner1976; Clarke et al., Reference Clarke, Brand and Whitten1986, Reference Clarke, Oldroyd and Hunt1992; Clarke & Oldroyd, Reference Clarke and Oldroyd1996; Clarke, Reference Clarke1997; Smith et al., Reference Smith, Crespi and Bookstein1997). Inbreeding depression may be responsible for the higher variability of drones, as some negative effects of inbreeding was reported for honey bees (Moritz, Reference Moritz1986; Bienefeld et al., Reference Bienefeld, Reinhardt and Pirchner1989). In haploid drones, inbreeding depression might be caused by maternal effects or epistatic interactions (Moritz, Reference Moritz1986).
It was earlier suggested that a lack of heterozygosity in drones affected their DS (Brückner, Reference Brückner1976). However, later results did not confirm this (Clarke et al., Reference Clarke, Brand and Whitten1986, Reference Clarke, Oldroyd and Hunt1992; Clarke & Oldroyd, Reference Clarke and Oldroyd1996). Moreover, it was shown that the extra Y chromosome increased the level of FA and the incidence of developmental abnormalities compared with normal individuals in D. melanogaster (Jokela & Portin, Reference Jokela and Portin1991). This result also indicates that phenomena other than heterozygosity may be responsible for differences in DS in drones (Clarke, Reference Clarke1997). For the haploid–diploid system, maintenance of DS seems to depend on some factor that is common to both haploid and diploid parts of the genome which, in turn, may be under the control of different mechanisms, and because of that diploids are developmentally more stable than haploids (Clarke et al., Reference Clarke, Oldroyd and Hunt1992). The difference in the level of DS between haploids and diploids may also be attributable to gene dosage as diploids, having two copies of each gene, should maintain normal development more efficiently than haploids with a single copy (Clarke et al., Reference Clarke, Oldroyd and Hunt1992; Clarke & Oldroyd, Reference Clarke and Oldroyd1996). This is especially so because the honey bee genome is characterized by a surprisingly high recombination rate, on average 5.7 recombination events per chromosome pair per meiosis compared with about 1.6 in other taxa (Beye et al., Reference Beye, Gattermeier, Hasselmann, Gempe, Schioett, Baines, Schlipalius, Mougel, Emore, Rueppell, Sirviö, Guzmán-Novoa, Hunt, Solignac and Page2006; Liu et al., Reference Liu, Zhang, Huang, Chen, Tian, Hurst and Yang2015). Additionally, a very high number of non-crossover events (i.e., conversion without crossover), which even outnumbered that of crossover events (Bessoltane et al., Reference Bessoltane, Toffano-Nioche, Solignac and Mougel2012) and may also increase variability, was observed.
The lower ability of haploid drones to suppress asymmetry and abnormalities in wing venation compared with diploid females is also supported by the assumption that selection pressure on their flight abilities is likely to be strong. Despite that, drones consistently show higher variability than diploid queens which are not expected to be under strong selection pressure as they rarely fly. It is believed that some traits are developmentally more stable than others (Clarke, Reference Clarke1998b). In particular, traits related to fitness such as locomotory traits should display lower levels of both inter- and intra-individual variation compared with traits unrelated to fitness (Clarke & Oldroyd, Reference Clarke and Oldroyd1996; Clarke, Reference Clarke1998b). It was shown that a substantially higher level of FA was reported in individuals for whom wings were vestigial (soldier morphs) than in individuals for whom the same trait was functional (dispersers) in thrips (Kladothrips intermedius formerly called Omcothrips tepperi) (Crespi & Vanderkist, Reference Crespi and Vanderkist1997). In hymenopteran species, wing length also constantly displayed the lowest asymmetry, whereas the number of hamuli displayed the highest asymmetry (Clarke, Reference Clarke1998a; Reference Clarkeb). In the present study, diploid workers, for which flying abilities are important, were also less variable than diploid queens which rarely fly. The high proportion of drones with asymmetry and abnormalities in wing venation could also be connected with the fact that they all derived from hives, and the effects of selection pressure on their flight abilities is revealed later as wing FA was significantly lower in drones collected at drone congregation areas than in those collected at hives (Jaffé & Moritz, Reference Jaffé and Moritz2010). Furthermore, drones with a high wing FA were never caught at drone congregation areas (Jaffé & Moritz, Reference Jaffé and Moritz2010), which could be the result of decreased flight performance associated with higher wing FA found in fruit flies (Markow & Ricker, Reference Markow and Ricker1992) and damselflies (De Block & Stoks, Reference De Block and Stoks2007).
Conclusions
The present study confirmed that there are considerable differences between normal individuals and major phenodeviants in relation to asymmetry. It also demonstrated for the first time that minor phenodeviants are not always intermediate as they are more comparable with normal individuals than major phenodeviants in the level of FA. Surprisingly, this study also showed that normal individuals are smaller than minor phenodeviants and are comparable with major phenodeviants.
Acknowledgments
This study was funded by the National Science Centre under grant UMO-2013/10/E/NZ9/00682.