Introduction
Development, calibration, and testing of active phased antenna arrays require solving a large number of problems, including the problem of diagnosis of the array under test (AUT). Many factors determine the selection of the diagnosis method: structure and operating mode of AUT during the testing, diagnosis duration (including duration of measurement and computation), and cost of its implementation. The results of the diagnosis problem solution allow estimating the technical condition of the active array and determining how its characteristics differ from the required ones. These differences may be caused by failures of single or groups of transmit-and-receive modules (TRMs), including failures of phase shifters, switches, and amplifiers [Reference Bachmann, Schwerdt and Brautigam1,Reference Stangl, Werninghaus, Schweizer, Fischer, Brandfass, Mittermayer and Breit2].
Especially strict performance requirements are imposed on space-borne systems, particularly synthetic aperture radars [Reference Stangl, Werninghaus, Schweizer, Fischer, Brandfass, Mittermayer and Breit2,Reference Brautigam, Schwerdt and Bachmann3]. Ground testing of active arrays includes measuring not only radiation characteristics (far-field pattern, sidelobe level, equivalent isotropic radiated power, cross-polarization level, mutual coupling between elements) but also impedance matching, power loss, and power consumption.
Many radiation characteristics of electrically large active arrays can only be measured in an anechoic chamber using near-field techniques, because the far-field zone distance may be prohibitively large. After the initial calibration of the phase shifters and attenuators of the array, a testing in normal operating mode, i.e. with all TRMs turned on, is required.
On this step, a testing of the antenna in a wide temperature range (tens and hundreds °C) should be performed [Reference Sanchez, Martin, Barrio, Pinto, Garcia, Sierra, De Haro, Besada and Galocha4,Reference Kuznetsov, Miloserdov, Temchenko, Kovalenko, Voskresenski, Vnotchenko, Riman and Shishanov5], since the characteristics of TRMs significantly depend on temperature. The measurement duration of active arrays compared to passive antennas is limited by three factors. First, the service life of TRMs is limited. Second, the TRMs warm up during the operation, and change their characteristics. Third, the duration of the normal operating mode of the whole system is also limited.
Conventional methods of phased antenna array diagnosis include measurement of the full set of field data in the near- or far-field zone [Reference Bucci, Migliore and Panariello6,Reference Wang7]. These methods, including methods based on the solution of integral equations using the method of moments, do not utilize a priori information about a reference, non-defect array. It leads to a large dimensionality of the problem, and the resulting computational problem is ill-posed [Reference Alvarez, Las-Heras and Garcia8]. For an array of N elements, the number of measurements M must be equal to or larger than N, and measurement duration may become prohibitively high, especially for electrically large arrays.
Along with conventional methods, new methods based on a “compressive sensing” (CS) approach are developed [Reference Migliore9,Reference Rauhut10]. These methods can also be applied to similar related problems, such as “inverse scattering” [Reference Shah, Khankhoje and Moghaddam11,Reference Turk, Ozkan-Bakbak, Durak-Ata, Orhan and Unal12]. Provided that the number of defects is low, these methods allow a significant reduction of the number of measurements by using a priori information about the field radiated by the reference (non-defect) array. While the idea behind CS-based diagnosis is very simple, there are still a number of unanswered questions:
1. How many measurements should be conducted to locate K defect elements among N elements with required probability?
2. How measurement points’ locations should be chosen?
3. What can be done if the temperature of the AUT differs from the temperature of the reference array?
4. Is it possible to reconstruct the excitation if the elements of the measurement matrix are not known exactly, e.g. when far-field patterns of radiating elements or measurement probe are not known, or if the reflections are present?
The first two questions received attention in the literature, e.g. good estimates of the required minimum number of measurements exist for a case of far-field measurement. In [Reference Li, Deng and Migliore13], the second problem was solved but also for the far-field case; for the near-field case, only a numerical example is shown in [Reference Pinchera and Migliore14].
However, the remaining questions were not investigated in detail. Existing research shows that (a) the change in excitation due to temperature drift lowers the probability of failure detection and increases the rate of false positives [Reference Kuznetsov, Miloserdov, Temchenko, Kovalenko, Voskresenski, Vnotchenko, Riman and Shishanov5,Reference Kuznetsov, Miloserdov, Bulygin, Temchenko, Kovalenko and Riman15]; (b) errors in the measurement matrix also lead to low accuracy of excitation reconstruction [Reference Kuznetsov, Temchenko, Miloserdov and Voskresenskiy16].
This paper presents and discusses in detail two modifications of CS-based diagnosis method that are focused on improving the quality (i.e. raising the probability of detection and lowering the probability of false detection (PFD)) and accuracy of diagnosis.
The first approach is aimed at a compensation of possible temperature drift of the array's characteristics assuming that the amplitudes and phases of all elements changed by the same amount. An iterative procedure is carried out to determine the desired change in excitation and solve the diagnosis problem. The second modification consists of two steps focused on the improvement of reconstruction accuracy. On the first step, CS-based diagnosis is used to locate potentially defect elements. On the second step, a series of additional measurements is carried out when only the phase of a potentially defect element changes, but the position of the probe remains fixed. This approach increases the accuracy of reconstruction without increasing the measurement duration, since most of the time required for the measurement is taken by the probe moving, and not by the registration of measured field.
Compressive sensing approach to array diagnosis
Formulation of problem
Active phased antenna array diagnosis problem is carried out on the basis of the inverse problem solution and can be reduced to the finding of array elements’ amplitudes and phases. The geometry of the problem is shown in Fig. 1. Radius vector rn specifies the position of n-th (n = 1,2, …, N) radiating element located in the aperture plane S A, rm is the position of m-th (m = 1,2,…, M) measurement point in the measurement surface S M. The field of each element is modeled by a set of elementary electric and magnetic dipoles, which are located at  ${\bf r}_{kn}^e $ and
 ${\bf r}_{kn}^m $, k = 1,2, …, K. Current distribution of the dipoles is given as:
 $$\eqalign{{\bf j}{\kern 1pt} _T^e ({\bf r},\omega ) = &p_{kn}^e \delta ({\bf r}-{\bf r}_{kn}^e ){\bf p}_{0k}^e \cr {\bf j}{\kern 1pt} _T^m ({\bf r},\omega ) = &p_{kn}^m \delta ({\bf r}-{\bf r}_{kn}^m ){\bf p}_{0k}^m,} $$
where  $p_{kn}^e {\bf p}_{0k}^e $ and
 $p_{kn}^m {\bf p}_{0k}^m $ are the vector dipole moments, and
 ${\bf p}_{0k}^e $ and
 ${\bf p}_{0k}^m $ are the unit vectors that define the orientation of k-th dipole.
Geometry of the problem.
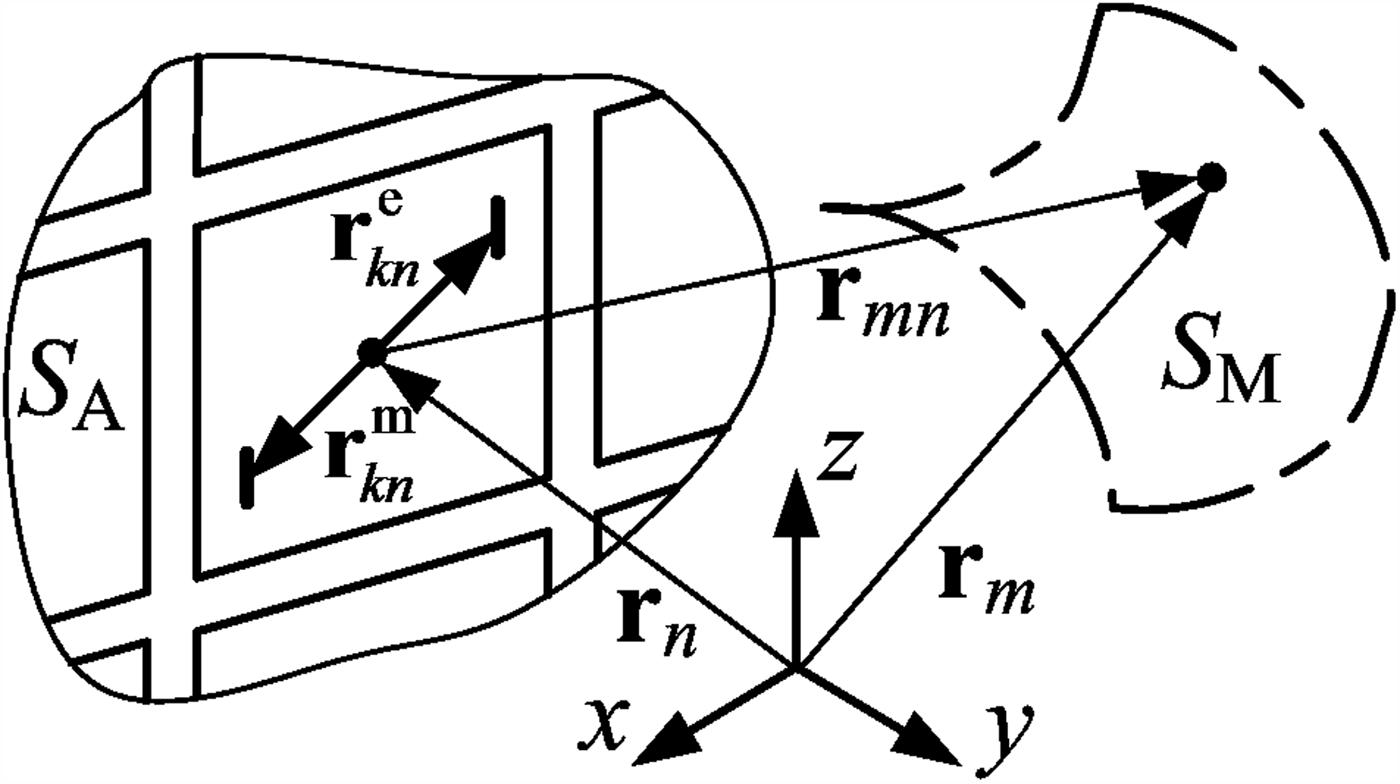
The field of the n-th element at the m-th measurement point can be found as shown in [Reference Hansen17]:
 $${\bf E}_{Dn}({\bf r}_{mn},\omega ) = {\bf E}_{Dn}^e ({\bf r}_{mn},\omega ) + {\bf E}_{Dn}^m ({\bf r}_{mn},\omega ),$$
where
 $$\eqalign{{\bf E}_{Dn}^e ({\bf r}_{mn}) = &\displaystyle{{ik_0Z_0\exp (-ik_0r_{mn})} \over {4\pi r_{mn}}} \cr &\quad \times \left[ {\sum\limits_{{\rm k} = 1}^{N_{\rm }} {\,p_{kn}^e \exp \left( {i\,k_0{\kern 1pt} {\bf r}_{kn}^e {\bf r}_{n0}} \right)\left[ {\left( {{\bf p}_{0k}^e {\bf r}_{n0}} \right){\bf r}_{n0}-{\bf p}_{0k}^e } \right]} } \right] \cr = &{\tilde {\bf E}}_{Dn}^e ({\bf r}_{mn})\displaystyle{{\exp (-ik_0r_{mn})} \over {r_{mn}}}} $$
and
 $$ \!\! \eqalign{{\bf E}_{Dn}^m ({\bf r}_{mn}) = &-\displaystyle{{ik_0\exp (-ik_0{\kern 1pt} r_{mn})} \over {4\pi r_{mn}}} \times \left[ {\sum\limits_{k = 1}^{K_{\rm }} {\,p_k^m \exp \left( {ik_0{\kern 1pt} {\bf r}_k^m {\bf r}_{n0}} \right)\left[ {{\bf p}_{0k}^m \times {\bf r}_{n0}} \right]} } \right] \cr = &{\tilde {\bf E}}_{Dn}^m ({\bf r}_{mn})\displaystyle{{\exp (-ik_0r_{mn})} \over {r_{mn}}},} $$
where k 0 is the wave number,  $r_{mn} = \vert {{\bf r}_m-{\bf r}_n} \vert $ ‒ distance from the element to the measurement point,
 ${\bf r}_{n0} = {\bf r}_{mn}/r_{mn}$, and it is taken into account that r mn ≫
 $\vert {{\bf r}_{kn}^e} \vert $ and r mn ≫
 $\vert {{\bf r}_{kn}^m} \vert $ (see Fig. 1). Assuming that the dipole moments in (3) and (4) are normalized, the radiated field (2) of the n-th element excited by the current with complex amplitude x n can be found as
 $$\eqalign{{\bf E}_{Dn}({\bf r}_{mn}) = &x_n\big( {{ \tilde{ \bf E}}_{Dn}^e ({\bf r}_{mn}) + { \tilde {\bf E}}_{Dn}^m ({\bf r}_{mn})} \big) \displaystyle{{\exp (-ik_0r_{mn})} \over {r_{mn}}} \cr = &x_n{\bf E}_n(\theta, {\kern 1pt} \varphi )\displaystyle{{\exp (-ik_0r_{mn})} \over {r_{mn}}},} $$
where  ${\bf E}_n(\theta {\rm,} {\kern 1pt} \varphi )$ is the n-th element field (or far-field pattern) when the excitation current amplitude is unity. If the receiving far-field pattern of the probe
 ${\bf h}(\theta, \phi )$ is known, the antenna array diagnosis problem can be written in matrix form
 $${\bf U} = {\bf Ax}$$
where  ${\bf x} = (x_1,x_2, \ldots, x_N)^T\in {\open C}^N$ is an excitation vector,
 ${\bf U} = (U_1,U_2, \ldots, U_M)^T\in {\open C}^M$ is the measurement vector, i.e. complex amplitudes of voltage registered by the probe, and elements of the measurement matrix
 ${\bf A}\in {\open C}^{M \times N}$ can be found as
 $$a_{mn} = \displaystyle{{U_m} \over {x_n}} = {\bf E}_n(\theta _{mn},{\kern 1pt} \varphi _{mn}) \cdot {\bf h}({\theta} ^{\prime}_{mn},{\kern 1pt} {\varphi} ^{\prime}_{mn})\exp (-ik_0r_{mn})/{\kern 1pt} r_{mn}$$
The definition of angles θ, φ, θ′, and φ′ is shown in Fig. 2.
Geometry of coordinate systems used for n-th radiating element and m-th position of the probe located at the point P.

This formulation is correct for any array geometry and measurement surface S M. It is also applicable to similar problems that can be reduced to the reconstruction of electric and/or magnetic currents, in the frequency domain or time domain [Reference Kuznetsov, Baev, Gorbunova, Konovalyuk, Thomas, Smartt, Baharuddin, Russer and Russer18]. Conventional methods require M ≥ N to solve (6), i.e. a full set of measurements is required. Due to several reasons, the measurement matrix A is ill-conditioned, so the convergence and accuracy of the solution degrade when the dimensionality of the problem grows [Reference Bucci, Migliore and Panariello6].
Solution of CS problem
It is assumed that the excitation vector is sparse, i.e. the number of non-zero components K is significantly lower than total number of its elements N. For an array that has low number of defect elements, a vector that is a difference between defect array (AUT) and reference array (non-defect) can be found x = xr − xd. Then (6) can be rewritten as
 $${\bf U}_d-{\bf U}_r = {\bf A}({\bf x}_d-{\bf x}_r)$$
 $${\bf U} = {\bf U}_d-{\bf U}_r,\quad {\bf x} = {\bf x}_d-{\bf x}_r$$
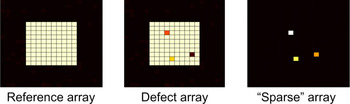
Excitation vector x in (9) (see Fig. 3) corresponds to a “sparse” array that consists of a small number of radiating elements.
An illustration of 10 × 10 “sparse” array construction.

Note that the reference array excitation vector can be found by using the conventional diagnosis methods or by means of numerical modeling. If the number of measurements M is smaller than the number of elements N (the goal of using CS-based methods), the problem (8) is ill-posed and a regularization procedure is required. Usually some kind of a priori information about the solution is used, e.g. the sparseness of x for the CS-based methods. There are different ways to exploit the sparseness of x [Reference Migliore9], for example, using the ℓ0 norm:
 $$\min \left\Vert {\bf x} \right\Vert_0:\quad \left\Vert {{\bf Ax}-{\bf U}} \right\Vert _2 \lt \varepsilon, $$
or using a more convenient ℓ1norm, which leads to a convex minimization problem:
 $$\min \left\Vert {\bf x} \right\Vert _1:\quad \left\Vert {{\bf Ax}-{\bf U}} \right\Vert _2 \lt \varepsilon, $$
where  $\left\| \ldots \right\|_2$ is Euclidean norm,
 $\left\Vert {\bf x} \right\Vert_1 = \sum\limits_{n = 1}^N {\vert {x_n} \vert } $ is ℓ1norm, ε is related to the noise affecting the data. The constrained minimization problem (11) can be rewritten as a ℓ1/ℓ2 minimization problem
 $$\mathop {\min} \limits_{\bf x} \left\Vert {{\bf Ax}-{\bf y}} \right\Vert _2^2 + \mu \left\Vert {\bf x} \right\Vert _1,$$
which can be efficiently solved using different iterative algorithms, e.g. YALL 1 [Reference Yang and Zhang19] or NESTA [Reference Becker, Bobin and Candes20,Reference Nesterov21].
The reliability and precision of solution depend not only on the signal-to-noise ratio (SNR), but also on the measurement matrix, i.e. the positions of measurement points. If a measurement matrix satisfies the so-called restricted isometry property (RIP) [Reference Migliore9,Reference Rauhut10], then the excitation vector can be reliably reconstructed with high precision. Calculation of RIP requires proof for all K-sparse x vectors, which is usually impractical. For far-field array diagnosis, an approach to the deterministic selection of measurement points is presented in [Reference Li, Deng and Migliore13]. In a near-field diagnosis case discussed in [Reference Pinchera and Migliore14], a 368-element circular array is effectively diagnosed using 24 measurement points, whose positions were determined by numerical trials.
Even if the optimal positions of the probe are found, there still are other issues that need to be solved before CS-based methods could be used in practice. They are described in the next section.
Known issues of the method and proposed solutions
The CS-based diagnosis has a high probability of detection of defect elements and allows reconstructing amplitude and phase of the elements with high precision when the two conditions are met. First, the measurement matrix A must be known with high precision; second, it is assumed that the excitations of non-defect elements in reference and defect arrays are exactly the same. Both assumptions are rarely true. Far-field patterns of the probe and array elements in equation (7) are not always known exactly, and equation (7) is true only for anechoic conditions. The difference in the excitation of non-defect elements is caused by the mutual coupling of the radiators and by the thermal instability of active elements.
While the performance of CS-based diagnosis method deteriorates in the presence of errors mentioned above, this method can still locate defective elements, albeit with lower precision and reliability [Reference Kuznetsov, Miloserdov, Temchenko, Kovalenko, Voskresenski, Vnotchenko, Riman and Shishanov5]. To improve precision and probability of detection, we propose two modifications of this method, which can be used independently or jointly.
Low reconstruction accuracy
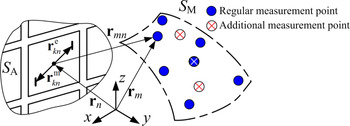
First modification of the method addresses an issue with exact values of measurement matrix A. The only practically feasible way of obtaining A with high precision implies direct measurements of the field of every single element at every measurement point (7). This process is very time-consuming and requires AUT to be placed exactly in the same position as a reference array. This leads us to the two-step algorithm. In the first step, the radiating elements are separated into two groups: normally operating elements and potentially defect elements using CS-based diagnosis. The second step is required to separate the defect elements and operating elements from the set of potentially defect elements. To do so, the additional measurement set is conducted at a selected measurement point m (or a set of selected additional measurement points, see Fig. 4), for which a mn, n = 1,…, N, is known with required high accuracy.
Geometry of acquisition for additional measurements.

For each potentially defect element, the excitation phase is increased (using phase shifters of AUT) by the specified value Δφ, e.g. 180°, leaving the excitations of other elements unchanged. For k-th defect element, the complex amplitudes of the measured field at the measurement point can be found as
 $$\eqalign{\dot{U}_{\Sigma 1}^k = \dot{U}_{\Sigma 0}^k + {\dot{U}}^k = &\sum \limits_{n = 1,\;n \ne k}^N {\big( {\dot{U}_n^d -\dot{U}_n^r} \big) } + \dot{U}_k^d -\dot{U}_k^r \cr \dot{U}_{\Sigma 2}^k = \dot{U}_{\Sigma 0}^k + {{\dot{U}}^{\prime k}} = &\sum\limits_{n = 1,\;n\ne k}^N {\big( {\dot{U}_n^d -\dot{U}_n^r} \big) } + \dot{U}_k^d \times \exp (i\Delta \varphi )-\dot{U}_k^r,} $$
where  $\dot{U}_{\Sigma 1}^k $,
 $\dot{U}_{\Sigma 0}^k $, and
 $\dot{U}^k$ are the complex amplitudes (before changing the phase of k-th element) of the measured field, field of all elements except k-th element and field of k-th element only, respectively.
 $\dot{U}_{\Sigma 2}^k $ and
 ${\dot{U}}^{\prime k}$ are the complex amplitudes (after changing the phase) of the measured field and of k-th element field, respectively. Transforming (13), the field produced by k-th defect element can be found as
 $$\dot{U}_k^d = \displaystyle{{\dot{U}_{\Sigma 1}^k -\dot{U}_{\Sigma 2}^k} \over {1-\exp (i\Delta \varphi )}}$$
Note that  $\dot{U}_{\Sigma 1}^k -\dot{U}_{\Sigma 2}^k $ may be zero in case the amplitude of k-th element is zero, or in case of phase shifter failure when Δφ = 0. The element will be classified as a defect in both cases.
The complex amplitude of k-th element excitation can be found from (6) as
 $$\dot{x}_k^d = \displaystyle{{\dot{U}_k^d} \over {{\dot{a}}_{mk}}}$$
or, if using expression (7):
 $$\dot{x}_k^d = \displaystyle{{\dot{U}_k^d r_{mk}\exp (ik_0r_{mk})} \over {h({{\theta} ^{\prime}}_{mk},{{\varphi} ^{\prime}}_{mk})E(\theta _{mk},\varphi _{mk})}}$$
Thermal instability of the array
Second modification of the method addresses the issue of thermal instability of the array. Changes in excitation are usually modeled in the same way as thermal noise (e.g. [Reference Pinchera and Migliore14]), but thermal instability error has a non-zero mean value because changes in temperature lead to approximately the same change of amplitude and phase of all elements. It means that vector  ${\bf x} = {\bf x}_d-{\bf x}_r$ is no longer sparse and non-defect elements could be categorized as a defect.
To solve this problem we assume that all elements change their amplitudes and phases equally. This assumption is true when temperature changes only slightly (several °C) and there is no significant variation in temperature across the array. In practice, it means that the reference and defect arrays are the same, e.g. when the reference array is measured, then tested (mechanically/thermally) and then is measured again at the same thermal conditions as before to check whether any active elements have failed.
In this case, the measured field of AUT  ${\bf U}_d^m $ can be found as
 $${\bf U}_d^m = p_c {\bf U}_d,\quad p_c = a_c\exp (i\varphi _c),$$
where p c is a correction coefficient and Ud is the field that would be measured in the absence of thermal instability. Then equation (9) takes the form
 $${\bf U} = \displaystyle{{{\bf U}_d} \over {\,p_c}}-{\bf U}_r,\;{\bf x} = \displaystyle{{{\bf x}_d} \over {\,p_c}}-{\bf x}_r$$
To determine the correction coefficient p c the minimization problem (12) should be solved for different values of p c.
 $$\mathop {\min} \limits_{\,p_c} \left\Vert {{\bf A}{\bf x}_f-\lpar {{\bf U}_d^m p_c^{-1} -{\bf U}_r} \rpar } \right\Vert _2^2 + {\rm \mu} \left\Vert {{\bf x}_f} \right\Vert _1,$$
where xf is a solution of (12) for a given value of p c. Function minimized in (19) is convex, in the absence of noise its minimum corresponds exactly to correction coefficient p c.
It should be noted that all CS methods are based on a priori information about the solution (the assumption that the solution is sparse). Hence the proposed procedure is only useful when (17) is at least approximately true. If thermal changes also affect the phase-distribution network, or if AUT is so large that the temperature is different across the array, then the algorithm cannot improve the solution. In this case, more precise a priori information or more measurements are required to reconstruct the excitation successfully.
Results and discussion
To determine the validity of our approach, we conducted a numerical experiment. We want to find answers to the following questions:
• How important is the accuracy of the measurement matrix and how does it affect the solution?
• How can we improve the accuracy using the approach proposed in section “Low reconstruction accuracy”? How does the thermal instability affect the reconstruction results and how can we improve it using the procedure described in section “Thermal instability of the array”?
The parameters of the experiment are provided in the next subsection.
Model of the array and experiment parameters
A planar rectangular 10 × 10 array of open waveguide elements is considered, the field of the array was simulated with FDTD. While CS-based diagnosis methods do not strictly require the measurement surface to be planar, it is common to measure the field of a planar array on a plane parallel to the aperture [Reference Wang7]. To ensure that the measurement points are in the far-field region of any radiating element (but not in the far-field of the array itself), we have chosen the distance between the measurement plane and the aperture of the array to be equal 3λ, where λ is the operating wavelength. To show the ability of CS-based methods to solve the underdetermined problem (9), we have chosen the number of measurements lower than the number of elements, in our case M = 35. It is possible that this number could be improved if another measurement geometry was used, but, as noted in the Introduction, the problem of optimal measurement point selection in the near-field case has not been solved yet.
The effectiveness of a diagnosis method may be characterized in many different ways, but in our case, two values are of particular interest: failure identification success rate (FISR) and PFD. FISR is the probability of locating all defect elements, and PFD is the average number of false detections per a non-defect element of the array:
 $${\rm PFD} = \displaystyle{{{\rm Average}\;N\;{\rm of}\;{\rm false}\;{\rm detections}\,{\rm in}\;{\rm solution}} \over {N\;{\rm of}\;{\rm non\hyphen defect}\;{\rm elements}}}$$
The accuracy and precision of the method were also investigated. Since l 1-based reconstruction methods are known to underestimate high-amplitude components [Reference Selesnick22,Reference Wei, Zhang, Han, Xu, Hong and Wu23], we have computed both the mean value of the error and its standard deviation (SD).
The excitation of the reference array was uniform. In a defect array, 3–10 (to keep the number of defects K much lower than the number of elements N) defect elements with excitations specified in Table 1 were present. All non-defect elements have an amplitude of 1 and phase 0°.
Excitations of defect elements

The radiation pattern En of n-th radiating element in equation (7) is not always known exactly, and elements of a calculated measurement matrix may differ from the measured ones. In order to determine how errors in the measurement matrix influence the solution, diagnosis problem (12) was solved using three different measurement matrices. The “exact” (or “reference”) measurement matrix AR is acquired by simulating sequential excitation of every single element. For the “simplified” measurement matrix A0 all elements were assumed isotropic (En = 1 for all n). The “approximate” measurement matrix A1 was calculated using a quasi-analytical far-field pattern of an open waveguide En.
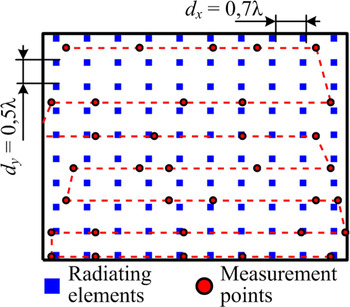
Positions of the elements and measurement points are shown in Fig. 5.
Positions of radiating elements and measurement points.
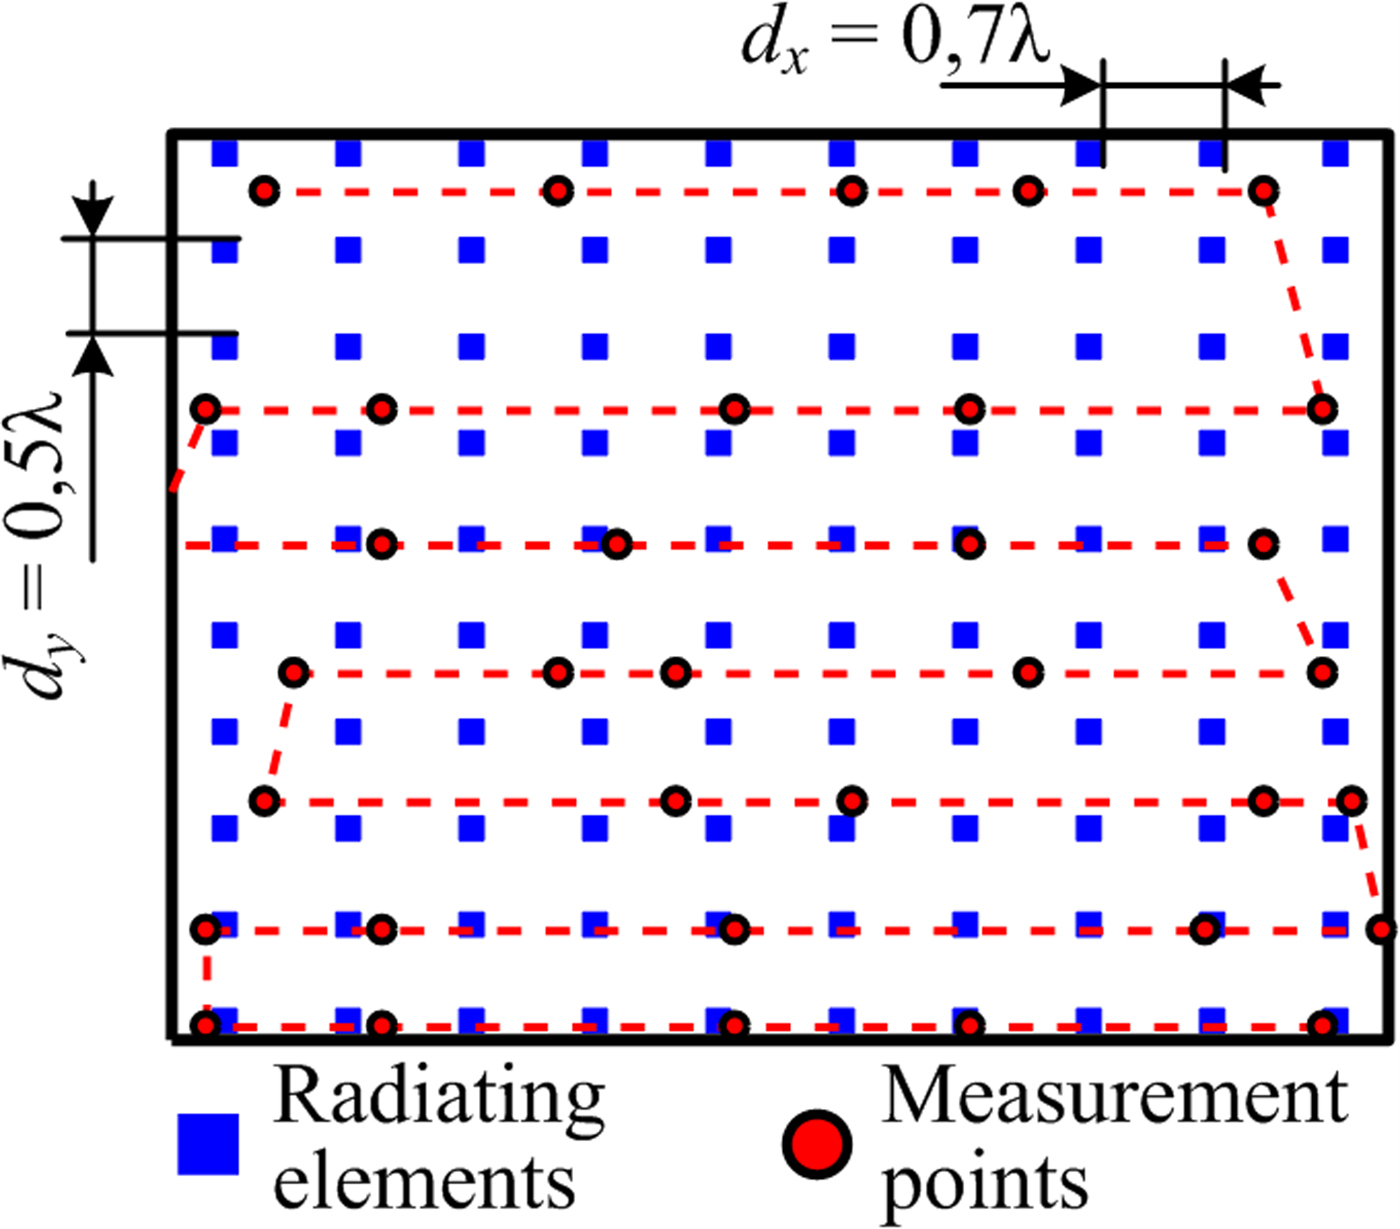
The n-th element was considered a defect when the absolute value of x n (n-th component of the vector  ${\bf x} = {\bf x}_d-{\bf x}_r$) was larger than a certain threshold. In this paper, this threshold was set to 0,1, which corresponds roughly to ±1 dB amplitude error (to detect defects of discrete attenuators with a least significant bit of 0.5…1 dB) or ±6° phase error (to detect defects of 6-bit discrete phase shifters with a least significant bit of 5625°).
Finally, we assume that the accuracy of amplitude and phase measurement is about ±5% and ±2°, respectively. This accuracy roughly corresponds to an SNR of 40 dB stated in [24].
All parameters of the model are combined in Table 2.
Parameters of the model

Results of diagnosis without correction
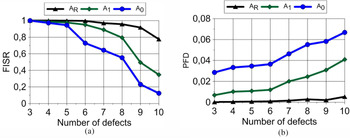
For a given number of defects, FISR and PFD were estimated by repeating the identification procedure 2000 times (100 different distributions of defect elements, 20 different realizations of white Gaussian noise for each distribution). Results of diagnosis (FISR and PFD) in thermally stable conditions are shown in Figs 6(a) and 6(b).
Characteristics of the diagnosis method for a 10 × 10 array of open waveguide elements with 3λ distance to measurement plane: (a) failure identification success rate (FISR) and (b) probability of false detections (PFD). AR – results acquired using the reference measurement matrix, A0 – “simplified” measurement matrix, A1 – “approximate” measurement matrix.

As it could be expected from the results presented in [Reference Pinchera and Migliore14], FISR decreases with the number of defect elements. For a small number of defects, FISR is high no matter what measurement matrix was used; the only real difference is PFD. For 10 defects, PFD obtained using AR and A0 differ more than 10 times.
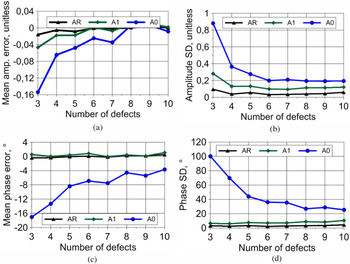
The accuracy of amplitude and phase reconstruction is shown in Fig. 7. It was expected that the results obtained using the simplest measurement matrix A0 will have the lowest precision (high SD), and the better we know the measurement matrix, the more accurate and precise results we get. It can also be seen that matrices AR and A1 produce an accurate and precise value of the elements’ phase.
Accuracy and precision of excitation reconstruction: (a) mean of amplitude error; (b) standard deviation (SD) of amplitude error, (c) mean of phase error; (d) SD of phase error.

However, if the matrices AR and A1 cannot be obtained, we need a way to increase the accuracy and precision of excitation reconstruction. Our first modification of CS method addresses this issue, and the simulated results of its implementation are presented in the next subsection.
Accuracy improvement using additional measurements
After potentially defect elements were identified using the CS-based diagnosis method, we may need to improve the accuracy and precision of excitation reconstruction. To do so, we conduct additional measurements at a single point in the center of the measurement plane. The additional phase shift was equal to 180°.
Usually the duration of the near-field measurement is determined by the scanner movement, and not by the measurement of the field samples. Since the probe is fixed now, we can increase the duration of each measurement and thus increase the accuracy of amplitude and phase measurement without increasing overall measurement time too much. It may be required when we try to separate the signal of a single element from signals of all other elements. For our simulations, we assumed amplitude and phase accuracy of ±3% and ±1°, respectively.
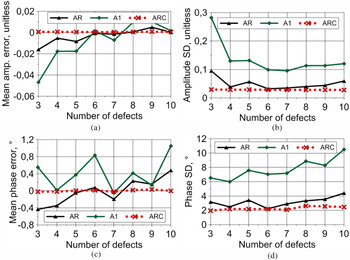
The analysis of results shown in Fig. 8 confirms that the accuracy of the proposed has increased significantly. Mean value of error is zero; amplitude and phase are reconstructed with a precision of 0.1 and 6°, respectively. It should be noted again that a row of the measurement matrix a mn, n = 1…N for a given m should be known, i.e. measured. Mean value of phase error (see Fig. 8(c)) is close to the measurement accuracy (approximately 1°).
Accuracy and precision of excitation reconstruction: (a) mean of amplitude error; (b) SD of amplitude error; (c) mean of phase error, (d) SD of phase error. AR – reconstructed using reference measurement matrix, A1 – using approximate measurement matrix, ARC – corrected results.

Correction of solution in the presence of thermal instability effects
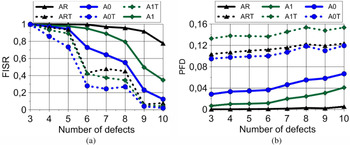
Now we try to determine how thermal instability affects the solution. In our case, a change in temperature of the array leads to the change in the excitation of all array elements. We assume that the change in temperature is equal for all elements, and that their amplitudes and phases change by the same amount. In this simulation, a 0.42 dB change in amplitude and 1° change in the phase were assumed. The FISR and PFD obtained under these conditions are shown in Fig. 9.
(a) FISR and (b) PFD in the presence of thermal instability compared to initial results. AR, A0, A1 – initial results (in the absence of thermal changes, see Fig. 6), ART, A0T, A1T – results in the presence of thermal instability.

It can be seen from the results presented in Fig. 9 that the thermal instability of the array significantly reduces the effectiveness of the CS-based diagnosis. As expected, the number of false detection increases (2–20 times compared to initial PFD). It should be noted that for a small number of elements (<5% of all elements) the probability of detection remains sufficiently high (90% and higher) for results acquired with measurement matrices AR and A1. Unfortunately, FISR rapidly decreases with a larger number of defects.
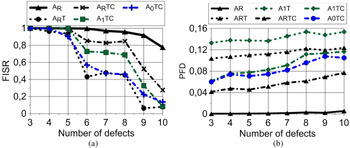
The results (FISR and PFD) of correction procedure (19) applied to the same 10 × 10 array are presented in Fig. 10.
Results of diagnosis correction procedure (19): (a) FISR and (b) PFD.

As can be seen from Fig. 10, the correction procedure can significantly increase the identification success rate and reduce PFD. For example, for 6–8 defects, FISR improved from approximately 50 to 85% using a reference measurement matrix AR. However, when the measurement matrix is not known exactly, the performance of this diagnosis method degrades again. While five defect elements or less can be recovered with high probability (>90% for any measurement matrix), increasing number of defects to six or more leads to a much lower detection probability.
Conclusion
In this paper, we have investigated a CS-based antenna array diagnosis method and presented two modifications. These modifications deal with the two disadvantages of the method: sensitivity to thermal instability of active elements of the array (or to any other source of error with non-zero mean value) and low accuracy of excitation reconstruction.
Our research has shown that the thermal instability greatly reduces the usefulness of the CS-based diagnosis method, increasing the number of false detections up to 20 times. It also lowers the number of defect elements that can be reconstructed with a required probability of success.
The first proposed modification is based on a modified l 1-minimization procedure and allows correcting the measured field in case of thermal instability of the array. For example, FISR was reduced from 95 to 40% (six defects in a 100-element array), but the correction procedure increased it to 85%.
The second proposed modification increases the accuracy of excitation reconstruction by using several additional measurements. It requires the data about the exact (directly measured) row of a measurement matrix and the ability to change the phase of a single radiating element. Contrary to the CS-based only reconstruction, the resulting accuracy of reconstruction depends only on field measurement accuracy at the measurement point.
Acknowledgement
This work was supported by the Ministry of Education and Science of the Russian Federation under the agreement of 14.577.21.0279 of 26.09.2017, ID RFMEFI57717X0279.
 Grigory Kuznetsov received his Ph.D. in engineering from the Moscow Aviation Institute in 2018. He is now a researcher at the Research Institute of Precision Instruments. His main research interests are antenna design and measurement, as well as synthetic aperture radar systems.
 Vladimir Temchenko received his Ph.D. in 1982 and Dr Sc (Eng) in 2012 from the Moscow Aviation Institute. He is currently a professor of “Radiophysics, antennas, and microwave devices” chair at the Moscow Aviation Institute and his main research interests include antenna measurement and diagnosis, inverse scattering problems as well as ground-penetrating radar.
 Maxim Miloserdov received his Ph.D. in 2014 from the Department of Radioelectronics of the Moscow Aviation Institute. He is now a researcher at the Research Institute of Precision Instruments. His current research interests include active phased arrays, their characterization, and applications in synthetic aperture radar.
 Dmitry Voskresenskiy received his Diploma and Ph.D. at the Moscow Aviation Institute in 1951 and 1955, respectively. He received a Dr Sc (Eng) in 1966 from the Moscow Aviation Institute. He is a chair of the antenna chair of the Department of Radioelectronics at the Moscow Aviation Institute since 1975. He has authored more than 200 research articles and his current research interests include phased antenna arrays and their components.