Introduction
Impulsivity is a controversial concept, and in neurobiological research there exists two different approaches for understanding the underpinning of impulsive behaviour. The first is Gray's behavioural activation system (BAS) and behavioural inhibition system (BIS), which derives from animal research Reference Gray and McNaughton(1,Reference Pickering, Gray and Pervin2). BAS is believed to reflect individual variations in sensitivity to rewarding stimuli in the environment and involves activation of the appetitive, dopaminergic systems. BAS initiates goal-directed behaviour from both positive incentive motivational stimuli, i.e. approach behaviour, as well as aversive stimuli, i.e. active avoidance behaviour. BIS modulates BAS-driven behaviour through activation of amygdala and the septohippocampal system. BIS gives rise to anxiety and passive avoidance behaviour in response to conditioned or innate aversive stimuli. Thus BIS is considered to reflect an individuals sensitivity to punishment (SP) Reference Gray and McNaughton(1,Reference Pickering, Gray and Pervin2). Bechara et al. Reference Bechara, Dolan and Hindes(3) have proposed that conditions associated with abnormal activity in the mesolimbic dopaminergic system result in exaggerated incentive processing and thereby enhanced ‘SR’ (BAS), which underpins impulsive behaviour. The second central theory in neurobiological impulsivity research derives from human lesion studies. Observation and experimental testing of human behaviour after brain damage, especially to the orbitofrontal cortex (OFC), have revealed that abnormal activity in the OFC leads to diminished inhibition or ‘rash impulsiveness' Reference Thorpe, Rolls and Maddison(4,Reference Rolls, Plutchik and Keleman5). If damage to the OFC occurs during childhood, more severe antisocial and reckless behaviour arise than if the damage is inflicted during adulthood Reference Andersson, Bechara, Damasio, Tranel and Damasio(6).
SR and rash impulsivity without consideration of the consequences (Reference Dawe, Gullo and Loxton7–Reference Quilty and Oakman10) has been shown to represent the two factors explaining impulsivity best in several factor-analyses. Reward sensitivity can be explored using measures of Gray's behavioural approach or impulsivity dimension; e.g. Carver and White's BISBAS scales Reference Carver and White(11) or Torrubia, Avila, Molto and Caseras' sensitivity to reward (SR) scale Reference Torrubia, Avila, Molto and Caseras(12), taken from the sensitivity to punishment and sensitivity to reward questionnaire (SPSRQ). Rash impulsivity can be evaluated with scales such as Eysenck's impulsivity scale Reference Eysenck, Pearson, Easting and Allsopp(13) (also known as the I7) and Cloninger's novelty seeking scale.
Patients with borderline personality disorder (BPD) are known to be impulsive. In BPD the impulsive behaviour can be categorised into two subtypes: deliberately physically self-destructiveness and general forms of impulsivity. Self-mutilation and suicidality are the constituent elements of the first type, whereas common forms of the second are substance abuse, disordered eating, spending sprees, verbal outbursts and reckless driving (14). Positron emission tomography, functional magnetic resonance imaging (fMRI) and EEG studies suggest that abnormalities in OFC, anterior cingulate cortex (ACC), dorsolateral prefrontal cortex, hippocampus and amygdala are connected to impulsivity in BPD (Reference De la Fuente, Goldman and Stanus15–Reference Driessen, Herrmann and Stahl25). Soloff and coworkers Reference Soloff, Meltzer, Becker, Greer, Kely and Constantine(16) reported that impulsive self-destructive BPD patients have medial OFC hypometabolism compared to healthy controls. The suggested importance of the OFC in BPD pathology implies that impulsivity in this group is best described as rash impulsiveness. Increased rash impulsiveness may in turn be connected to increased brain activity in BPD patients compared to matched controls on tasks tapping response inhibition as shown in healthy volunteers with a range of I7 scores Reference Horn, Dolan, Elliot, Deakin and Woodruff(26).
Linehan's biosocial theory of BPD Reference Crowell, Beauchaine and Linehan(27) describes BPD patients to have (a) heightened emotional sensitivity, (b) inability to regulate intense emotional responses and (c) slow return to emotional baseline. As BAS is proposed to underpin impulsivity and BIS relates to heighten SP, BAS/BIS may also be important in impulsivity as seen in BPD. This has to our knowledge not been explored previously.
The aims of the present study were:
1. to determine the neuronal correlates to general, rash impulsiveness and reward sensitivity, by correlating I7 and SPSRQ scores with the level of activation in different brain areas measured with fMRI during a block designed Go-NoGo task.
2. to evaluate whether BPD patients and controls have the same brain activation pattern as measured with fMRI during a block designed Go-NoGo task.
3. to uncover which factor, i.e. ‘rash impulsive behaviour’ or ‘heightened SR’, best describes impulsivity in BPD.
Materials and methods
Subjects
The study was approved by the regional ethical committee (Regional etisk komite, Midt-Norge), and adhered to the Helsinki convention. All participants received written information with images of the scanner, where the procedure was carefully explained. Also the possibility of claustrophobia during scanning was explained. In addition, the experimental set up was explained orally on an individual basis. After reading and hearing the information, the participants gave their written consent. To minimise variability only women were asked to participate. Fifteen female patients diagnosed with BPD were enrolled. The diagnosis was based on the structural clinical interview (SCID II) for Diagnostic and Statistical Manual and Mental Disorders, which was performed by certified psychiatrists from the Division of Psychiatric Disease, Østmarka Unit, at St. Olav's Hospital, Trondheim, Norway. Five or more criteria had to be met to be diagnosed with BPD. In addition, the BPD Severity Index-IV interview was performed. At time of fMRI-scanning, all patients were waiting to be enrolled in an out-patient treatment program and none were hospitalised. Fifteen women matched for age and education served as controls. Persons with a history of neurological or psychiatric disease (other than BPD), head trauma, and persons with MRI contraindications, such as claustrophobia, were excluded from participation. In addition persons with braces were excluded in order to eliminate artifacts in the MRI data. The patients, but not the controls, were financially reimbursed with 250 Norwegian Kroner (NOK) for their participation in the study.
Methods
Each participant completed two questionnaires:
1. Sensitivity to punishment and sensitivity to reward questionnaire
SPSRQ measures a broader aspect of the impulsivity construct including reward sensitivity based on Gray's original notion regarding BAS (Reference Caseras, Avila and Torrubia8–Reference Quilty and Oakman10). The SPSRQ is a 48-item self-report questionnaire assessing individual SR and punishment Reference Torrubia, Avila, Molto and Caseras(12). The SP scale assesses passive avoidance and novelty thoughts in response to the possibility of punishment or failure. The SR scale assesses proneness to approach, which is a variety of reward types. Internal consistency estimates (coefficient alpha) for the SP and SR subscales are 0.75 for SR in females, and 3-month test-retest reliabilities were 0.89 for SP and 0.87 for SR Reference Torrubia, Avila, Molto and Caseras(12). Experimental studies suggest that it reflects individual differences in Gray's BAS and BIS dimensions Reference Caseras, Avila and Torrubia(8,Reference Avila and Parcet28).
2. I7 impulsiveness questionnaire
The I7 is a self-report scale, which assesses two dimensions of impulsivity: Impulsiveness and venturesomeness. Eysenck and colleagues Reference Eysenck, Pearson, Easting and Allsopp(13) define impulsiveness as behaving without thinking and without realising the risk involved with the behaviour. Venturesomeness is conceptualised as being conscious of the risk of the behaviour, but acting anyway. The measure consists of 54 items in a true-false format. The impulsiveness subscale contains 19 items, (e.g. ‘Do you often do things at the spur of the moment?’), whilst 16 items make up the venturesomeness subscale, (e.g. ‘Do you sometimes like doing things that are a bit frightening?’). The remaining 19 items make up an empathy subscale, with no filler items (as we were not interested in assessing the empathy subscale). High scores on each of the subscales indicate high levels of impulsivity, venturesomeness and empathy. Eysenck et al. (1985) report good reliabilities for the three individual subscales. Test-retest reliability was 0.90 for women on the venturesomeness and impulsiveness scales.
fMRI paradigm
A block-design Go-NoGo paradigm based on a modification of the task described by Casey et al. Reference Casey, Trainor and Orendi(29) was used to probe response inhibition without unduly loading working memory. BPD patients have been shown to perform worse than controls in Go-NoGo tasks Reference Rentrop, Backenstrass and Jaentsch(30). The paradigm was compiled in E-Prime (Psychology Software Tools, Pittsburgh, USA) and consisted of three different blocks types, all with duration of 30 s. Block A: Go-condition, white lower case letters were presented for 500 ms on a black background at the centre of the screen. Between the presented letters, a white fixation cross was displayed for 1000 ms. The participants were instructed to respond as quickly as possible by pressing a response button with their right thumb in response to any letter except ‘V’. Block B: NoGo-condition, letter presentation was identical as for Go-condition, but with 50% targets, i.e. the letter ‘V’, and 50% non-targets, i.e. any other letter. Within each block, targets were presented in pseudo-randomised order. Block C: Rest-condition, white fixation cross centered on a black background lasting 30 s. The order of the blocks was ABCABCBABAC. All the participants were trained before fMRI. Subjects were not be given an indication of their performance during the task. For targets, the reaction times (RT) and accuracies were registered and for non-targets the commissions.
MRI data acquisition
All MR images were acquired on a Philips Intera 3 Tesla scanner (Philips MedicalSystems, Best, the Netherlands) with Quasar Dual gradients (maximum gradient strength 80 mT/s/m) using a eight-channel sensitivity encoding (SENSE) head-coil (InVivo, Gainesville, USA). The participants' heads were immobilised using foam padding. For the functional imaging study, a gradient-echo single-shot echo-planar-imaging (EPI) sequence was used. Serial imaging with T2*-weighted blood oxygen level dependent (BOLD) sensitive whole brain measurements was acquired during the task. Each measurement consisted of 42 contiguous axial slices with the following acquisition parameters: slice thickness = 3.2 mm, TR = 3000 ms, TE = 35 ms, flip angle = 90°, SENSE reduction factor = 2.2, field-of-view (FoV ) = 256. Each functional run was preceded by four dummy scans for magnetisation stabilisation; these were discarded before further analysis. An anatomical T1-weighted 3D magnetisation-prepared rapid gradient-echo reference scan was acquired in the coronal orientation with TR = 9.7 ms, TE = 4.6 ms, flip angle = 8°. There were 182 slices with slice thickness = 1.2 mm and FoV = 250 giving an in-plane resolution of 0.97 × 0.97 mm2.
Paradigm presentation
The paradigm was presented from a stationary PC connected to a LCD-screen (Philips Medical Systems, the Netherlands) located at the rear of the magnet bore opening. The participant observed the screen via a mirror mounted on top of the head-coil. The responses were obtained with response grips (Nordic NeuroLab AS, Bergen, Norway) and logged in E-Prime. Paradigm presentation and fMRI-scanning was synchronised with a sync-box (Nordic NeuroLab AS, Bergen, Norway).
MR image processing
Post-processing of the functional and anatomical data was performed using Brain Voyager QX v. 1.6 (Brain Innovation, Maastricht, the Netherlands). The functional images were realigned to the first volume using trilinear interpolation. Physiological noise was removed with high-pass filter and linear trend removal. The data were smoothed using a 4-mm isotropic Gaussian kernel to facilitate inter-subject averaging and statistical analyses. The functional data was transformed into the standardised stereotactic reference system of Talairach and Tournoux Reference Talairach, Toumoux and Mousolino(31) to make group comparisons possible.
The 3D high-resolution TI-weighted images were corrected for B1-field inhomogeneities using a white matter (WM) presegmentation multiplicative method for enhanced automatic co-registration to functional time series and precise segmentation of the WM/grey matter (GM) boundaries. The T1-weighted images were then transformed into the standardised Talairach and Tournoux space Reference Talairach, Toumoux and Mousolino(31). Subsequently, the high-intensity voxels of the main arteries and cranial nerves were removed, the skull was stripped, low-intense subcortical GM and ventricles were filled, the cerebellum removed and the brain was cut at the level of the pons. The remaining image was sigma-filtered several times for homogenisation of GM and WM, producing a clear boundary between them, subsequently the WM was marked using a region-growing algorithm. The hemispheres were split and the WM of each hemisphere was reconstructed into a mesh, producing a 3D model of the GM/WM boundary. This mesh was morphed to give a smooth appearance of the hemispheres and imperfections were sought and removed from the model Reference Kriegeskorte and Goebel(32). Curvature information overlaid the meshes, colouring concave and convex surfaces in the mesh with different colours. The meshes from all participants were then subjected to a cortex-based alignment procedure Reference Dale, Fischl and Sereno(33), where each hemisphere was inflated to a sphere, distortions were removed and the sphere was registered onto a standard sphere with a constant number of vertices defining the model. Then, all standardised spheres from each hemisphere and participant were dynamically aligned to each other using a non-linear approach in a coarse-to-fine manner based on topographic curvature information. An average brain was created based on the hemispheric meshes and the sphere-to-sphere mapping results. This was used for co-registration of the functional data in Talairach space from the participants. A new time series, a mesh time-course, was then generated, using the cortical mesh created from the high-resolution 3D T1-weighted images as a starting point, where voxels included in the surface-based time series were those 1 mm central to the mesh and 3 mm outside the mesh, corresponding to GM.
BOLD signal-changes in the fMRI time series were analysed on a voxel-by-voxel basis fitted to a hemodynamic response function. The contrasts were calculated on mesh time-courses, so that only voxels from the functional time series belonging to the GM of the cortical surface were included in the calculations. All statistical analyses were done using a random effects analysis (RFX) in the general linear model. An independent group t-test was used to explore any significant differences between the BPD group and the matched controls in activity related to inhibiting proponent responses, NoGo > G o. In addition to the main effect (NoGo > G o), also the contrast Go > NoGo were explored in the entire sample (BPD + controls ). Correlation analysis for SR, SP and I7 were performed on a whole brain voxel-by-voxel basis and separately for the conditions NoGo > b aseline (fixation cross) and Go > b aseline. This was done to explore the neurobiological correlates to these psychometrically measured traits separately. Usually the NoGo > G o contrast is used in studies of inhibition and impulsivity, but areas such as the OFC is proposed to have anticipative qualities, and could be active during Go blocks as well as in NoGo blocks. Hence, a NoGo > G o contrast may fail to reveal OFC activation. False discovery rate (FDR) was set to q < 0.02 for the RFX and correlation analyses.
Results from I7, SPSRQ and response registration during fMRI-scanning were analysed in SPSS using independent sample t-tests, two independent samples non-parametric tests and non-parametric correlation analyses.
Results
Socio-demographic data, psychometric characteristics and task performance
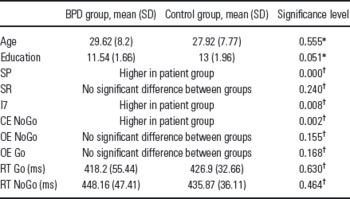
There were no significant differences in age or years of education between the BPD and the control group (Table 1). Patients had significantly higher SP and I7 scores (Table 1), but SR scores were similar in the two groups. Patients made significantly more commission errors in the NoGo blocks, but no significant group differences were found with regard to omission errors in the NoGo blocks (i.e. not responding when response was correct in the NoGo blocks) and omission error in the Go blocks (i.e. not responding in the Go blocks). No group differences were found with regard to RTs in NoGo and Go blocks (Table 1).
Socio-demographic data, psychometric characteristics and task performance in the BPD and control groups

Age, age at time of study, Ed, years of education; I7, impulsiveness, venturesomeness, empathy scale; CE NoGo, commission errors, failing by responding when not to respond, in NoGo blocks; OE NoGo, omission errors, failing by not responding when to respond, in NoGo block; Oe Go, omission errors, failing by not responding when to respond, in Go blocks; RT Go—reaction time of study participants in Go blocks; RT NoGo, reaction time of study participants in NoGo blocks; SR, sensitivity of reward; SP, sensitivity of punishment.
* Between group t-test, two-tailed.
† Mann-Whitney one-tailed non-parametric test.
Correlation analyses of the socio-demographic data, psychometric characteristics and task performance data were performed to reveal possible co-varying variables.
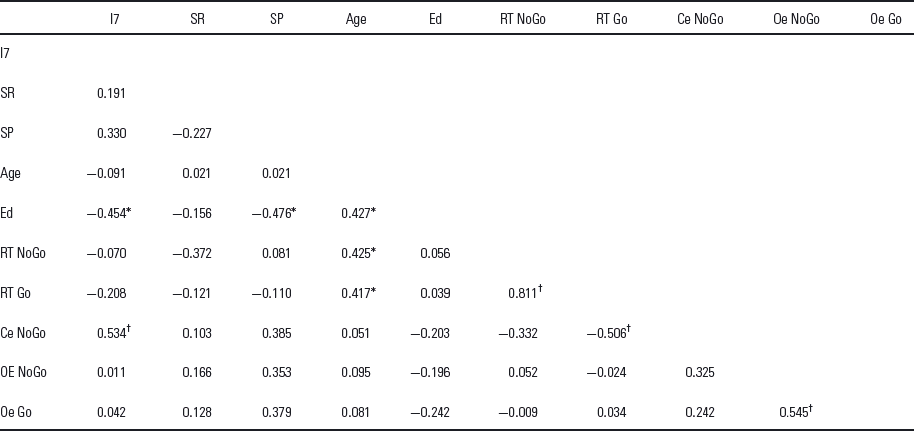
There was a significant positive correlation (p < 0.01) between I7 and commission errors in the NoGo blocks. Both I7 and SP were negatively correlated with years of education. Furthermore, age was positively correlated with years of education, and RT in both NoGo and Go blocks (Table 2). RT in the Go blocks and the commission of errors in the NoGo blocks were significantly negatively correlated (Table 2).
Pearson correlation analysis to capture covariating variables in the socio-demographic, psychometric and task performance characteristics in the entire sample
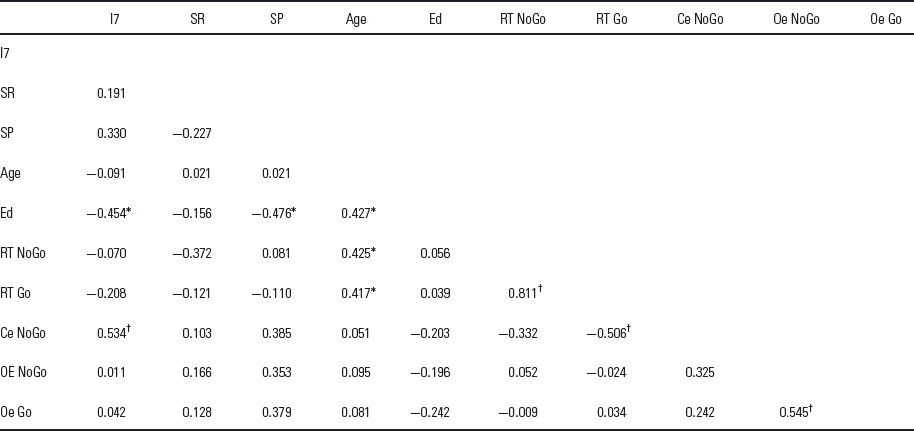
Age, age of study participants; Ce NoGo, commission errors in NoGo blocks; IVE, impulsiveness, venturesomeness, empathy scale; Ed, years of education in study participates; OE NoGo, omission errors in NoGo blocks; OE Go, omission errors in Go blocks; RT go, reaction time of study participants in Go blocks; RT NoGo, reaction time of study participants in NoGo blocks; SP, sensitivity of punishment; SR, sensitivity of reward.
* Pearson correlation analysis is significant at the 0.05 level (two-tailed).
† Pearson correlation analysis is significant also at the 0.01 level (two-tailed).
Differences between BPD patients and controls in the NoGo > G o contrast
The RFX exploring possible group differences in activation during NoGo > G o block between subjects with BPD and matched controls showed no significant group differences (FDR < 0.02). Other unplanned contrasts (Go > N oGo, NoGo > b aseline, Go > b aseline) likewise did not show any group differences when applying FDR.
Whole sample activity in Go-NoGo paradigm
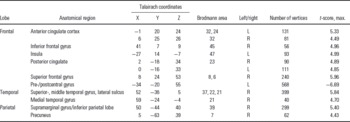
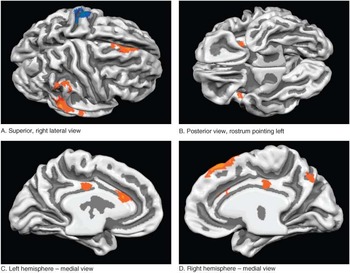
Whole brain activation related to inhibiting prepotent responses, i.e. NoGo > G o, was evaluated across the whole sample (both BPD patients and controls), and revealed widespread activation in both hemispheres: left and right ACC, right inferior frontal gyrus, left insula, left and right posterior cingulate gyrus, right superior frontal gyrus, left pre- /postcentral gyrus, right superior medial temporal gyrus, lateral sulcus, right medial temporal gyrus, right supramarginal gyrus and right precuneus (Table 3, Fig. 1). This activity was similar to previous reports using different variations of the present paradigm (Reference Horn, Dolan, Elliot, Deakin and Woodruff26,Reference Aron, Robbins and Poldrack34–Reference Konishi, Nakajima, Uchida, Sekihara and Miyashita40). The contrast Go > N oGo revealed increased activity in left primary sensori-motor hand area. This is expected as all letters in these blocks are responded to.
Coordinates of peak activity in NoGo > G o contrast in the entire sample of BPD and matched controls*

* A RFX of NoGo > G o was performed over the entire sample using FDR correction with q < 0.02.
Activation maps for the NoGo > G o-condition (yellow) and Go > N oGo (Blue) in the entire sample of BPD patients and matched controls (n = 30). Whole brain FDR correction q < 0.02.

Correlation analyses of neuronal activation and measurements of impulsivity
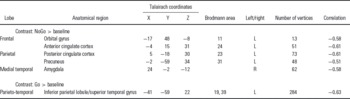
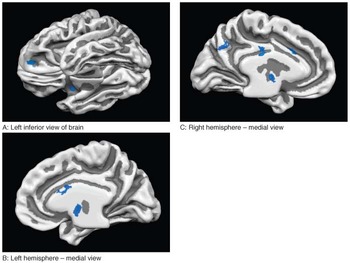
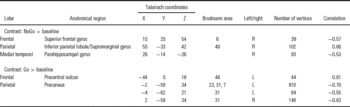
To uncover any relationship between impulsivity traits and NoGo > b aseline (fixation cross) activation, we performed a correlation analysis with I7, SR and SP scores and whole brain activity during NoGo > b aseline over the entire sample. I7 scores correlated negatively with several brain areas during response inhibition. Areas included the left orbital gyrus, left ACC, left posterior cingulate cortex, left precuneus, right amygdala and thalamus (Table 4, Fig. 2). I7 scores correlated negatively with activity in a cluster encompassing left inferior parietal lobe and the superior temporal gyrus (Table 4). SR scores correlated negatively with activity in left precentral gyrus and NoGo > b aseline activity (Table 5), and positively with activity in left middle and inferior frontal gyri in the Go > b aseline condition (Table 5). SP scores correlated negatively with activity in right superior frontal gyrus and right parahippocampal gyrus, but positively with activity in inferior parietal lobe, including the supramarginal gyrus (Table 6). Activity during the Go > b aseline condition and SP scores correlated negatively with precuneus activity and positively with activation in the precentral sulcus (Table 6).
Coordinates of peak activity correlated with I7 scores over the entire sample of BPD and matched control subjects (FDR < 0.02)

Brain activity during NoGo > baseline (fixation cross) displaying significant negative correlation with I7 scores shown in blue (n = 30). FDR correction q < 0.02.

Coordinates of peak activity correlated with SR scores over the entire sample of BPD and matched control subjects (FDR < 0.02)

Coordinates of peak activity correlated with SP scores over the entire sample of BPD and matched control subjects (FDR < 0.02)

Discussion
Inhibiting prepotent responses in a bock design Go-NoGo task engendered similar brain activity in BPD and matched controls, but behaviourally the BPD group had significantly more commission errors in the NoGo blocks. Moreover, the BPD group had increased I7 and SP scores indicating rash impulsiveness combined with increased SP.
Rash impulsiveness measured with I7 was significantly increased in women with BPD. This corresponds well with the type of impulsivity seen in this patient group, which can be described as a tendency to act rashly and without consideration of consequences. The finding is in line with previous evaluations of the I7 scale in the general population (Reference Caseras, Avila and Torrubia8–Reference Quilty and Oakman10). Furthermore, I7 scores were significantly positively correlated with commission errors during the NoGo block. Based on Bechara et al. Reference Bechara, Dolan and Hindes(3) increased rash impulsiveness is linked to abnormal activity in the OFC. In the present study, we showed a significant negative correlated between activity in OFC during response inhibition and I7 scores for the entire sample (BPD and controls). This finding gives further support for a link between OFC and rash impulsivity. The BPD patients in our study are more rash impulsive, but also more sensitive to punishment. This is not what one would predict based on Gray's theory, where increased BIS would inhibit impulsive BAS-driven behaviour. However, human studies have shown that impulsive subjects with damage to the OFC have hypoactive emotional responses (shown as diminished galvanic skin responses) when anticipating punishing stimuli, but that the emotional response is normal or enhanced to the actual experience of punishment Reference Bechara, Damasio and Damasio(41). This implies a dichotomy between perceived and anticipated experiences in persons. Hence, individuals can at the same time be unconcerned about the future (i.e. have increased rash impulsiveness), and still be neurotic to the present time stimuli (i.e. heightened SP).
I7 scores were also shown to correlate negatively with activity in a number of other regions; ACC, posterior cingulate cortex, amygdala and thalamus in NoGo blocks. Impulsivity and attentional control have been linked to activity in anterior cingulate, lateral orbitofrontal and inferior frontal gyrus (Reference Aron, Robbins and Poldrack34–Reference Konishi, Nakajima, Uchida, Sekihara and Miyashita40). Amygdala is considered central in triggering automatic affective responses, and activity in this system interacts with the impulsive system. The negative correlation between amygdala activity and I7 scores in the NoGo blocks implies that successful impulse inhibition involves interaction between the emotional system and systems involved in behavioural regulation. Emotional regulation is linked to BAS/BIS, but only SP, and not SR, was significantly different in the BPD compared to the control group. Moreover, I7 was positively correlated to commissions of error in the Go-NoGo task, and there was a trend showing positive correlations between both commissions and omissions of errors in both Go and NoGo blocks and the SP scores. We postulate that hyperactive BIS may interfere with active avoidance driven by BAS, and results in chaotic behaviour in demanding and aversive circumstances. Such inconsistent behaviour may be perceived as impulsive behaviour by a bystander. Smillie et al. Reference Smillie, Pickering and Jackson(42) claim that BIS does not directly control behavioural responses, but acts by inhibiting BAS-ongoing behaviour while directing arousal and attention to the source of the conflicting stimuli. Only in response to certain appropriate stimuli, such as conditioned stimuli associated with punishment, extreme novelty, high-intensity stimuli and innate fear stimuli, will BIS activity directly modulate behaviour. It is not to be expected that a Go-NoGo task will elicit such activation. Still, SP scores and activity during inhibition of prepotent responses correlated negatively with activity in regions connected to the emotional system; i.e. parahippocapal gyrus and superior frontal gyrus (Reference Avila, Parcet and Barrós-Loscertales43–Reference Pavuluri, Passarotti, Harral and Sweeney45). These findings suggest that subjects with high SP have impaired disinhibition of anxiety related to activity in the medial temporal, and disinhibition of emotions related to activity in the superior frontal gyrus. Together these findings demonstrate that emotional regulation and impulsivity are closely related. Moreover, SP correlated positively with activity in the right inferior parietal lobule. This region is active during error-processing Reference Hester, Fassbender and Garavan(46), implying that individuals with high SP are more attentive to errors. In the Go blocks, SP scores were negatively correlated with activity in precuneus bilaterally, and positively with activity in left precentral sulcus. Precuneus is among the most active cortical regions during the conscious resting state, but the activation here declines during sleep and goal-directed cognitive processes or perceptual tasks Reference Cavanna(47). Our results could thus be interpreted as low SP individuals being more relaxed during the Go blocks. The finding that right superior frontal gyrus, right inferior parietal lobule and precuneus were active both in the whole sample whole brain analysis of the NoGo > G o contrast, as well as correlated with SP scores in both Go and NoGo blocks further support a role for SP in response inhibition. There was no similar overlap of activity for SR in the correlation analysis or in the activity in the NoGo > G o contrast.
SR was not a sensitive marker for impulsivity, and did not differentiate between BPD and controls. Furthermore, SR score did not correlate with any of the behavioural measures in the present study. However, to elicit SR the stimuli may need to be perceived as appetitive for all participants Reference Avila, Parcet and Barrós-Loscertales(43). Any single aversive stimulus can transform an appetitive context into an aversive one. One may argue that responding to letters on a screen may be appetitive, but probably only for nerds. Still, over the entire sample we did find a negative correlation between SR scores and activity in precentral gyrus in NoGo blocks, and a positive correlation between SR scores and activity in medial and inferior frontal gyri during Go blocks. This prefrontal region is considered to participate in reward evaluation when the received reward is congruent with the expected Reference Avila, Parcet and Barrós-Loscertales(43). The Go blocks represent such situations where the received rewards (i.e. letters) are congruent with the expected.
Previous studies on BAS have focused on appetitive behaviour. Based on the current study, the role of BAS in active avoidance may be more important and represents an avenue for increased understanding of BAS in psychiatric conditions. The heightened SP observed in the BPD group demonstrates increased BIS activity, which can result in exaggerated anxiety and shame in challenging situations. Hyperactive BIS can also cause emotional inhibition and thus induce a chronic feeling of emptiness and anhedonia, as a result of a constant BAS-suppression.
Whole brain activity in the Go-NoGo task was similar in the BPD and control group, although behavioural differences were found. A Go-NoGo paradigm measures primarily disinhibition and may, therefore, not be ideal for exploring problems related to the BPD syndrome. The heterogeneous nature of BPD syndrome may also have precluded detection of small differences. Also possible comorbidity (e.g. depression, post-traumatic stress disorder) and drug use may have confounded the results. In addition, the block design of the experiment may have interfered with the detection of minimal, short lasting variations in brain activity between the groups. It has been reported that BPD and patients with antisocial personality disorder have more bilateral and extended pattern of activation across the medial, superior and inferior frontal gyri extending to the ACC in a Go-NoGo task, but no correction for multiple comparisons or FDR was used Reference Völlm, Richardson and Stirling(48). Moreover, the BPD patients in our study were only females and had no history of violence to our knowledge.
The strong negative correlations between I7 and SP scores, and years of education were interesting, but whether education hones impulsivity or rash impulsivity impedes the chance of succeeding in school remains unanswered. However, education obviously demands the ability to postpone sudden urges and requires a certain emotional stability and robustness.
Conclusions
The current results showed that the neuronal correlates of inhibition of prepotent responses in a Go-NoGo task were similar in females with BPD and matched controls. The BPD group, however, has increased I7 scores, indicating rash impulsiveness and heightened SP, related to increased BIS activity. The finding that I7 scores correlated negatively with OFC activity in the NoGo > B aseline condition underscores the importance of OFC hypoactive in rash impulsivity. Both I7 and SP scores were negatively correlated with areas involved in emotional regulation located in the medial temporal lobe and in prefrontal midline structures. Together these findings demonstrate that rash impulsivity and emotional (dys)regulation coexist and contribute to the impulsive behaviour-observed BPD psychopathology.
Acknowledgments
We would like to thank Dr Gunilla K. Fosse for recruiting patients to this project.