


Introduction
Ice-flow velocity is a fundamental measurement for the study of ice dynamics. Even with the advent of the global positioning system, in situ velocity measurement remains an expensive, logistically difficult and often dangerous task that is capable of yielding only a limited number of measurements. Interferometric synthetic aperture radar (InSAR) has now become a well-established means of collecting ice-velocity measurements at high resolution and with accuracies of a few ma–1 (Reference Joughin, Fahnestock and BamberJoughin and others, 2000). A major limitation to the application of this technique has been the limited availability of interferometric data.
In September 1997, RADARSAT was maneuvered to a south-looking orientation to collect the first complete SAR coverage of Antarctica (Reference JezekJezek, 1999). During this first Antarctic Mapping Mission (AMM-1), data were collected for 30 days. With the 24 day repeat cycle of RADARSAT, AMM-1 provided 6 days of repeat-pass interferometric data. These remain the only InSAR data collected south of 80˚ S. A second Antarctic Mapping Mission (AMM-2) was conducted in the fall of 2000 (Reference JezekJezek, 2002). Due to concerns over the health of the spacecraft, data were collected from a north-looking orientation, which limited coverage to north of 80˚ S. Three full cycles of data were collected along both ascending and descending orbits, making this the most comprehensive InSAR dataset collected for ice motion.
While AMM-1 and -2 provided a wealth of data, there are several challenges involved in processing RADARSATdatato estimate velocity. Many of the problems relate to the fact that 24 days is a long period over which to make interferometric measurements on an ice sheet. Reasonable correlation levels can usually be obtained in low-accumulation areas (e.g. <15 cma–1). In many high-accumulation areas (e.g. >30 cma –1), however, interferometry over 24 days will often fail. Fortunately, accumulation rates over much of Antarctica are small. Other factors, such as the level of katabatic winds,may also affect the correlation. Even in areas where 24 day interferometry works well, levels of correlation are considerably lower than for 1 or 3 day European Remote-sensing Satellite (ERS) SAR data.
A 24 day repeat cycle provides a strong sensitivity to displacement, with one interferometric fringe roughly equivalent to 1ma–1 of horizontal ice motion perpendicular to the satellite track. This yields good accuracy in slow-moving (575 to 100ma–1) areas, where the phase can be unwrapped. In fast-moving areas (>100ma–1), phase unwrapping is much more difficult; in many cases, no phase measurement can be made. Thus, with conventional 24 day interferometry, velocity estimation is largely limited to slow-movingareas. Fortunately, an alternate technique that relies on the interferometric correlation has been developed (Reference Gray, Mattar, Vachon and SteinGray and others, 1998; Reference Michel and RignotMichel and Rignot, 1999). This technique, called speckle tracking, takes advantage of the ability to determine with sub-pixel accuracy the displacements (both across- and along-track offsets) between scenes in an interferometric pair using the cross-correlation function of the speckle patterns, which are sharply peaked. Because matches are based on speckle rather than visible features (i.e. crevasses), speckle tracking, like conventional interferometry, is limited by temporal and other sources of decorrelation. While this technique can provide data in many cases where conventional interferometry fails, the measurements have poorer resolution (comparable to the window size used for matching) and accuracy.
This paper describes a set of algorithms that have been developed to generate velocity mosaics using a combination of conventional interferometry and speckle tracking. The solutions to several processing problems encountered with RADARSAT are described. A mosaicking procedure is described for seamlessly producing velocity maps from a combination of conventional interferometry and speckle-tracked data. In addition to producing a velocity map, this procedure provides a spatially varying estimate of the error. The technique is demonstrated using RADARSAT data collected over Lambert Glacier and Amery Ice Shelf during AMM-1 and -2. While the focus here is on RADARSAT data, these algorithms are equally applicable to other sources of InSAR data such as ERS and ENVISAT.
Velocity Estimation
Generation of velocity maps using SAR interferometry is a computationally intensive task. For large areas hundreds of gigabytes of data must be processed to SAR images, combined to produce interferograms, speckle-tracked and mosaicked to obtain the final velocity product. This section gives a description of these steps, including the adaptations to standard algorithms that have been made to accommodate RADARSAT data.
SAR processing
Fine azimuth resolution (∼5m) is achieved in SAR images by correlating the data with the expected Doppler history (reference function) for each pixel. The Doppler centroid is the frequency about which the Doppler bandwidth is centered. If the Earth did not spin, the Doppler centroid would be zero for a radar looking broadside. The motion of the Earth, however, shifts the Doppler spectrum to yield a non-zero, latitude-varying Doppler centroid. ERS-1 and -2 use yaw-steering to continually adjust their pointing to compensate for the Earth’s motion and achieve a nearly zero Doppler centroid that exhibits only minor variation along track. ERS data are well suited to most SAR processing algorithms, which process an entire image using a fixed Doppler centroid.
RADARSAT operates with a nominally broadside imaging geometry so that the Doppler centroid varies significantly with latitude, particularly near the poles. This can degrade image quality when there is no compensation for the shift in Doppler centroid, limiting the portion of a data take that can be processed as single image (e.g. <200 to 300 km). Breaking a data take into several small frames makes later processing considerably more difficult. To avoid this limitation, a method is needed that allows along-track Doppler updates.
Atypical range-Doppler processor creates an image as a sequence of patches. Simply updating the Doppler centroid for each patch is a non-trivial solution, because this changes the image geometry at each patch, leading to discontinuities at patch boundaries without proper compensation. Instead I used a simpler approach that allowed easy modification of an existing version of the Gamma SAR processor (Reference Werner, Wegmüller, Strozzi, Wiesmann and Sawaya-LacosteWerner and others, 2001).
Doppler bandwidth is limited by the width of the antenna pattern. The pulse repetition rate of the radar is set to adequately sample this bandwidth. To avoid changing the patch geometry, I assumed a fixed Doppler centroid for the entire image, but with a reference function that has twice the bandwidth (length) imposed by the antenna pattern. This double-bandwidth reference function, however, is not adequately sampled. To avoid aliasing, at each patch the reference function is bandpass-filtered to use only an adequately sampled portion of the bandwidth centered about the true Doppler centroid. This has the effect of compressing the energy in the actual Doppler bandwidth, while maintaining the geometry of a fixed Doppler centroid throughout the image. The length of the expanded reference function is arbitary. This double-length reference function allows the Doppler centroid to vary by roughly 1250 Hz along a RADARSAT image, allowing roughly 1000 km of SAR data to be processed as single image. The penalty is a reduction in processing efficiency because twice as many samples are lost at the end of the patches during the convolution. Large patch sizes can reduce this computational penalty to 10–20%.
A further limitation of RADARSAT is drift in the instrument pointing from pass to pass, which translates directly into a difference in the Doppler centroid from image to image. When this occurs, the portions of the Doppler spectrum that do not overlap are not coherent and effectively act as noise when creating an interferogram. To overcome this limitation, the processor was modified so that each image in an interferometric pair is processed with knowledge of the Doppler history of the other image so that only the overlapping portions of the Doppler spectra are retained. A linear function was used to represent the along-track variation of the Doppler centroid for each image, but a higher-order polynomial could be substituted where needed. This additional filtering is typically taken care of during interferogram generation (Reference Werner, Wegmüller, Strozzi, Wiesmann and Sawaya-LacosteWerner and others, 2001), but it was included in the SAR processing here since the data are also used for speckle tracking. This processor has been used to produce viable interferograms from data with as little as 20% spectral overlap.
Interferogram generation
Interferograms were produced with the Gamma software (Reference Werner, Wegmüller, Strozzi, Wiesmann and Sawaya-LacosteWerner and others, 2001), with minor modifications to accommodate the along-track variation in Doppler. Because displacements of several pixels can occur over 24 days, additional modifications were made to co-register the images using offsets on a 1km grid rather than parameterizing each component of the offset field as a plane.
To remove the 2π ambiguity in the interferometric phase, the data were unwrapped with a variation (Reference JoughinJoughin, 1995) on the branch-cut algorithm (Reference Goldstein, Zebker and WernerGoldstein and others, 1988). Many fast-moving areas in 24 day data cannot be unwrapped. Furthermore, the interferogram can get broken into several unwrapped but isolated regions. These disconnected regions all have relative phase offsets with respect to each other, which must be resolved. In many cases, these ambiguities can be removed using the speckle-tracked range offsets, which are an absolute but noisier and lower-resolution estimate of the same range difference as the phase (Reference Madsen and GiglioMadsen, 1995). This method is used in regions where there are sufficient data to overcome the errors in the range-offset data. Areas where an accurate estimate of the ambiguity cannot be obtained are discarded. Tests reveal that this method occasionally misses the true ambiguity by 1–2 multiples of 2π. For 24 day data, however, the error is relatively small (i.e. 1–2ma–1) and is often reduced further during baseline estimation.
After the unwrapping procedure there may be several holes in the data. Interpolation is used to reduce smaller holes. This is done by first locating all the pixels in a given hole. A decision is then made whether to fill the hole based on a user-selected threshold for the area of the hole. Holes are filled using the weighted sum of pixels on the hole border. The weights are determined as the inverse of the squared distance between the point being filled and each border point. Large holes are left unfilled.
The final step in preparing the interferograms consists of baseline estimation. Baseline parameters are determined using a least-squares fit to several control points of known velocity and height in each interferogram (Jough in and others, 1996).
Speckle tracking
The cross-correlation matching operation to estimate the range and azimuth offsets can be performed using the complex or detected-amplitude images, with each method providing different advantages. For low-correlation regions, the complex cross-correlation function is more strongly peaked. Reasonable matches can be achieved with complex correlation down to about 0.2 with a relatively small patch size (e.g. 24 by 24 pixels). A much larger box size is needed to achieve a match with low-correlation amplitude data. The disadvantage to complex matching is that phase gradients (i.e. the interferometric phase) across the patches being matched can reduce or even eliminate the correlation peak, making it difficult to achieve matches in regions with high shear or steep topography. Amplitude matches are unaffected by the phase and can provide good matches in such regions.
To retain the advantages of both types of matches, I developed a matcher that uses a hierarchal approach. At each point, a complex match is attempted first. To reduce the impact of phase gradients, the local phase gradient is estimated using the interferogram and removed from one of the patches. Although the patch size used for the matches is 48 by 48 pixels, a Hanning window function is applied to the data, which reduces the size to approximately 24 by 24 pixels. The use of a small patch size helps minimize the effects of phase gradients. A decision is made to accept or reject the match based on an empirically determined correlation threshold of 0.18 and a limit on the range of acceptable offset values.
When a complex match fails, an amplitude match is attempted using 64-by-64 pixel patches. A correlation threshold of 0.07 is used to accept these matches. If the match fails, then a third attempt is made using amplitude cross-correlation, but with a patch size of 192 by 192 pixels. If this fails, the matcher gives up and records a no-match value.
Before matching, any Doppler carrier on the data is estimated and removed for each patch, and the data are oversampled by a factor of two. These steps avoid aliasing that can lead to biases in the estimates. After each cross-correlation, the peak is oversampled by a factor of 10. The effect of the combined oversampling operations leads to a match resolution of 0.05 pixels. The matches are performed every 24 by 24 pixels.
Once the matches have been completed, they are run through a program to cull out bad matches. At each point, the median for a surrounding 9-by-9 box is computed. Points that differ from the median by some threshold are discarded. The data are then smoothed with a moving-average filter with dimensions selected by the user based on the quality of the data and resolution requirements. For fine-beam RADARSAT data, typical filter dimensions are 6-range by 9-azimuth offset pixels, which yields a resolution of roughly 1km. Averaging can reduce noise and quantization error in many cases to 50.01 pixels. Once the culling is complete, small holes are filled using the interpolator described above.
In the culling process the offset sample variance is estimated for a box surrounding each pixel. To remove the effects of trends in the data, a plane is fit to the data in each box and then subtracted from the data. The variance estimate is then reduced to account for the smoothing by the moving-average filter. This is straightforward for the 24-by-24 complex matches computed on a 24-by-24 pixel grid, because the estimates are independent and the variance is reduced by one over the number of samples averaged. Since amplitude matches overlap each other on the 24-by-24 pixel grid, the effective number of samples averaged, Neff, is less than the actual number averaged, Navg. To account for this difference, the effective number averaged is computed as
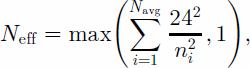
where ni is the size of the box used for the match. A minimumof at least one effective look is assumed. If all the pixels are complex matches, then Neff = Navg.
The offset-variance estimates described yield local error estimates, but fail to resolve longer-wavelength errors. This is a reasonable characterization of the range offset errors. For the azimuth offsets, however, there are longer-wavelength errors that appear as streaks across the azimuth offset estimates with along-track variability of several kilometers. These streaks are likely related to ionospheric effects (Reference Gray, Mattar and SofkoGray and others, 2000). Locally these errors can be significantly larger (e.g. 0.1–0.2 pixels) than the image-wide estimate (0.02–0.04 pixels). It is difficult, however, to reliably estimate the spatial pattern of the errors. As a result, these errors are accounted for by using an estimate of the streak variance for the entire image, which is added to the sample variance estimate. In the example below, a value of 0.03 pixels was used, which represents a rough estimate of the error averaged over all data takes. This value is larger than most other errors so that the weighting will tend to de- emphasize azimuth offset data in areas where more reliable range offset or phase data are available.
Velocity-map generation
Once the interferograms and speckle-tracked offset fields are computed, they can be used to estimate velocity. This is done by combining the phase information from overlapping ascending and descending pairs (Reference Joughin, Kwok and FahnestockJoughin and others, 1998), by combining phase with azimuth shift data (Reference JoughinJoughin and others, 1999) and finally by combining range and azimuth offset data to yield velocity (Reference Gray, Mattar, Vachon and SteinGray and others, 1998; Reference Michel and RignotMichel and Rignot, 1999). The mosaicking process begins by setting up output buffers for each of the velocity components. A polar stereographic projection with 0˚ rotation and a standard latitude of 71˚ is used for the output grid. Data are typically gridded at 0.5–1km. At any point in the output there may be data from three potential sources: phase/phase, phase/offset and offset/offset.
The program begins by estimating the velocity using the phase/phase data. For each ascending image, the program loops through the descending images to find the areas of overlap. The velocity in these regions is estimated using the method described by Reference Joughin, Kwok and FahnestockJoughin and others (1998). Each component of the result is then weighted and added to the output buffer. The weighting factors for the two velocity components, which are described below, are accumulated in separate buffers.
The phase/offset estimates are determined next, with velocity determined using the interferogram and accompanying azimuth offset data. The range component is computed using the phase along with the slope, which is used to compensate for the vertical component of motion (Reference Joughin, Kwok and FahnestockJoughin and others, 1996). There are geometric effects in the azimuth data that are unrelated to surface motion. A three-parameter model (similar to a plane fit) for the along-track variation of the non-surface-motion-related azimuth offsets is solved using a least-squares fit to the control data. The result is used to correct the azimuth offset data so that only a simple scale factor is needed to solve for the azimuth velocity component. The resulting velocity estimate is still in the radar coordinates, so a rotation is applied to transform the data to the output grid. The results are then weighted and summed in the output buffer.
Finally, the velocity is determined using both the range and azimuth offset data (offset/offset). This procedure is similar to the phase/offset estimate, except that the range difference is determined using offsets rather than phase. A separate baseline fit is used for the range offset data. This fit uses a slightly different baseline model since the constant to determine absolute values is different for the range offsets and phase. This separate baseline fit also helps mitigate any small systematic differences that may exist between the offset and phase estimates of the range difference.
As mentioned above, individual estimates are weighted and summed in an output buffer, so for the vx component the data are summed as
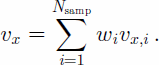
If the data are all statistically independent, then a minimum variance estimate is obtained by using weights, wi, that are proportional to the inverse variance,  Thus, with modifications described below, Equation (2) is used to determine the weights. First, the variances for each velocity component are determined in the radar coordinates. These results are used to determine the variances and weighting factors for the data in the output coordinates. The weights are accumulated in separate buffers so the results can be used to renormalize the final results, forcing the final weights to sum to one.
The variances for the offset data are estimated by the culling program as described above. In the absence of other sources of error, the phase variance is determined by the interferometric correlation. Other sources of error, such as tropospheric water vapor (Reference GoldsteinGoldstein, 1995), are more difficult to characterize and are often larger than phase noise due to decorrelation. As a result, a nominal value of π2 rad is used for the phase variance, which in most cases overstates the error.
The minimum variance estimate assumes that the averaged samples are independent. When phase/phase and phase/offset estimates are summed, the data are not independent. The same is true for phase/offset combined with offset/offset. To account for the possibility of double averaging, the variances of the phase estimates are doubled for the phase/phase estimates, since the corresponding phase/offset data will, in most cases, also be estimated. Similarly, during the phase/offset estimation, the program checks whether a velocity estimate has already been made for the current estimate. If so, it assumes it was a phase/phase estimate and doubles the variance estimate. Doubling the variances in this fashion does not perfectly account for double averaging since the program does not keep track of the full history of what data have been summed at each point. When the program errs, it is more likely to assume that double averaging takes place, so the error tends to be over- rather than underestimated. A similar procedure is used to avoid double-averaging the phase/offset and offset/offset combinations. There are cases where the phase/phase estimates can result in double averaging (e.g. one ascending pair with two overlapping descending images). Avoiding these errors would require an additional buffer to track the history of each image used in the velocity estimate. For the present, this feature has not been incorporated, as such cases are reasonably rare with the amount of data typically available.
While the weighting method described above is designed to achieve a minimum variance estimate, it may be sub-optimal with respect to other factors. In particular, a discontinuity at a data-take boundary is a non-physical result and can lead to problems when attempting model inversions. As a result, additional weighting is employed to feather the data and redistribute local errors over a wider range. As the velocity is estimated for a data take or datatake pair, the result and initial weights are saved in a temporary buffer. An additional weighting function is used to apply a linear taper from the edge of the data to some distance from the edge. For example, if the feather length is 20, then pixels on the edge are weighted by 0, pixels within 20 pixels of the edge are weighted linearly from 0 to 1, and interior pixels by 1. The feathering weights are used to update the initial weights in the temporary buffers, and the results are added to the weight buffers.
Error estimation
The error at any point depends on the type of data used (offset or phase) and the number of samples averaged. This error can have significant spatial variability, so it is important to have an estimate of the errors at each point. Since the variances are available at each point, it is a simple matter to estimate the variance for the overall weighted average. This is done to produce an error map with the 1σ errors for each velocity component.
Lambert/Amery Velocity Map
As an example of the techniques described above, Figure 1 shows a map of velocity for Amery Ice Shelf, Lambert Glacier and several other outlet glaciers. The map indicates speeds of nearly 750 ma–1 just above the grounding line at the confluence of Lambert, Fisher and Mellor Glaciers. As the confined shelf widens downstream of the grounding line, flow speed decreases to roughly 350ma–1 at 200–300km from the front. Near the front, the ice shelf begins to act more as an unconfined shelf, with speed increasing to over 1200ma–1 at the front as longitudinal stresses begin to dominate over lateral drag. Further discussion of the glaciological aspects of these data is beyond the scope of this paper.
Flow velocity for Lambert, Mellor, Fisher and several other glaciers feeding the Amery Ice Shelf. Speed is color-coded, and white arrows are used to display subsampled velocity vectors. The projection is polar stereographic with a standard latitude of 71˚ and rotation of 0°. The image dimensions are 911km by 687 km. Imagery © Canadian Space Agency (1997, 2000).
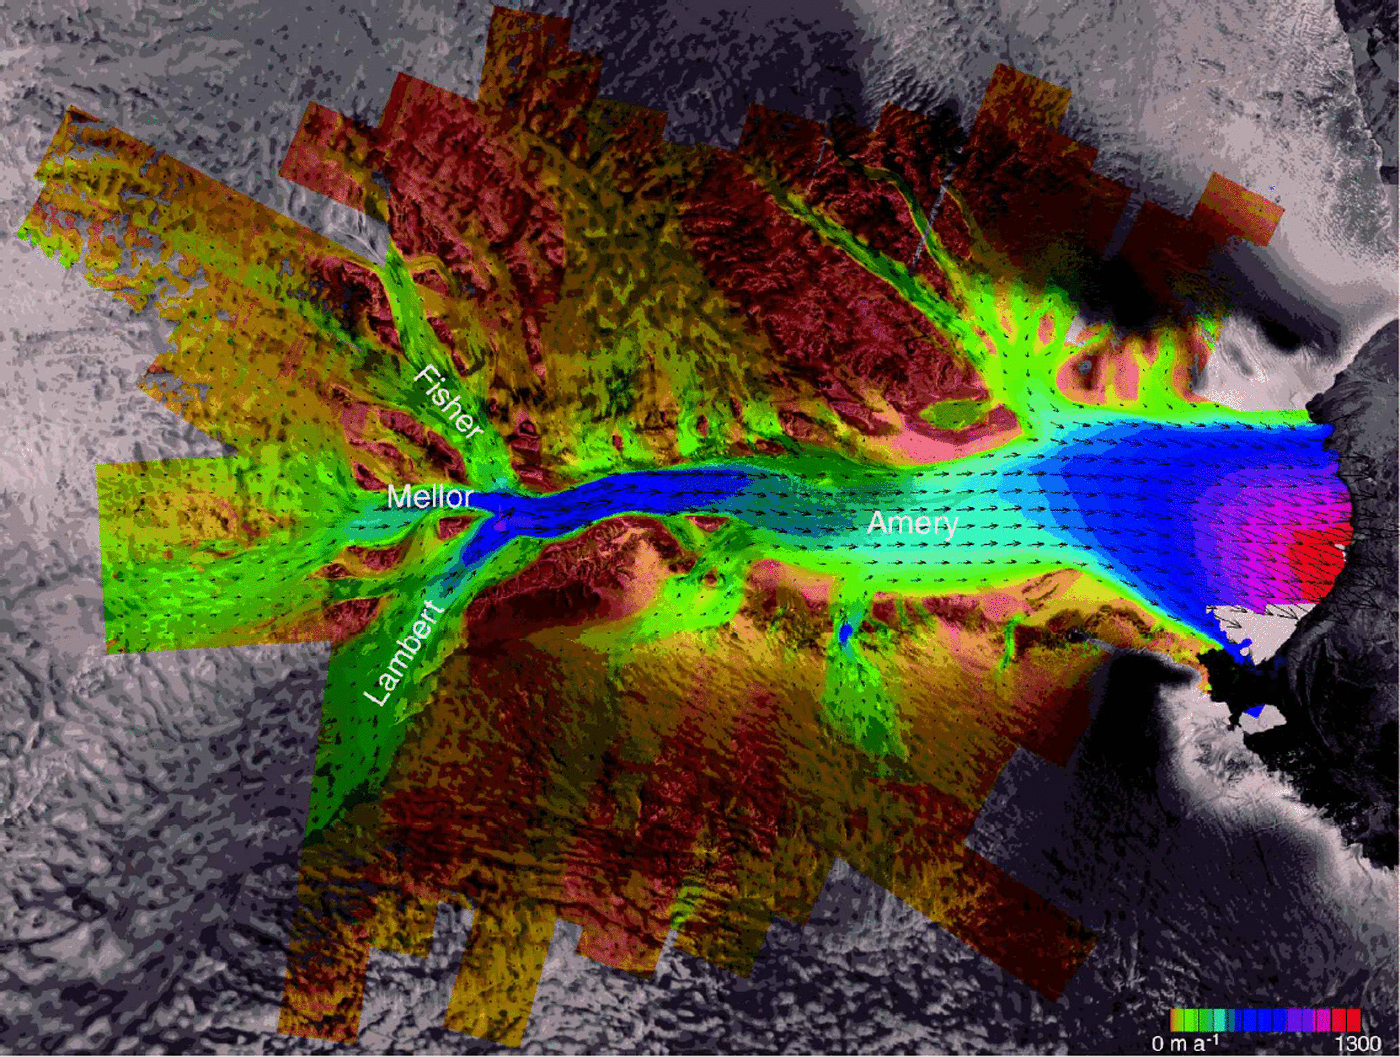
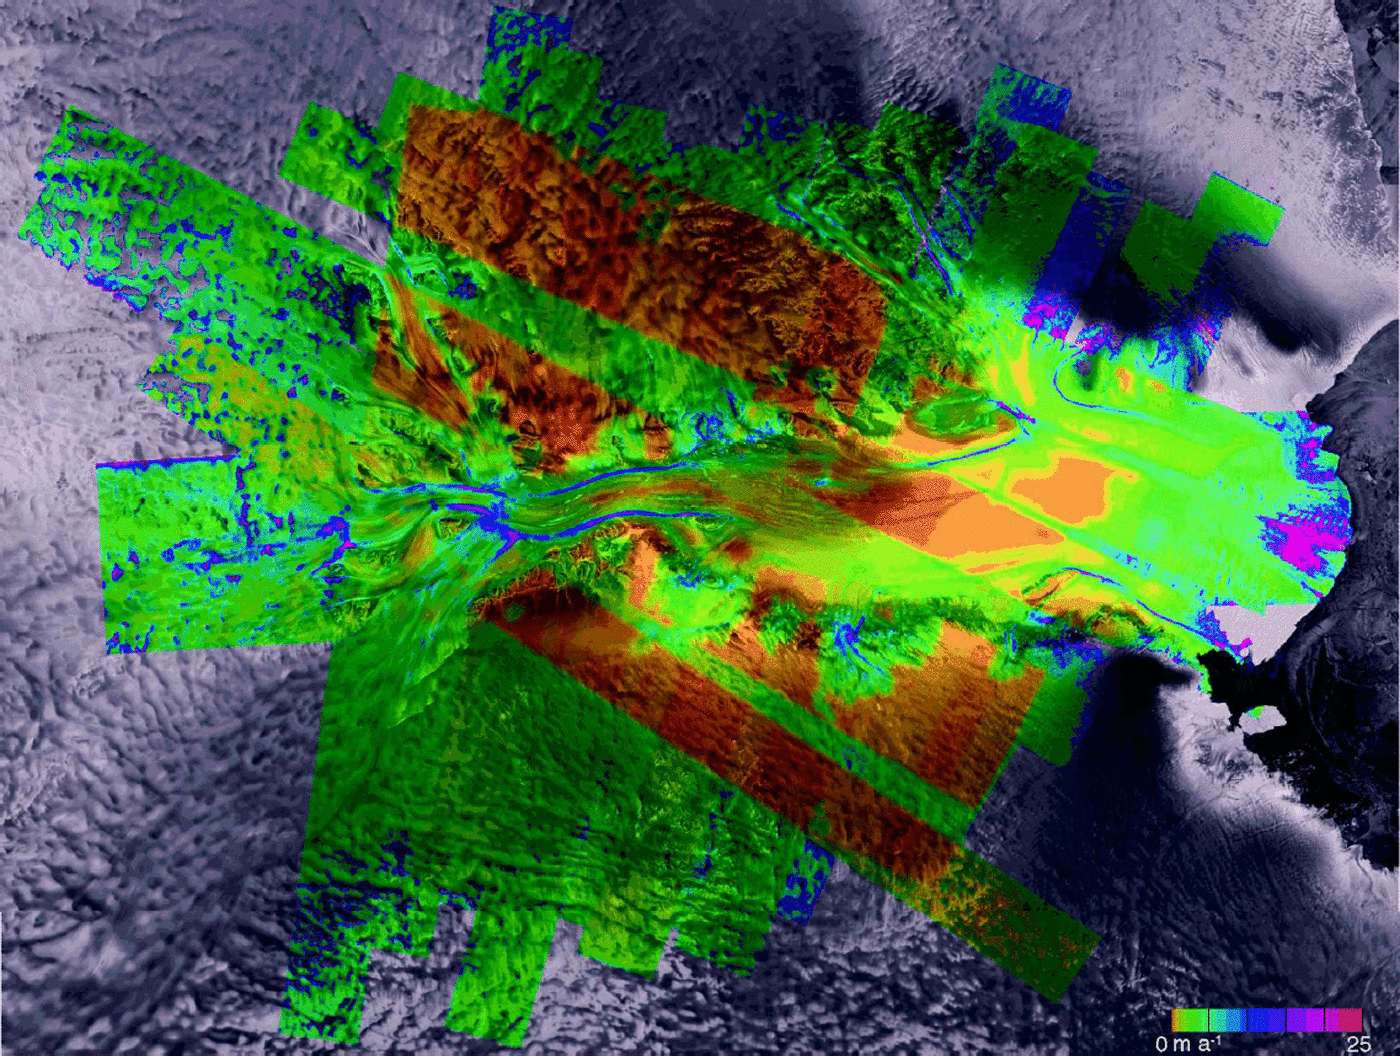
The map in Figure 1 was derived using 26 interferometric pairs collected during AMM-2 and one pair collected during AMM-1. The data did not correlate near the front of the shelf in the AMM-2 data, so the map largely reflects the position of the shelf during AMM-1 in September–October 1997. Figure 2 shows an estimate of the magnitude of the velocity error.
Magnitude of velocity error for velocity map shown in Figure 1. Imagery © Canadian Space Agency (1997, 2000).
Tidal displacement on the shelf is not taken into account in the generation of velocity or velocity-error estimates. The range of tidal displacement on Amery Ice Shelf is about +1m (Reference Padman, Fricker, Coleman, Howard and ErofeevaPadman and others, 2002), which is significantly less than for Filchner–Ronne Ice Shelf or the Siple Coast section of the eastern Ross Ice Shelf. While this could lead to worst-case errors of 30–50ma–1, examination of overlapping velocity estimates indicates that the 24 day tidal differences in these data lead to considerably smaller errors (a few ma–1). Averaging of multiple swaths further reduces this error, so neglecting the tide does not have too significant an impact on this dataset. The velocity estimation program can correct for tidal displacements, and future versions will be modified to use corrections from tidal models (e.g. Reference Padman and KottmeierPadman and Kottmeier, 2000; Reference Rignot, Padman, MacAyeal and SchmeltzRignot and others, 2000).
Discussion
Figure 2 illustrates the variability in errors from velocity estimates derived using different methods. In areas where phase data are available from both ascending and descending orbits, the estimated errors are typically <1ma–1 (e.g. brown regions in Fig. 2). In other areas the errors generally fall below about 5ma–1. Near the shelf front, the errors approach 20 ma–1.These large errors occur for two reasons. First, while most of the map was created with fine-beam RADARSATdata, the area near the front was estimated using standard-beam data, which have approximately one-third the range resolution and have errors in the range component that are larger by a factor of 3. Second, the data had exceedingly poor correlation and were right at the limit where acceptable speckle-tracking matches could be obtained.
The errors are also larger along some of the shear margins shown in Figure 2. Some of this increase in error may be real, as shear can decorrelate data. Even with good correlation, it is hard to estimate a match over a patch where there is a strong velocity gradient. Some may also be an artifact of the error estimation procedure. As described above, a plane fit is used to help remove the effects of true displacement before estimating offset variance. It is likely that at shear margins residual displacements are factored into the variance estimates so that the errors are overstated.
The estimation of velocity errors also does not account for errors in the estimate of the baseline. In the vicinity of Lambert Glacier, where there are many ice-free areas for control that are well distributed over a SAR scene, these errors should be small. This is confirmed by the good agreement in the data at swath overlaps. For other areas, where control data are more limited, baseline errors can be significant.
Summary
The data in Figures 1 and 2 serve as an illustration that the algorithms described above can be used to create large-scale velocity and velocity-error estimates using a combination of conventional interferometry and speckle tracking. Other than the availability of suitable datasets, there is no limitation to these algorithms being applied to much larger regions or even an entire ice sheet.
Acknowledgements
Discussions with S. Madsen led to the expanded reference function used in the SAR processing, and the feathering techniques are based on unpublished work by S. Shaffer. C. Werner contributed the original SAR processor used for the raw signal data. Much of this work was inspired by the early RADARSAT speckle-tracking results of A. L. Gray and K. E. Mattar. The paper was improved by the comments of J. J. Mohr and A. L. Gray. The L0 SAR data were provided by the Canadian Space Agency and the Alaska SAR facility. Finally, the RADARSAT data would not have been collected without the efforts of K. C. Jezek and the rest of the AMM-1/-2 teams who labored hard to overcome the many obstacles to two successful missions.



