

INTRODUCTION
The Bay of Douarnenez in western Brittany is a shallow bay and is partially sheltered in the north, but widely open to the Iroise Sea and exposed to its swells in the south and east. Swell and currents result in many different biotopes. Echinoderms are very diverse and dominate several benthic assemblages (Toulemont, Reference Toulemont1972; Bodin et al., 1985). In this ecosystem, some echinoderms show high interannual population fluctuations, particularly the starfish Asterias rubens (Linnaeus, 1758), Marthasterias glacialis (Linnaeus, 1758) and Astropecten irregularis (Pennant, 1777). The fluctuations of these populations, together with the potentially causal environmental parameters were monitored over about ten years (1979–1988), and are discussed by Guillou (Reference Guillou, Barnes and Gibson1990, Reference Guillou1996). The starfish population increased massively from 1983 to 1984; so much so that production estimates for bivalves and primary carnivores suggest only 50% of the food requirements of the asteroids could have been met by the production of their potential prey, the bivalves (Guillou, Reference Guillou1996). A drop then occurred in primary carnivorous starfishes, which led to the re-establishment of the trophic equilibrium. Although no new starfish population increases have been recorded since this period, scientists were recently alarmed by the increase of filter-feeding ophiuroids on various sea bottom types in the bay.
A population outbreak of the ophiuroid Ophiocomina nigra (Abildgaard, 1789) was recently recorded in the near Bay of Brest (Blanchet-Aurigny et al., Reference Blanchet-Aurigny, Dubois, Hily, Rochette, Le Goaster and Guillou2012). The purpose of this study was to see if any changes had also occurred in the diversity and density of ophiuroid species in the Bay of Douarnenez. Two surveys were carried out, in October 2008 and February 2011, in order to assess the densities of the ophiuroids Ophiocomina nigra and Ophiothrix fragilis (Abildgaard, 1789) in the bay. The results should be discussed in the light of previous data obtained by different echinoderm surveys in the 1980s.
MATERIALS AND METHODS
Bay of Douarnenez
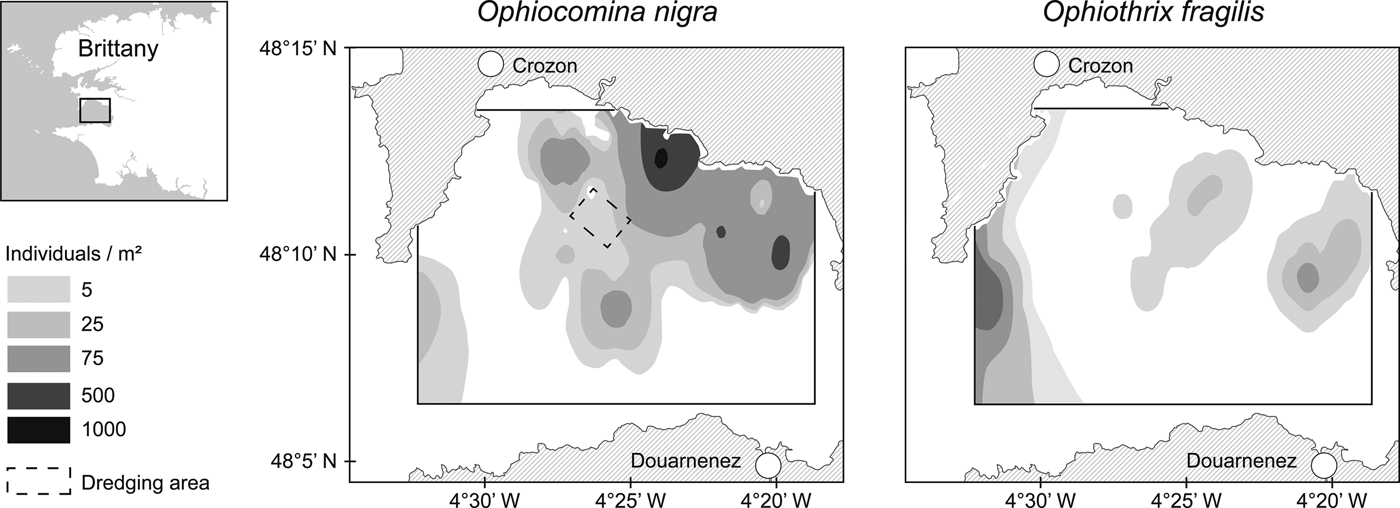
The geomorphology, sedimentology and hydrodynamic aspects of the bay have already been described in several papers (Hinschberger, Reference Hinschberger1970; Birrien, Reference Birrien1987; Augris et al., Reference Augris, Ménesguen, Hamon, Blanchet, Le Roy, Rolet, Jouet, Véron, Delannoy, Drogou, Bernard and Maillard2005; Guillou N., Reference Guillou2007). Toulemont (Reference Toulemont1972), Chassé & Glémarec (Reference Chassé and Glémarec1976) and Blanchet et al. (Reference Blanchet, Chevalier, Gaffet and Hamon2004) made the link between the various types of sea bottom and their corresponding benthic fauna. The highest biomass of echinoderms in the 1980s occurred in the centre of the bay, in an area where a gyre current produces a heterogeneous muddy sand bottom (Bodin et al., 1985) (Figure 1). The mean grain size of the sediment in this area varies between 125 and 500 µm with a 1–10% silt content (particles <63 µm). The annual water temperature range is 8–16°C, with a salinity of about 35. A coastal thermohaline front generally forms at the entrance of the bay from May to September.
Interpolated distributions of densities of Ophiocomina nigra and Ophiothrix fragilis for 2011 in the Bay of Douarnenez. Densities were estimated from interpolations on a regular grid. The dotted square represents the dredging area.

The fresh water discharged into the bay is influenced by urban wastes from Douarnenez and, more importantly, by a catchment area on which large numbers of livestock are reared. The combined effect of these inputs leads to high concentrations of nutrients in the seawater. The semi-enclosed form of the bay and its low tidal regime confine these nutrients to the coastal band and lead to proliferations of phytoplankton and increasingly green tides (accumulations of Ulva sp.: Merceron et al., Reference Merceron, Antoine, Auby and Morand2007). This bay is the second worst impacted area for green algae in the Brittany region, which is notorious for developing high levels of this kind of pollution.
Sampling
SURVEYS IN THE 1980S: DREDGING AND VIDEO
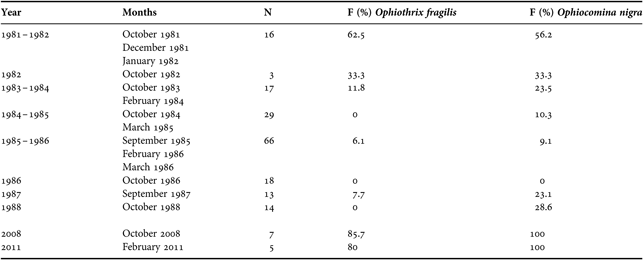
According to the high biomass of echinoderms present, an area was defined by Bodin et al. (Reference Bodin, Boucher, Guillou, Guillou and Gibbs1985) as the reference zone for a long-term survey of echinoderms (Figure 1). In this area, surveys were carried out in the 1980s. The samples were collected with a 1.8-m scallop dredge without teeth, equipped with a 2-cm mesh net. The dredge was towed for three minutes at 3 knots to prevent it from over-filling. The dredgings were randomly distributed in the sampling area. To estimate their length, the ship's position was recorded at the start and the end of each haul using three radar bearings. The mean evaluated length of the dredgings was 285 ± 31.8 m. The abundance of individuals for each species was transformed into density per 100 m2 by taking into account the dredged area, i.e. the tow length multiplied by the width of the dredge (1.8 m). For each year in which samples were taken (Table 1), the density of each species was calculated as the mean value of all the hauls made over the reference area in autumn and winter sampling months. Sampling focused on 1 to 3 months with 3 to 8 hauls per month from 1981 until 1983; then on 13 to 22 hauls per month from 1984 until 1988, when the ophiuroids became much more difficult to sample. From October 1986 until October 1988, the sampling was carried out during a single month in autumn.
Characteristics of the samplings in the reference area in the 1980s and 2008 and 2011.

N, sum of dredgings conducted in all samplings (months) of each period (year); F(%), percentage of dredging in which the species was present.
In December 1982 and February and October 1986, the density of Ophiocomina nigra was also evaluated using a sensitive underwater video camera mounted on a sledge. The mean density was calculated by dividing the length of the route filmed by the camera (width of field of view 0.40 m) into samples of 12.5 m, according to the method described and tested by Bourgoin et al. (Reference Bourgoin, Guillou and Morvan1985).
SURVEYS IN 2008 AND 2011
Video survey
In 2011, a precise estimation of the ophiuroid density was also made using a vertically-oriented high-resolution camera (Sony CX 6 HD) fixed on a support. The camera allowed the acquisition of georeferenced images via Videonav software (Lunven et al., Reference Lunven, Le Goualher and Vasquez2002). A 0.05 m2 quadrat was fixed to the base of the support and filmed by the camera to define the sample area. The equipment was lowered from the drifting ship for bottom contact. This contact was repeated 20 times, allowing density estimation based on 0.05 × 20 = 1 m2 per point. Ophiuroid densities were interpolated using ordinary kriging for a regular point grid covering the whole of Bay of Douarnenez. This geostatistical method analyses the spatial structure of the dataset through semi-variograms (see method in Blanchet-Aurigny et al., 2012). The kriging accounts for a minimum of three stations and a distance of up to 1 km from the grid point. In the dredging area, eight locations were sampled in this way.
Dredgings
In October 2008 and February 2011, we resampled the reference site previously studied in the 1980s with a dredge exactly similar to that used in 1981–1988. The stations were located using a global positioning system coupled with Maxsea software.
Seven dredgings were made in 2008 and five in 2011. As the ophiuroid catch was so high during a 3-minutes haul, the contents of the dredge were divided into several parts. Ophiuroids were counted in one of these parts selected at random. The total density of ophiuroids was then calculated by multiplying the number of individuals by the number of parts.
DENSITY EVOLUTION
In 2008 and 2011, density evaluation in the reference area was based on a single sampling at the end of autumn or during winter. These results were compared with the mean of the autumn and winter data collected in the 1980s.
The ophiuroid occurrence (percentage of dredges in which the species was present) was then calculated. As variances were not homogeneous, the differences between the different surveys were analysed for each species using Kruskal–Wallis tests, followed by the Mann–Whitney U-test to identify specific group differences when the Kruskal–Wallis test was significant (P < 0.05).
RESULTS
Historical data
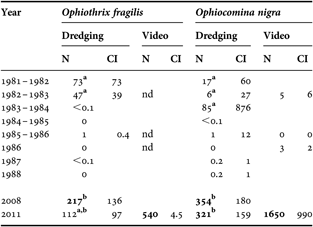
At the reference site, the video surveys carried out between 1982 and 1986 indicated an absence or only a very low presence of Ophiocomina nigra (Table 2). In the dredgings, the ophiuroid abundance fell considerably between 1983 and 1988, which cannot have been a result of insufficient sampling as the number of dredgings actually increased during this period (Table 1).
Mean ophiuroid densities in the reference area in the 1980s and in 2008 and 2011 (ind. 100 m-2; data from dredging and video).

CI, confidence interval. For each species, data sharing common superscripts are not significantly different (Kruskal–Wallis h test); maxima are shown in bold type; nd, no data.
2008 and 2011 surveys
In 2008, densities of both ophiuroids were found to have increased significantly compared with the data from the winter surveys of 1981–1982 and 1982–1983, which had been similar to one another for each species. Ophiocomina nigra density did not change between 2008 and 2011, but O. fragilis had declined to a level not significantly different from the 1980s dredging estimates. In 2011, the relative occurrence of the two ophiuroids in the studied area thus differed greatly. In 2008 and 2011, occurrence in the dredges was 100% for O. nigra and ≥80% for O. fragilis, but it was near 60% in the winter of 1981–1982 and ≤33% between 1982 and 1988 for both species. The 2011 video survey also revealed a large increase of O. fragilis and O. nigra densities in this area, about five times higher than the densities estimated by the dredge samples, suggesting low dredge catchability. Data from the geostatistical analysis method showed that Ophiocomina nigra was distributed in several patches in the north-eastern part of the bay. The densest patch (>1000 ind. m−2) was located on a bottom of maerl or blocks (Figure 1) and was composed of a mono-cohort of small and immature individuals (5.4 ± 1.8 mm in disc diameter). The densities then decreased regularly toward the centre of the bay. In these areas the ophiuroid size distribution was much larger, with disc diameters between 5 and 17 mm and a mean diameter increasing with depth from the northern to the central part of the bay. The species was absent from the eastern, western and southern parts of the bay. The sand is finer in these areas except in the opening of the bay, where the stronger currents result in coarser sediments. It was also in the opening of the bay that the highest densities of Ophiothrix fragilis were observed, with a patch of density >150 ind. m−2. Patches of lower densities of this species cohabiting with O. nigra were present in the north-western part of the bay.
DISCUSSION
This study allowed us to establish the current population status of Ophiocomina nigra and Ophiothrix fragilis in the Bay of Douarnenez, including the discovery of a patch of O. nigra exceeding 1000 ind. m−2 density. The historical data were sparse compared with these present data, consisting of a longer-term survey of a reference area sampled by dredging and video. However, these past sampling points were not randomly selected but located in an area where the density of echinoderms was considered to be high at the time (Bodin et al., 1985).
The dredging survey showed that between 1984 and 1988 both species almost disappeared from the studied site (a decline that may well have continued after this study period). From 1983 to 1987, the asteroid biomass was very high, with a dominance of Asterias rubens and Marthasterias glacialis from 1983 to 1985, then of Luidia ciliaris (Philippi, 1837) and Luidia sarsi (Duben & Koren, 1846) from 1986 to 1988 (Guillou, Reference Guillou1996). During the two first years, the very high starfish density (up to 45 g. m−2 in wet weight over the whole site) could explain the decrease in ophiuroid abundance (Aronson, Reference Aronson1989). From 1986, the presence of Luidia ciliaris would have had a ‘scarecrow' effect on the ophiuroid community, as this species is known as an ophiuroid predator (Holme, Reference Holme1984; Aronson, Reference Aronson1992).
By 2008, both ophiuroid species had colonized the site again. In 2011, the mean asteroid density was low: from sampling operations following the same protocol as used previously, M. glacialis and A. rubens had estimated mean densities of 4 ± 2 and 7 ± 3 ind. m−2, respectively (M. Guillou, personal observation) versus 13 ± 5 and 35 ± 14 respectively in 1981–1984 (Guillou, Reference Guillou, Barnes and Gibson1990). No Luidia sarsi or L. ciliaris were observed in the recent surveys. The 2011 data as a whole did not seem to indicate that O. fragilis was present in densities above the average observed at the beginning of the 1980s. These cyclical changes are similar to previous observations showing that dense O. fragilis populations may decline sharply within the space of a few years (review in Hughes, Reference Hughes1998). The origin of these changes (natural or human-induced) is not clear, due to the lack of long-term records.
In contrast, Ophiocomina nigra increased from the initial period in the 1980s to the more recent one, confirming fishermen's and scientists' observations in west Brittany waters (see information available from the French Benthic Network, REBENT: www.rebent.org and Blanchet-Aurigny et al., 2012). In the dredges, its mean densities were about four times higher than the ones estimated in 1987 and the colonization of the reference area was more homogeneous (increase in species occurrence in the dredges and decrease in the variability of mean abundance). These data were confirmed by video surveys. Although the techniques used are not strictly comparable, differences were high in the reference area between 1982 and 2011 (≤0.05 ind. m−2 from 1983 to 1986 versus 16.5 ind. m−2 in 2011). The actual densities are significantly higher than any data currently available in the literature on this species (see Wilson et al., Reference Wilson, Holme and Barrett1977; Hughes, Reference Hughes1998) except the density observed concomitantly in the Bay of Brest, where an O. nigra population outbreak, as defined by Uthicke et al. (Reference Uthicke, Schaffelke and Byrne2009), was described (up to 1500 ind. m−2), and a monospecific bed reported by Aronson (Reference Aronson1989) on the west coast of Scotland, where this species locally reached 2000 ind. m−2. In the present study, while the densest concentrations of O. nigra (1000 ind. m−2) were made up of juveniles, the large size distribution (up to 17 mm in disc diameter) in the other dense patches observed in the bay showed that what we were observing was not the offspring of a single recruitment event, but a progressive extension of this long-lived species (Gorzula, Reference Gorzula1977). In a similar way as for other echinoderms (Guillou & Michel, Reference Guillou and Michel1993), calcareous algae (maerl) could be a favourable bottom type for the settlement of O. nigra. This species should show further ontogenetic migrations to the centre of the bay, probably induced by temporal changes in feeding behaviour and inter-specific competition.
It is possible that this increase in Ophiocomina nigra is due to an organic enrichment of the bay, as previously described by Raymont (Reference Raymont1950) in Loch Sween in Scotland after input of fertilizers to the sea, or Allain et al. (Reference Allain, Romano and Semroud1978) and Harmelin et al. (Reference Harmelin, Bouchon and Hong1981) in the vicinity of urban sewage discharges on Mediterranean coasts. Its proliferation in the Bay of Brest was associated with changes in the environment and human activities that created favourable conditions for this opportunistic feeder (Hily, Reference Hily1991; Blanchet-Aurigny et al., 2012). The increase in green algae in the Bay of Douarnenez (Merceron et al., 2007) may well be a factor contributing to the increase of this species, as it is one of the few ophiuroids capable of grazing seaweed (Warner, Reference Warner, Jangoux and Lawrence1982). On the basis of the present study, it is too early to conclude that there was a cause-and-effect relationship between the abundance of green algae and the proliferation of O. nigra. Our results do show that a wider long-term survey should be made to confirm successful recruitments of O. nigra, extension of its range and its feeding habits in the bay in relation to the enrichment of seawater in organic matter and nutrients.
ACKNOWLEDGEMENTS
This work was partly funded by the Parc Naturel Marin d'Iroise (PNMI) and the French National Programme on the Coastal Environment (PNEC). The authors thank Robert Marc and Christian Tartu (UBO) for their technical assistance in the 1980s, the team of the PNMI for their assistance in 2008 and X. Caisey and J.D. Gaffet for their assistance in 2011. We are also grateful to the crews of the N/O ‘Thalia' for the whole surveys and thank the Bureau de Traduction de l'Université at UBO for revision of the English of this manuscript.