





Introduction
The Canadian Nosocomial Infection Surveillance Program (CNISP) is a hospital-based surveillance system that collects data on healthcare-associated infections (HAIs) and antimicrobial use (AMU). Between 2002 and 2024, CNISP conducted four point prevalence surveys (PPSs) to measure the prevalence of HAIs and AMU in Canadian acute care hospitals over time.Reference Mitchell, Lee and Bartoszko1
The European Centre for Disease Prevention and Control (ECDC) established methodology to validate the results of their PPSs, highlighting the importance of validation to properly interpret prevalence estimates.2 CNISP piloted a validation study with the primary objective of assessing inter-rater agreement (IRA) of HAI and AMU prevalence estimates collected during the 2024 CNISP acute care PPS, henceforth referred to as the primary PPS. Conclusions from this study will be used to further our understanding of HAI and AMU prevalences estimated through the primary PPS and identify areas for improvement in future surveys.
Methods
Study design
Methodology was adapted from the ECDC PPS validation protocol.3 All hospitals participating in the primary PPS between February 26 and March 15, 2024 were eligible to participate.4 Validation study data collectors (i.e. infection prevention and control staff) at each hospital independently re-examined key variables using standardized case definitions4 for a minimum of 5% of patient records from the primary PPS. A random selection of patients records among wards with higher expected HAI prevalence was recommended. To ensure blinded data collection, validation study personnel did not participate in primary PPS data collection and were asked not to access these data. According to the protocol, it was recommended that validation study personnel have similar experience in HAI and AMU surveillance as primary PPS personnel, and that data were collected on the same day for both the validation study and primary PPS to ensure similar data availability.
Analysis
Primary PPS and validation study records were matched using unique patient identifiers. IRA between the primary PPS and validation study data collectors was analyzed for each variable using percent agreement (Equation 1) and Cohen’s kappa (κ) statistic (Equation 2). Weighted kappa statistics (κw) were calculated for ordinal variables. The κ statistic was interpreted using the following ranges: very good (0.81–1.00), good (0.61–0.80), moderate (0.41–0.60), fair (0.21–0.40), and poor (<0.2).Reference Landis and Koch5
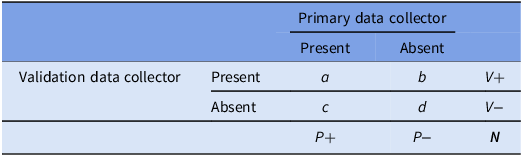
Very low (or very high) prevalence artificially deflates the κ statistic.Reference Bajpai, Bajpai and Chaturvedi6 To address this potential bias, percentages of positive agreement (ppos) and negative agreement (pneg) were calculated for binary (i.e., present or absent) variables (Table 1). ppos is the proportion of cases classified as positive (i.e., present) among the average number of positive cases between the two data collectors, and pneg is the average proportional negative (i.e., absent) agreement (Equations 3a and 3b).
Analyses were conducted using R version 4.4.2.
 ${{\rm Percent}\,{{\rm agreement}}= {{\rm Number\ of\ concordant\ responses} \over {\rm Total\ number\ of\ responses}} \times 100\%}$

Two-by-two agreement table comparing classifications made by primary and validation data collectors

Table 1. Long description
A table with two rows and three columns. The columns are labeled ‘Present’, ‘Absent’, and ‘P+’. The rows are labeled ‘Present’ and ‘Absent’. The table cells contain the following values: Row 1: Present, a, b, V+. Row 2: Absent, c, d, V-. Row 3: P+, P-, N.
 ${{{p}_{{pos}}}}= {a \over (P_{+}+V_{+})/2}\times 100\%$
 ${{p}_{{neg}}}={d \over (P_{-}+V_{-})/2}\times 100\%$
Results
Hospital characteristics
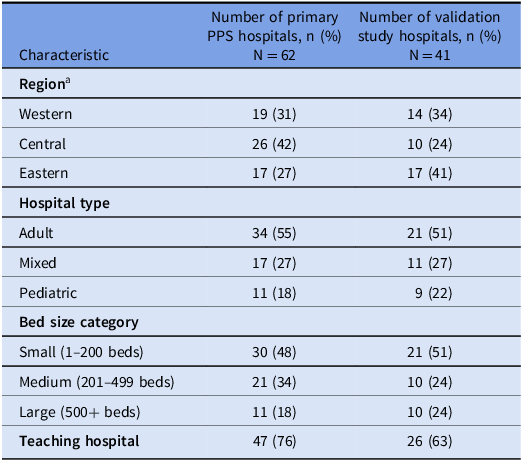
Sixty-two hospitals participated in the primary PPS, among which 41 (66%) participated in the validation study. Hospitals were located across Canada, with a large proportion from the East (17/41, 41%) and West (14/41, 34%). Twenty-one hospitals provided care to adult patients only (51%). The majority of hospitals were teaching hospitals (26/41, 63%) and approximately half had less than 200 inpatient beds (21/41, 51%) (Table 2).
Characteristics of hospitals participating in the 2024 Canadian acute care point prevalence survey validation study

Table 2. Long description
A table comparing characteristics of hospitals participating in the 2024 Canadian acute care point prevalence survey validation study. The table has 11 rows and 3 columns. The columns are labeled ‘Characteristic’, ‘Number of primary PPS hospitals, n (%)’, and ‘Number of validation study hospitals, n (%)’. The rows are grouped under three main characteristics: Region, Hospital type, and Bed size category. Each row lists specific categories within these characteristics along with the corresponding number and percentage of hospitals. For example, under Region, the categories are Western, Central, and Eastern. Under Hospital type, the categories are Adult, Mixed, and Pediatric. Under Bed size category, the categories are Small (1–200 beds), Medium (201–499 beds), and Large (500+ beds). The table also includes a row for Teaching hospital. The data shows the distribution of hospitals across different regions, types, bed sizes, and teaching status for both primary PPS hospitals and validation study hospitals.
PPS, point prevalence survey.
a Eastern Canada: New Brunswick, Nova Scotia, Prince Edward Island, Newfoundland and Labrador; Western Canada: British Columbia, Alberta, Saskatchewan, Manitoba; Central Canada: Ontario, Quebec, Nunavut.
Ward and patient sampling
Hospitals participating in the validation study reported a total of 7,599 patient records through the primary PPS, among which 472 (6.2%) were validated in this study. Across the 41 hospitals, 111 wards were selected for validation; 25% (28/111) were medicine wards and 18% (20/111) were adult intensive care units (ICUs). Half of these wards (56/111, 50%) were sampled due to high expected HAI prevalence (e.g., ICUs).
Inter-rater agreement
Primary and validation records reported very good levels of agreement for patient characteristics such as age (96%, κ = 0.96), sex (99%, κ = 0.97), ward (90%, κ = 0.88), and date of hospital admission (95%, κ = 0.94).
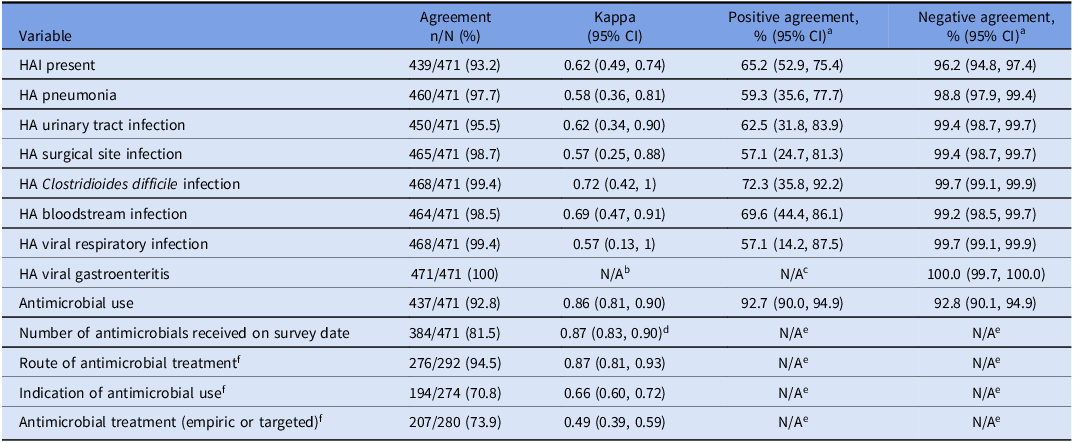
Overall, a good level of agreement was found for the presence of an HAI (93%, κ = 0.62). However, positive (i.e., HAI present) responses were less concordant than negative (i.e., HAI absent) responses (65.2%, 95% confidence interval (CI): 52.9%–75.4% vs 96.2%, 95% CI: 94.8%–97.4%). The median time in days between primary PPS and validation data collection did not differ between cases where data collectors agreed an HAI was present compared to when they did not (Supplementary Material). Significant differences between agreement levels by HAI type were not observed, though ppos was lower than pneg across all HAI types (Table 3).
Inter-rater agreement indices for healthcare-associated infections and antimicrobial use variables

Table 3. Long description
A table with 11 rows and 5 columns comparing inter-rater agreement indices for healthcare-associated infections and antimicrobial use variables. The columns are labeled Variable, Agreement n/N (%), Kappa (95% CI), Positive agreement, % (95% CI), and Negative agreement, % (95% CI). Row 1: HAI present, 439/471 (93.2), 0.62 (0.49, 0.74), 65.2 (52.9, 75.4), 96.2 (94.8, 97.4). Row 2: HA pneumonia, 460/471 (97.7), 0.58 (0.36, 0.81), 59.3 (35.6, 77.7), 98.8 (97.9, 99.4). Row 3: HA urinary tract infection, 450/471 (95.5), 0.62 (0.34, 0.90), 62.5 (31.8, 83.9), 99.4 (98.7, 99.7). Row 4: HA surgical site infection, 465/471 (98.7), 0.57 (0.25, 0.88), 57.1 (24.7, 81.3), 99.4 (98.7, 99.7). Row 5: HA Clostridioides difficile infection, 468/471 (99.4), 0.72 (0.42, 1), 72.3 (35.8, 92.2), 99.7 (99.1, 99.9). Row 6: HA bloodstream infection, 464/471 (98.5), 0.69 (0.47, 0.91), 69.6 (44.4, 86.1), 99.2 (98.5, 99.7). Row 7: HA viral respiratory infection, 468/471 (99.4), 0.57 (0.13, 1), 57.1 (14.2, 87.5), 99.7 (99.1, 99.9). Row 8: HA viral gastroenteritis, 471/471 (100), N/A, N/A, 100.0 (99.7, 100.0). Row 9: Antimicrobial use, 437/471 (92.8), 0.86 (0.81, 0.90), 92.7 (90.0, 94.9), 92.8 (90.1, 94.9). Row 10: Number of antimicrobials received on survey date, 384/471 (81.5), 0.87 (0.83, 0.90), N/A, N/A. Row 11: Route of antimicrobial treatment, 276/292 (94.5), 0.87 (0.81, 0.93), N/A, N/A.
CI, confidence interval; HAI, healthcare-associated infection; HA, healthcare-associated.
a 95% CIs reflect Bayesian intervals with Beta (1,1) prior.
b Kappa statistic cannot be calculated due to lack of variance in responses across raters.
c No positive responses were reported.
d Weighted kappa.
e Positive and negative agreement are not applicable.
f Records included when primary point prevalence survey and validation study data collectors reported the same antimicrobial.
A very good level of agreement was found for AMU (93%, κ = 0.86), with high percentages of both positive and negative agreement (92.7%, 95% CI: 90.0%–94.9% and 92.8%, 95% CI: 90.1%–94.9%, respectively). Among patients reported to receive at least one antimicrobial in both the primary and validation data sets, 93% (152/164) had data collectors report the same number and type of antimicrobials received. Among the antimicrobials reported within this subset of patients, a very good level of agreement was observed for route of administration at 95% (κ = 0.87), while agreement for indication of AMU was lower at 71% (κ = 0.66). There was moderate agreement when discerning between targeted or empiric treatment (74%, κ = 0.49).
Discussion
Overall, agreement between data collectors met the good, but not very good threshold when determining the presence of an HAI. This variable presented with low ppos and high pneg, suggesting that data collectors are highly likely to agree when a patient has no HAI, but less likely to agree on HAI-positive findings. Further investigation is required to understand the reasons behind this low positive agreement, such as differences in experience applying HAI definitions.Reference Holmes, Moinuddin and Steinfeld7 During a similar pilot study conducted by the ECDC, very good agreement was observed when determining the presence of an HAI (κ = 0.92), showing room for improvement in future CNISP surveys.Reference Reilly, Price and Godwin8 Conversely, treatment with at least one antimicrobial showed high levels of positive, negative, and overall agreement, which allows for high confidence in AMU prevalence estimates reported through the primary PPS. These results align with ECDC findings that report high sensitivity and specificity when validating AMU prevalence, but difficulties in interpreting HAI prevalences due to lower accuracy.2 The delay in diagnostic results after empiric therapy is initiated and need for more critical judgment may have led to lower IRA for variables such as indication of AMU. Past reliability audits of CNISP HAI surveillance data also found that discordant responses were more likely for variables that require more interpretation.Reference Forrester, Collet and Mitchell9,Reference Simmonds, Leduc and Bush10
Future surveys could consider collecting information on data collectors, such as professional roles and experience with CNISP protocols, to help contextualize differences in IRA. CNISP should prioritize training and validation of main indicators (e.g., HAI prevalence) and variables with low agreement (e.g., indication of AMU), whereas variables with higher agreement may not need to be routinely validated.
In addition to data validation, changes can be made to improve data quality. During the primary PPS, data collectors were offered multiple formats of data submission to suit the hospitals’ needs, which could have resulted in data entry errors reflected in imperfect alignment of patient demographic variables. In future surveys, CNISP can standardize data collection using a single, logic-implemented tool supplemented with a list of minimum data quality checks to be completed prior to submission.
This validation study was an important learning opportunity to identify areas for improvement when executing and interpreting PPS results. Findings can also act as points of consideration for other countries who plan to conduct a PPS to measure HAI and AMU prevalences.
Supplementary material
The supplementary material for this article can be found at https://doi.org/10.1017/ice.2026.10531.
Acknowledgments
This paper is dedicated to the memory of Dr. Charles Frenette who passed away on September 23, 2025. Dr. Frenette was a graduate of McGill University’s Faculty of Medicine, with residency training in Infectious Diseases and Medical Microbiology. Charles directed the Infection Prevention and Control program at McGill University Health Centre (MUHC), fulfilling roles as clinician and educator for nearly twenty years. He was a key member of theCNISP hospital network since 2009 and was deeply committed to its work. Charles was passionate about Infection Control and Public Health, consistently striving to increase visibility and knowledge. He was instrumental in the conception of this study and analyses and despite declining health, was devoted to the manuscript until he passed. Charles’ legacy will continue to inspire us and the CNISP work we carry forward.
We would also like to acknowledge Marie-Eve Benoit, Jeannette Comeau, Jennifer Happe, Nicole Haslam, Bonita Lee, and Alice Wong for their contributions to this work as members of the CNISP Point Prevalence Survey Working Group, as well as the staff at participating hospitals for their efforts to make PPSs possible.
Financial support
This work was supported by the Public Health Agency of Canada.
Competing interests
The author [Jessica J Bartoszko] held a consultancy contract with the World Health Organization and received payment from McMaster University for methodologist/analyst services unrelated to this manuscript. The author [Susy S Hota] is the president-elect of the Association of Medical Microbiology and Infectious Diseases, Canada and has received payment from Ferring Pharmaceuticals for consulting and other educational activities. All other authors report no potential conflicts. All authors have submitted the ICMJE Form for Disclosure of Potential Conflicts of Interest.


 Open access

