


Impact Statement
Bias-adjusted climate data feed many agricultural damage projections, but their performance for extreme heat metrics is still poorly documented. Bias adjustment improves moderate-threshold heat exposure metrics at EDD-0 and EDD-8 by 29–86 °C
$ \cdot $
 days depending on model and threshold, while average improvements are only 1–4 °C
$ \cdot $
 days at EDD-28, with error increasing in about 40% of cases, and smaller at higher cutoffs. Impact modelers should validate bias-adjusted inputs at the thresholds their damage functions use rather than assuming uniform improvement. The evaluation spans seven crops and seven temperature thresholds across Europe and identifies where bias adjustment improves agreement with ERA5 and where gains are limited.
1. Introduction
Bias-adjusted climate model output is now a common input to agricultural impact models. These products adjust temperature and precipitation toward observational climatologies while retaining the parent model’s simulated climate change signal (Hempel et al., Reference Hempel, Frieler, Warszawski, Schewe and Piontek2013; Lange, Reference Lange2019). They appear in crop models, integrated assessment models, and loss-and-damage frameworks (Lafferty and Sriver, Reference Lafferty and Sriver2023). Raw CMIP6 temperature fields often carry mean, variability, and spatial biases that propagate into yield, water-demand, and damage estimates if left uncorrected (Maraun, Reference Maraun2016).
Crop yields respond nonlinearly to temperature. For maize and other staples, losses accelerate once daily temperatures exceed roughly 29–32 °C during reproductive growth, which is why empirical yield functions often use threshold-based heat metrics (Schlenker and Roberts, Reference Schlenker and Roberts2009; Gourdji et al., Reference Gourdji, Sibley and Lobell2013; Lobell et al., Reference Lobell, Hammer, McLean, Messina, Roberts and Schlenker2013). If a bias-adjusted product misses the frequency or intensity of extreme heat, EDD totals will be too low and damage estimates with them.
Validation work on bias-adjusted temperature commonly examines seasonal averages, monthly distributions, or generic extreme indices (Iturbide et al., Reference Iturbide, Casanueva, Bedia, Herrera, Milovac and Gutiérrez2022). Agricultural impact studies increasingly use derived metrics that respond to the upper tail of the temperature distribution. EDD counts only the portion of temperature above a cutoff and appears throughout crop-climate response functions (Schlenker and Roberts, Reference Schlenker and Roberts2009; Lobell et al., Reference Lobell, Hammer, McLean, Messina, Roberts and Schlenker2013). Small residual errors in mean state or variance after bias adjustment can therefore produce large errors in cumulative heat exposure (Dosio, Reference Dosio2016; Di Luca et al., Reference Di Luca, Pitman and de Elía Elía2020; Lafferty and Sriver, Reference Lafferty and Sriver2023).
Bias adjustment improves agreement with observations, but corrected fields are not exact replicas of station or reanalysis climate. Trend-preserving quantile mapping can change variance, smooth extremes, and distort the upper tail, especially where calibration data are sparse, or climate is nonstationary (Dosio, Reference Dosio2016; Maraun, Reference Maraun2016; Lanzante et al., Reference Lanzante, Dixon, Nath, Whitlock and Adams-Smith2018; Di Luca et al., Reference Di Luca, Pitman and de Elía Elía2020). That matters for indicators defined by threshold exceedance rather than mean conditions.
Few studies trace bias adjustment through to the crop-specific, calendar-weighted EDD metrics used in agricultural economics. Prior work evaluates raw temperature (Thorarinsdottir et al., Reference Thorarinsdottir, Sillmann, Haugen, Gissibl and Sandstad2020) or generic extreme indices (Dosio, Reference Dosio2016; Iturbide et al., Reference Iturbide, Casanueva, Bedia, Herrera, Milovac and Gutiérrez2022), not the aggregated heat-exposure measures impact modelers actually apply. We evaluate bias-adjusted CMIP6 temperature data for EDD calculation across three models, seven crops, and European ADM1 regions. Section 2 describes the data and methods; Section 3 reports threshold, spatial, and distributional results; Section 4 discusses implications for impact studies; Section 5 concludes.
2. Data and methods
2.1. Study region and climate data sources
We analyze Europe at the first administrative subdivision level (ADM1), using administrative boundaries from the Global Administrative Areas database (GADM version 4.1; GADM, 2022). Our study period is 1994–2014, which is common to all three data sources and captures two decades of historical climate variability.
We compare three daily temperature sources: ERA5 reanalysis (Hersbach et al., Reference Hersbach, Bell, Berrisford, Hirahara, Horányi, Muñoz-Sabater, Nicolas, Peubey, Radu, Schepers, Simmons, Soci, Abdalla, Abellan, Balsamo, Bechtold, Biavati, Bidlot, Bonavita, De Chiara, Dahlgren, Dee, Diamantakis, Dragani, Flemming, Forbes, Fuentes, Geer, Haimberger, Healy, Hogan, Hólm, Janisková, Keeley, Laloyaux, Lopez, Radnoti, Rosnay, Rozum, Vamborg, Villaume and Thépaut2020) at 0.25° resolution (
$ {T}_{\mathrm{max}} $
 and
$ {T}_{\mathrm{min}} $
 from 2-m air temperature); raw CMIP6 historical output for GFDL-ESM4, MPI-ESM1-2-HR, and EC-Earth3 from the Pangeo archive at 0.7–1.0° native resolution; and bias-adjusted CMIP6 from the CIL-GDPCIR product (Microsoft Planetary Computer) at 0.25° using quantile delta mapping and trend-preserving downscaling (Gergel et al., Reference Gergel, Malevich, McCusker, Tenezakis, Delgado, Fish and Kopp2024), building on related trend-preserving methods (Lange, Reference Lange2019). CIL-GDPCIR uses ERA5 as its observational reference over 1995–2014. Our 1994–2014 comparison is therefore primarily an in-sample agreement assessment, not an independent out-of-sample validation of the bias-adjustment method.
2.2. Extreme degree days calculation
We calculate daily EDD using the sinusoidal approximation method (Snyder, Reference Snyder1985), which models the diurnal temperature cycle as a sine wave. For a given day with
$ {T}_{\mathrm{max}} $
 ,
$ {T}_{\mathrm{min}} $
 , and threshold
$ {T}_{\mathrm{cutoff}} $
 : if
$ {T}_{\mathrm{max}}\le {T}_{\mathrm{cutoff}} $
 , EDD = 0; if
$ {T}_{\mathrm{min}}\ge {T}_{\mathrm{cutoff}} $
 , EDD =
$ \left({T}_{\mathrm{max}}+{T}_{\mathrm{min}}\right)/2-{T}_{\mathrm{cutoff}} $
 ; otherwise:

where
$ M=\left({T}_{\mathrm{max}}+{T}_{\mathrm{min}}\right)/2 $
 ,
$ W=\left({T}_{\mathrm{max}}-{T}_{\mathrm{min}}\right)/2 $
 ,
$ R=\left({T}_{\mathrm{cutoff}}-M\right)/W $
 , and
$ \theta =\operatorname{arccos}(R) $
 . We compute EDD at seven thresholds: 0, 4, 8, 12, 28, 30, and 32 °C. Additional details are provided in Supplementary Methods S1.1.
2.3. Crop-specific aggregation
Gridded EDD values were aggregated to ADM1 units using harvested-area-weighted averages from GAEZ v4.0 (Fischer et al., Reference Fischer, Nachtergaele, Velthuizen, Chiozza, Franceschini, Henry, Muchoney and Tramberend2021). We analyzed seven crops (wheat, maize, rice, barley, potato, sugar beet, and rapeseed) under both rainfed and irrigated management. For each crop, the same daily EDD fields (computed at the seven fixed temperature thresholds above) were subset to crop-specific phenological periods from the SAGE Global Crop Calendar (Sacks et al., Reference Sacks, Deryng, Foley and Ramankutty2010): plant, between (vegetative and reproductive growth), and harvest. When SAGE provides more than one calendar for a crop (wheat, barley, and rice), all listed calendars were retained and their matched observations pooled within that crop. Daily EDD within each calendar window was summed to produce three seasonal totals per crop-year-ADM1-calendar combination. Full methodological details on calendar computation, harvested area weighting, and spatial aggregation are provided in Supplementary Methods S1.2–S1.5. Region–crop–management units without a valid calendar window or without harvested-area support in all three data sources were excluded.
2.4. Evaluation metrics
We define
$ \Delta \mathrm{Skill}=\mathrm{MAE}\left(\mathrm{raw}\right)-\mathrm{MAE}\left(\mathrm{biasadj}\right) $
 . Positive values indicate bias adjustment reduces error; negative values indicate degradation. We also compute quantile errors (
$ {Q}_{90/95/99} $
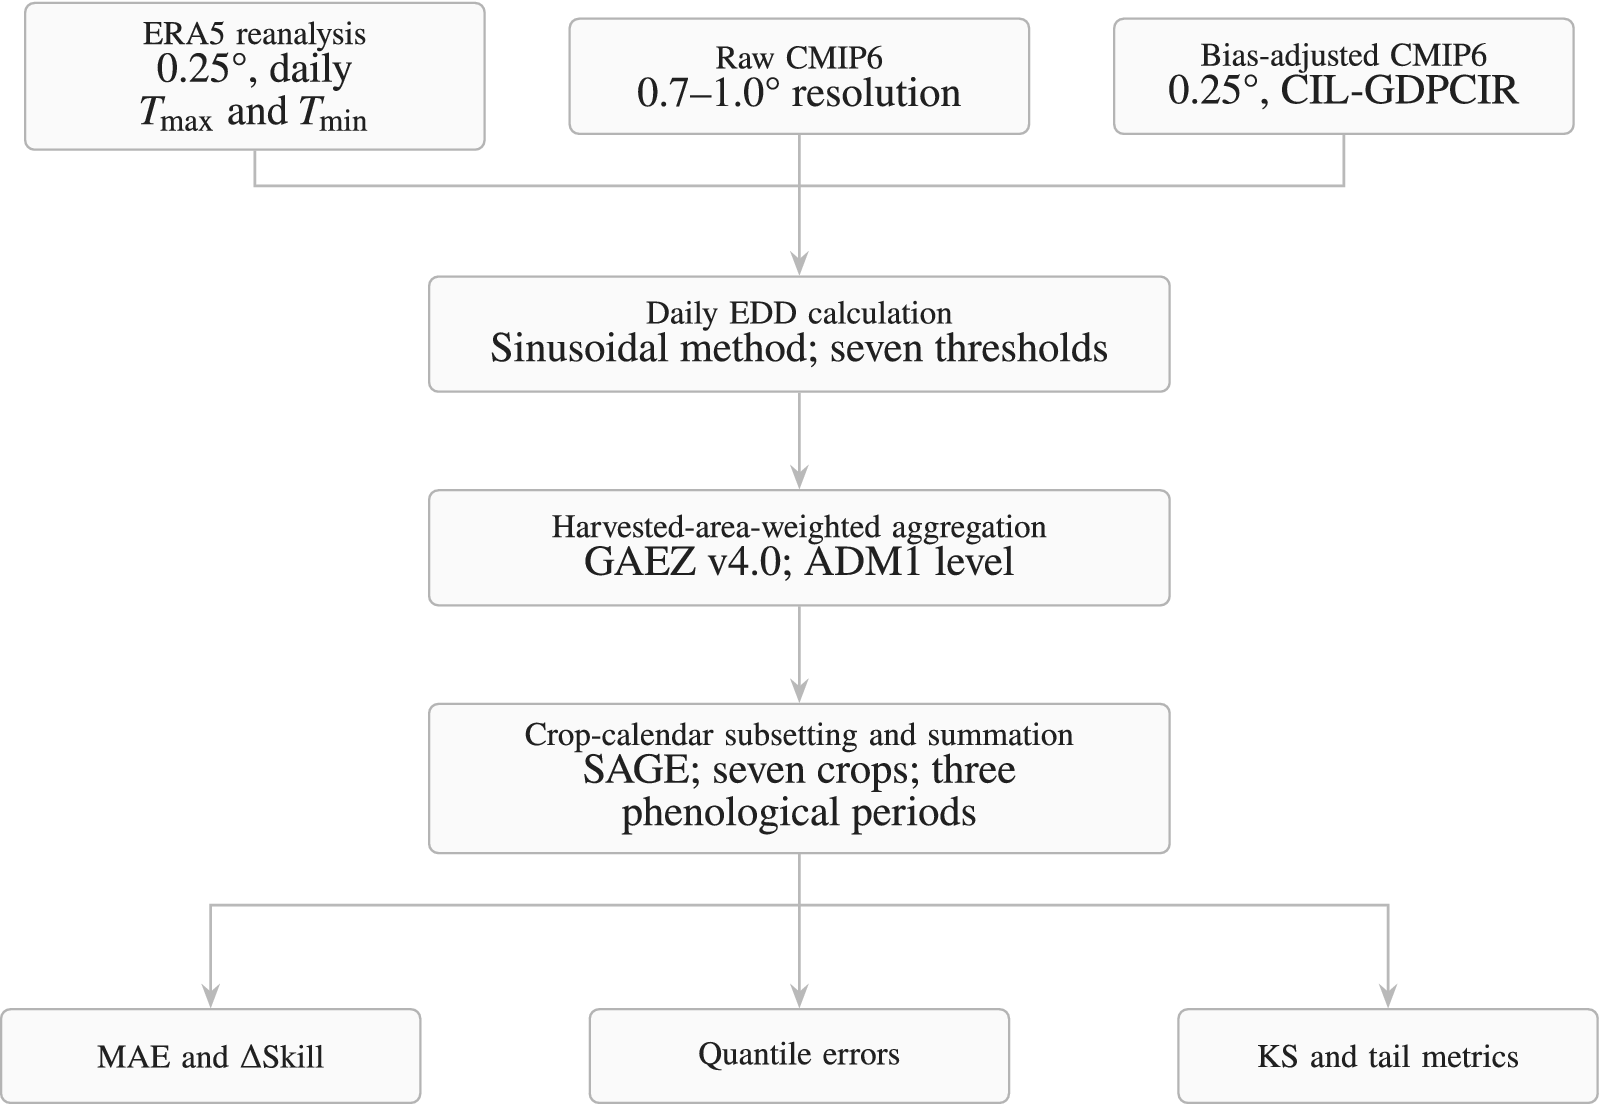
 ), exceedance frequency error (difference between model and ERA5 in the proportion of values exceeding the ERA5 95th percentile within each evaluation group), tail mean error (mean EDD in top 10% of ERA5 distribution), and Kolmogorov–Smirnov statistics. All metrics are calculated at the ADM1-crop-period-threshold level, then averaged for presentation. Figure 1 summarizes the analysis pipeline.
Analysis workflow. Daily temperature from ERA5, raw CMIP6, and bias-adjusted CMIP6 is converted to EDD at seven thresholds, aggregated to ADM1 units using harvested-area weights, subset and summed by crop phenological calendar, and evaluated against ERA5 using MAE/
$ \Delta $
 Skill and distributional diagnostics.

Figure 1. Long description
The flowchart consists of five main vertical stages connected by downward-pointing arrows.
1. Top Layer (Inputs): Three boxes represent the starting data.
* Left: ERA5 reanalysis at 0.25-degree resolution, providing daily maximum and minimum temperatures.
* Center: Raw CMIP6 0.7 to 1.0 degree resolution.
* Right: Bias-adjusted CMIP6 0.25 degree, CIL-GDPCI R.
2. Second Layer (Calculation): Arrows from the three inputs converge into a single box labeled Daily EDD calculation, Sinusoidal method; seven thresholds.
3. Third Layer (Aggregation): An arrow leads to a box labeled Harvested-area-weighted aggregation, GAEZ v4.0; ADM1 level.
4. Fourth Layer (Subsetting): An arrow leads to a box labeled Crop-calendar subsetting and summation, SAGE; seven crops; three phenological periods.
5. Bottom Layer (Evaluation): Three arrows branch out from the subsetting stage to final output metrics.
* Left: MAE and Delta Skill.
* Center: Quantile errors.
* Right: KS and tail metrics.
3. Results
3.1. Moderate-threshold gains, limited extreme-threshold gains
Bias adjustment improves EDD agreement with ERA5 at low and moderate thresholds and adds little at extreme ones. Mean MAE falls by 37–86 °C
$ \cdot $
 days at EDD-0 and 29–64 °C
$ \cdot $
 days at EDD-8 across the three models (Figure 2 and Supplementary Table S1). Those gains shrink quickly with threshold. At EDD
$ \ge $
 28 °C, mean
$ \Delta $
 Skill is small (1–4 °C
$ \cdot $
 days at EDD-28). The pattern is threshold-specific rather than model-specific. Crop-level detail appears in Supplementary Table S2 and Supplementary Figure S18; rapeseed, maize, and wheat show the largest moderate-threshold improvements.
Mean ∆Skill (MAE improvement, °C
$ \cdot $
 days) with
$ \pm $
 1 SD shading across crops, ADM1 regions, irrigation types, and phenological periods. Positive values mean bias adjustment lowers error relative to raw CMIP6. Only region–crop–management units with a valid calendar window and harvested-area support in all three data sources are included.

Figure 2. Long description
The line graph plots EDD threshold in degrees Celsius on the X-axis (values 0, 4, 8, 12, 28, 30, 32) against Delta Skill MAE in degrees Celsius dot days on the Y-axis (ranging from -50 to 200).
At the top, a legend identifies three models:
* GFDL-ESM4 (orange line with circles)
* MPI-ESM1-2-HR (blue line with circles)
* EC-Earth3 (green line with circles)
Data Trends:
* All three models show a downward trend as the EDD threshold increases, converging toward zero at the 28 to 32 degree Celsius range.
* GFDL-ESM4 starts highest at approximately 86 at threshold 0.
* MPI-ESM1-2-HR starts at approximately 47 at threshold 0.
* EC-Earth3 starts lowest at approximately 37 at threshold 0.
* Shaded regions representing plus or minus 1 SD (Standard Deviation) are widest at threshold 0, spanning from roughly -25 to 190, and narrow significantly as they approach the higher thresholds.
* A horizontal dashed line at Y equals 0 serves as the baseline, where positive values indicate that bias adjustment reduces error relative to raw CMIP6.
3.2. Spatial patterns vary by crop and calendar
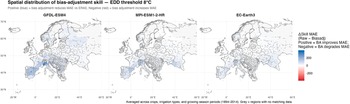
At EDD-8,
$ \Delta $
 Skill is positive for about 90% of evaluated combinations and negative for about 10%, at EDD-28 the split is 50% positive and 39% negative (GFDL-ESM4: 36% and 51%) (Figure 3). The sign can flip within a single country and across crop windows. Where raw CMIP6 carries a large cold bias, correcting the mean removes most of the MAE. Where the raw model is already close to ERA5, bias adjustment can shift the temperature distribution enough to worsen threshold-exceedance error for particular crop windows. Country-level heatmaps (Supplementary Figures S15–S17) show that crop- and period-specific outcomes can differ from the corresponding regional average.
$ \Delta $
 Skill at EDD-8 across European ADM1 regions for the three models, averaged across crops, irrigation types, and phenological periods. Blue: bias adjustment lowers MAE; red: bias adjustment raises MAE. Only region–crop–management units with a valid calendar window and harvested-area support in all three data sources are included.

Figure 3. Long description
Three panels show the spatial distribution of bias-adjustment skill at an EDD threshold of 8 degrees Celsius across European ADM1 regions. The X-axis for each map ranges from 20 degrees West to 60 degrees East, and the Y-axis ranges from 30 degrees North to 70 degrees North.
* The first panel on the left is labeled GFDL-ESM4. It shows widespread light blue shading across Western and Central Europe, with the strongest gains (darker blue) in Iberia and the western Alps.
* The middle panel is labeled MPI-ESM1-2-HR. It displays a similar pattern to the first panel but with weaker gains overall, with moderate blue in Iberia, the western Alps, and southern Russia.
* The third panel on the right is labeled EC-Earth3. This map shows the most neutral results, with large areas of white or very pale blue across the continent , with light blue in Iberia and southern Russia.
A shared color bar on the far right represents Delta Skill MAE (Raw minus Bias-adjusted). The scale ranges from negative 390 in dark red to positive 390 in dark blue. Positive values (blue) indicate that bias adjustment improves MA E, while negative values (red) indicate that bias adjustment degrades MAE. Grey areas indicate regions with no matching data. A few regions are slightly negative (pale red), but no region shows large degradation.
3.3. Distributional diagnostics at high thresholds
Quantile and tail diagnostics show bias adjustment fixing the upper-middle distribution at moderate thresholds but not the extreme tail. For GFDL-ESM4 at EDD-0, raw Q90 and Q95 errors are
$ - $
 140 and
$ - $
 140 °C
$ \cdot $
 days; after bias adjustment, they are
$ +1 $
 and
$ +1 $
 °C
$ \cdot $
 days (Figure 4, panel A). Tail mean error at EDD-0 falls from
$ - $
 292 to
$ - $
 148 °C
$ \cdot $
 days for the same model (panel B). At EDD
$ \ge $
 28 °C, quantile and exceedance-frequency errors (Supplementary Figure S8)
Distributional diagnostics versus ERA5. (A) Quantile errors at Q90 and Q95. (B) Tail mean error in the top 10% of the ERA5 distribution. At EDD
$ \ge $
 28 °C, absolute errors are small because high-threshold EDD is rare, not because the tail is well reproduced; tail-mean error is larger after bias adjustment for EC-Earth3 and MPI-ESM1-2-HR.

Figure 4. Long description
The image consists of two main sections, A and B, organized vertically.
Section A, titled Quantile errors, contains a six-panel grid. The x-axis represents EDD threshold in degrees Celsius with values 0, 4, 8, 12, 28, 30, and 32. The y-axis represents Quantile error in degrees Celsius-days, ranging from negative 150 to 20. The grid is divided into two columns for Q 90 and Q 95, and three rows for models EC-Earth3, GFDL-ESM4, and MPI-ESM1-2-HR. In all panels, a dashed horizontal line marks zero error. Raw CMIP6 data, shown as dark grey lines with circles, generally starts with negative errors at lower thresholds and converges toward zero at 28 degrees. Bias-adjusted data, shown as blue lines with circles, stays much closer to the zero line across all thresholds.
Section B, titled Tail mean errors, contains three panels arranged horizontally for the same three models. The x-axis is the same as Section A. The y-axis represents Tail mean error in degrees Celsius-days, ranging from negative 300 to 0.
* For EC-Earth3, the Raw CMIP6 line starts at negative 155 and rises to zero, while the Bias-adjusted line starts at negative 125 and converges to zero.
* For GFDL-ESM4, the Raw CMIP6 line shows a steep upward slope starting from negative 290, while the Bias-adjusted line starts at negative 150.
* For MPI-ESM1-2-H R, the Raw CMIP6 line starts at negative 155 and the Bias-adjusted line starts at negative 130, both converging to zero at the 28-degree threshold.
approach zero for both, but the tail-mean underestimate grows after bias adjustment for EC-Earth3 (−7.0 to −13.6 °C·days) and MPI-ESM1-2-HR (−8.2 to −13.5) and shrinks only for GFDL-ESM4 (−18.6 to −14.3).
Near-zero absolute error at EDD
$ \ge $
 28 °C does not mean the models reproduce extreme heat well. EDD totals at these cutoffs are small and rare across most of Europe in 1994–2014, so absolute errors shrink whether or not the tail is well simulated. Mean MAE at EDD-28 still falls by 19–46% in relative terms, so small absolute gains are not negligible proportionally.
KS distance from ERA5 at EDD-0 drops from 0.47–0.64 to 0.24–0.25 after bias adjustment. At EDD-28, KS also falls from 0.36–0.44 to 0.20–0.21. Although KS distance falls at EDD-28, the near-zero absolute tail metrics mainly reflect the rarity of high-threshold EDD and do not establish accurate reproduction of damaging extremes.
4. Discussion
Bias-adjusted CMIP6 data improve moderate-threshold EDD (0–12 °C), with MAE reductions of 23–86 °C
$ \cdot $
 days, but add little at extreme thresholds (28–32 °C), where
$ \Delta $
 Skill is 1–4 °C
$ \cdot $
 days at EDD-28. That split matches known limits of quantile-mapping correction, which can distort distribution tails even while fixing means and central quantiles (Lanzante et al., Reference Lanzante, Dixon, Nath, Whitlock and Adams-Smith2018; Di Luca et al., Reference Di Luca, Pitman and de Elía Elía2020; Lafferty and Sriver, Reference Lafferty and Sriver2023).
Moderate-threshold gains follow correction of the raw CMIP6 cold bias. EDD at 0–12 °C is driven mainly by the distribution body, so bias adjustment performs well there. Applications that depend on baseline growing-season heat accumulation can use bias-adjusted data with fewer concerns.
At 28–32 °C, EDD responds to rare intense heat in the warm tail, where bias-adjustment performance is especially consequential and can vary by method and setting (Dosio, Reference Dosio2016; Di Luca et al., Reference Di Luca, Pitman and de Elía Elía2020; Iturbide et al., Reference Iturbide, Casanueva, Bedia, Herrera, Milovac and Gutiérrez2022). Lafferty et al. (Reference Lafferty, Sriver, Haqiqi, Hertel, Keller and Nicholas2021) show that bias-corrected and downscaled models underestimate the largest weather-induced maize yield declines. At EDD-28, bias adjustment lowers KS statistics from 0.36–0.44 to 0.20–0.21, although absolute MAE gains remain small because high-threshold EDD is rare.
For impact work, the practical split is by threshold. In this in-sample comparison, bias-adjusted CMIP6 agrees more closely with ERA5 for heat metrics at or below 12 °C. Studies tied to crop damage cutoffs above 28–30 °C (Schlenker and Roberts, Reference Schlenker and Roberts2009; Lobell et al., Reference Lobell, Hammer, McLean, Messina, Roberts and Schlenker2013) should check bias-adjusted input at those cutoffs before use. The same principle applies whenever an impact model depends on a specific part of the temperature distribution.
We recommend checking bias-adjusted data against the threshold an application actually uses. For EDD
$ \le $
 12 °C, bias-adjusted output usually beats raw CMIP6 on MAE across models, crops, and regions.We did not evaluate thresholds between 12 and 28 °C; applications using intermediate cutoffs require separate assessment. At EDD
$ \ge $
 28 °C, average MAE improvements are small, and outcomes vary across locations and crops; bias-adjusted fields should not be treated as definitive.
Small absolute errors at EDD
$ \ge $
 28 °C should not be read as proof that bias-adjusted data capture extreme heat. High-threshold EDD is rare in the 1994–2014 European record, so absolute errors shrink for any model. The available absolute-error diagnostics therefore provide limited evidence about performance for rare damaging events.
ERA5 is a practical reference because CIL-GDPCIR is calibrated to it, but it remains a reanalysis rather than direct station observation; model rankings and extreme-temperature evaluation can differ across reanalysis and observation-based references (Hersbach et al., Reference Hersbach, Bell, Berrisford, Hirahara, Horányi, Muñoz-Sabater, Nicolas, Peubey, Radu, Schepers, Simmons, Soci, Abdalla, Abellan, Balsamo, Bechtold, Biavati, Bidlot, Bonavita, De Chiara, Dahlgren, Dee, Diamantakis, Dragani, Flemming, Forbes, Fuentes, Geer, Haimberger, Healy, Hogan, Hólm, Janisková, Keeley, Laloyaux, Lopez, Radnoti, Rosnay, Rozum, Vamborg, Villaume and Thépaut2020; Thorarinsdottir et al., Reference Thorarinsdottir, Sillmann, Haugen, Gissibl and Sandstad2020). We use three CMIP6 models, and the threshold pattern is similar across the three examined here; broader model coverage is needed before attributing that pattern to the correction method generally. Europe is a temperate test case. Tropical and subtropical regions, where extreme heat is more common, may show different behavior. Extending the analysis to other regions, correction products, and future periods with more frequent extremes is the next step. For wheat, barley, and rice, multiple SAGE calendars are pooled within crop; results therefore represent the included calendar variants rather than a harvested-area-weighted choice among varieties. Calendar windows that cross the year boundary are evaluated on the same day-of-year sets for all sources within a single calendar year, and leap days are not aligned between ERA5 and 365-day model calendars; both affect the three sources identically and mainly touch winter months with negligible high-threshold EDD.
5. Conclusion
Bias-adjusted CMIP6 temperature data improve agreement with ERA5 for moderate heat exposure metrics (EDD
$ \le $
 12 °C), with mean MAE reductions of 23–86 °C
$ \cdot $
 days depending on model and threshold. Gains at extreme-threshold metrics are small on average and mixed across regions and crops (EDD
$ \ge $
 28 °C). These in-sample results do not by themselves establish accurate reproduction of rare damaging heat events.
Impact studies should validate bias-adjusted input at the thresholds their damage functions use instead of treating corrected data as uniformly better than raw output. This evaluation across seven crops, seven thresholds, and European ADM1 regions shows where bias adjustment helps EDD and where it does not.
Open peer review
To view the open peer review materials for this article, please visit http://doi.org/10.1017/eds.2026.10068.
Supplementary material
The supplementary material for this article can be found at http://doi.org/10.1017/eds.2026.10068.
Data availability statement
Code and aggregated data are available at https://doi.org/10.5281/zenodo.19322211 and https://github.com/takyurp09/edd-bias-adjustment-europe. ERA5 data were obtained from the Copernicus Climate Data Store (https://cds.climate.copernicus.eu). Raw CMIP6 data were accessed via Pangeo (https://pangeo.io). Bias-adjusted CMIP6 data (CIL-GDPCIR) were obtained from Microsoft Planetary Computer (https://planetarycomputer.microsoft.com). GAEZ v4.0 harvested area data are available from FAO (https://gaez.fao.org). SAGE global crop calendar data are available from Sacks et al. (Reference Sacks, Deryng, Foley and Ramankutty2010).
Acknowledgments
The author thanks Dr. James Rising for helpful discussions and feedback. OpenAI Codex (GPT-5, accessed September 2026; https://openai.com/codex/) was used to assist with code review, manuscript language editing, consistency checking, and document preparation. Cursor AI (accessed September 2026; https://cursor.com/) was additionally used for an independent quality-control review. The author reviewed and verified all AI-assisted outputs, calculations, citations, and revisions, and remains fully responsible for the content of the article.
Author contribution
Conceptualization: M.T.T.; Data curation: M.T.T.; Formal analysis: M.T.T.; Methodology: M.T.T.; Visualization: M.T.T.; Writing—original draft: M.T.T.; Writing—review and editing: M.T.T.
Funding statement
This work received no specific grant from any funding agency, commercial, or not-for-profit sectors.
Competing interests
The author declares no competing interests.
Provenance statement
This article is part of the Climate Informatics 2026 proceedings and was accepted in Environmental Data Science on the basis of the Climate Informatics peer review process.




 Open access


Comments
Dear Editors,
Please consider my manuscript, “Evaluating Bias-Adjusted Climate Data for Extreme Heat Metrics in Agricultural Applications,” for publication as an Application Paper in Environmental Data Science.
This article evaluates whether bias adjustment improves Extreme Degree Day metrics derived from CMIP6 climate-model output for agricultural applications. Using ERA5 as a reference, the analysis compares raw and bias-adjusted projections across seven temperature thresholds, seven crops, multiple climate models, and European ADM1 regions. The results show substantial improvements at low and moderate thresholds but only small gains at extreme thresholds, demonstrating the importance of validating climate inputs against the specific nonlinear metrics used in impact studies.
The article is part of the Climate Informatics 2026 proceedings and was accepted for publication in Environmental Data Science on the basis of the Climate Informatics peer-review process. The submitted version incorporates necessary corrections and minor formatting updates. A marked-up manuscript is included to identify changes made following the conference version.
The manuscript is original, is not under consideration elsewhere, and has not been published previously, except as part of the Climate Informatics conference process. I have no competing interests to declare. Data and code supporting the analysis are publicly available through the repositories identified in the manuscript.
Thank you for considering this submission.
Sincerely,
Muhammad Taky Tahmid
School of Marine Science and Policy
University of Delaware
Newark, Delaware, USA