


1. Introduction
The draw-a-map task, a standard in studies of perceptual dialectology, has changed relatively little since its modern incarnation by Dennis Preston in the early 1980s (e.g., Bounds & Sutherland, Reference Bounds and Sutherland2018; Montgomery & Cramer, Reference Montgomery, Cramer, Cramer and Montgomery2016:11–15; Preston, Reference Preston and Warkentyne1981). Preston describes the methodology of the draw-a-map task in his first study examining Hawaiian perspectives of American dialects thus: “[I]nformants drew in boundaries on maps which already contained an outline of the United States and the individual states. Less detail left people puzzled with the geographical task” (1981:193). The outline map with state boundaries and no other information has been the default standard for perceptual dialectology studies in the US and beyond (e.g., Alfaraz & Mason, Reference Alfaraz and Mason2019; Benson, Reference Benson2003; Hartley, Reference Hartley and Preston1999; Jeon & Cukor-Avila, Reference Jeon and Cukor-Avila2015; Long, Reference Long and Preston1999; Long & Yim, Reference Long, Cheol Yim, Long and Preston2002; Preston, Reference Preston and Warkentyne1981, Reference Preston1986, Reference Preston and Schneider1996). While several studies have used survey maps that contain additional information, like locations and names of municipalities, highways, rivers, lakes, topography (e.g., Bounds, Reference Bounds2010, Reference Bounds2015; Cukor-Avila et al., Reference Cukor-Avila, Lisa Jeon, Rector and Shelton2012; Demirci, Reference Demirci, Long and Preston2002; Evans, Reference Evans2011, Reference Evans2013b; Evans, Dunbar & Chartier, Reference Evans, Dunbar and Chartier2020; Miłobóg & Garrett, Reference Miłobóg and Garrett2011; Schiesser, Reference Schiesser2020; Stoeckle, Reference Stoeckle2014), only a handful of recent studies (e.g., Bounds & Sutherland, Reference Bounds and Sutherland2018; Lameli, Purschke & Kehrein, Reference Lameli, Purschke and Kehrein2008; Montgomery, Reference Montgomery2007) have attempted to examine the effects of different types of information on the draw-a-map survey instrument. This study is an attempt to further explore the impact of altering some aspect of the survey instrument map in the draw-a-map task using insights from interdisciplinary work in geography of border representations on maps. The following research question is the focus of this paper: Do the representations of state borders as bold solid lines or light dashed lines on the draw-a-map task affect the number and types of dialect areas respondents identify?
2. Background
2.1. The draw-a-map task in perceptual dialectology
As the field of perceptual dialectology has grown in popularity in the US and around the world, largely through the work of Dennis Preston, outline maps have generally remained standard in the draw-a-map task even as the scope of perceptual dialectology has changed. Preston revealed an initial “false start” in the draw-a-map survey instrument when he originally gave respondents an outline map of the US with only national boundaries and no other information on the map: “The resulting confusion was so great that it became necessary to use a map with state lines” (Niedzielski & Preston, Reference Niedzielski and Preston2003:46). In addition, other maps, for example, a US map with state names (or abbreviations), were often provided to respondents for reference. For some time, the central focus of perceptual dialectology in the US has been on the perceptions of the country as a whole from residents of particular states, cities, or, more recently, cultural groups (e.g., Alfaraz & Mason, Reference Alfaraz and Mason2019; Fought, Reference Fought, Long and Preston2002, Hartley, Reference Hartley and Preston1999; Preston, Reference Preston and Warkentyne1981, Reference Preston1986, Reference Preston and Schneider1996). Since the early 2000s, the scope of perceptual dialectology studies (and the corresponding survey maps) has narrowed to smaller regions of the US (e.g., Benson, Reference Benson2003; Cramer, Reference Cramer2010; Weirich, Reference Weirich2018) and to individual states (e.g., Braun, Reference Braun2020; Bucholtz et al., Reference Bucholtz, Nancy Bermudez, Edwards and Vargas2007; Cramer, Reference Cramer2016; Cukor-Avila et al., Reference Cukor-Avila, Lisa Jeon, Rector and Shelton2012; Evans, Reference Evans2011, Reference Evans2013a-b).
Several recent studies, typically those focused on dialect perceptions of regions or single states in the US, included additional information on the draw-a-map survey instrument such as, for example, major highways, locations, and/or names of large cities (e.g., Bucholtz et al., Reference Bucholtz, Nancy Bermudez, Edwards and Vargas2007; Campbell-Kibler & Bauer, Reference Campbell-Kibler and Kathryn Bauer2015; Evans, Reference Evans2011, Reference Evans2013a-b, Reference Evans, Cramer and Montgomery2016; Evans et al., Reference Evans, Dunbar and Chartier2020; Schiesser, Reference Schiesser2020; Stoeckle, Reference Stoeckle2014; Weirich, Reference Weirich2018), and a small number of studies have sought to analyze what effects the inclusion of additional information on the maps has on the results (e.g., Bounds & Sutherland, Reference Bounds and Sutherland2018; Lameli et al., Reference Lameli, Purschke and Kehrein2008; Montgomery, Reference Montgomery2007). These studies suggest some priming influence of some types of information provided on maps but little effects on the types of perceptual dialect areas drawn. In pilot studies for his dissertation project investigating language perceptions in England, Montgomery (Reference Montgomery2007) experimented with three different methodologies in the draw-a-map task: (1) only a blank outline map of England and Wales; (2) the blank outline map along with a reference map with location dots and names of major cities and towns; or (3) an outline map with location dots of six major cities in England and the same reference map with location dots and names of major cities and towns. According to Montgomery, “[T]he inclusion of the city location map […] dramatically increase[ed] the number of lines drawn representing areas, but did not change the actual areas which were drawn […hence] the location dots [alone] do not seem to influence the percentage of informants drawing lines representing dialect areas based on the cities” (2007:347). Jeon (Reference Jeon2013) took a similar approach to Montgomery (Reference Montgomery2007) by studying South Koreans’ perceptions of dialects in Korea with the addition of one level of geographic information on maps, namely provincial areas. Jeon (Reference Jeon2013) used two different survey maps, one with solid black outlines of the national borders and a second that included lighter, dashed province boundaries, and noted that the map of Korea with province borders “appears to include a greater number of most salient dialect regions than the outline map” (63–64) though no quantitative statistical analysis was carried out.
Lameli et al. (Reference Lameli, Purschke and Kehrein2008) offered the first systematic comparison of several different map types with respondents receiving one of seven versions of a map of Germany on which they were to indicate the dialect areas they were familiar with. The first map was a blank outline map of Germany and the remaining six maps began with the outline map and added additional characteristics, specifically relief characteristics (with varying levels of gray shading to indicate elevations), major rivers and tributaries, state borders, location dots and names of the fifteen largest cities, location dots and names of 102 cities, and a combination of rivers and 102 cities. Though the identification of eight dialect areas, both in name and area, did not differ significantly across the map types, Lameli et al. (Reference Lameli, Purschke and Kehrein2008:§4) identified clear effects of the different stimuli. For example, the blank outline map produced the most spontaneous and varied responses, while the map with state boundaries produced a conceptual narrowing to specific regional prototypes. Meanwhile, the maps with cities primed regional speech patterns in a way that allowed for a degree of spontaneity, with the difference that the survey map with the fifteen largest cities leaned more toward prototypical areas, whereas the survey map with 102 cities prompted recognition of local dialect landscapes (not prototypes) (Lameli et al., Reference Lameli, Purschke and Kehrein2008:§4). Two studies in the US followed the methodology of Lameli et al. (Reference Lameli, Purschke and Kehrein2008). Cukor-Avila (Reference Cukor-Avila, Evans, Benson and Stanford2018) described a pilot study conducted in 2011 (see also Cukor-Avila et al., Reference Cukor-Avila, Lisa Jeon, Rector and Shelton2012) that used five maps of Texas with different types of information on them, as,for example, major cities, major cities and highways, and counties: “Maps that included the major cities and cities and highways appeared to influence respondents’ answers because most people circled only those cities as dialect areas” (33). Bounds and Sutherland (Reference Bounds and Sutherland2018) investigated the effects of differing information on six survey maps of the contiguous US and the state of Tennessee comparing the effects on national-level and state-level maps. Building on a blank outline map, five additional maps were created, each having one of the following: major cities, state capitals, interstates, topography, or state lines for the US map and county lines for the Tennessee map. At the national level, although respondents, regardless of map type, typically identified the same three major dialect areas—the South, the Northeast, and the West—they nonetheless seemed to be influenced by the information on the survey maps. Respondents used the maps’ features when identifying dialect areas, such as, for example, relying on state capitals and major cities as touchstones for dialect areas and state borders and interstates for dialect area demarcation (Bounds & Sutherland, Reference Bounds and Sutherland2018:159). Interestingly, the state-level maps did not show the same influences of the different features on the base maps that were observed at the national level, which Bounds and Sutherland (Reference Bounds and Sutherland2018:157, 161) attributed to respondents’ more intimate knowledge of the region and active disregard of the information on the survey maps. On the one hand, these studies suggest that the information provided on the survey instruments do not affect the major dialect areas identified. Yet, on the other hand, they indicate that information given on survey maps (or provided to respondents), undoubtedly influences the output through conceptual narrowing, priming of regional stereotypes, and the like.
These studies have begun addressing how the information on draw-a-map survey instruments affect results, and there is more work to be done. For instance, a primary characteristic of draw-a-map survey instruments, found on even the most basic survey instruments, has thus far received very little attention: the visual representation of state and national borders. We begin this effort by investigating whether representing state borders as bold, solid lines or light, dashed lines has an effect on respondents. We do so using the same base map for a definitive comparison of the effect of the border representation.
2.2. Borders and border representations
Interdisciplinary work in geography and linguistics, in particular, applying geographical tools and methods to investigate language perceptions is foundational to the study of perceptual dialectology (Preston Reference Preston and Warkentyne1981, Reference Preston1986; Preston & Howe, Reference Preston, Howe, Denning, Inkelas, McNair-Knox and Rickford1987) and has seen renewed application in recent years (e.g., Buchstaller & Alvanides, Reference Buchstaller and Alvanides2013; Cramer, Reference Cramer2010; Cukor-Avila et al., Reference Cukor-Avila, Lisa Jeon, Rector and Shelton2012; Evans, Reference Evans2011, Reference Evans2013a-b; Jeon, Reference Jeon2013; Montgomery & Stoeckle, Reference Montgomery and Stoeckle2013). At the same time, borders and border areas have been the focus of much recent scholarship in a variety of academic disciplines including geography, political science, anthropology, sociology, literature, and art (e.g., Diener & Hagen, Reference Diener and Hagen2012; Giudice & Giubilaro, Reference Giudice and Giubilaro2015; Kelly, Reference Kelly2015). The visual representations of borders have been of particular interest and their application to perceptual dialectology seems obvious:
Continuous lines are convenient symbols for borders because their apparent permanence cannot be contested. The linear representation of borders as lines reinforces the fixity and passivism of borders. With that, borders depicted as lines appear static, not experienced, and essential. However, dashed lines are also used to symbolize borders. Dashes disrupt continuous lines and present a sense of impermanence, experience, and fluidity. (Kelly, Reference Kelly2015:35)
We suspect that varied representations of borders visually may influence respondents, affecting the results in studies of perceptual dialectology.
Given that state borders have long been considered a critical component of the draw-a-map task in perceptual dialectology in the US (Niedzielski & Preston, Reference Niedzielski and Preston2003:46; Preston, 1981:193, Reference Preston1989) and that state borders have been shown to have conceptual narrowing and delineation effects on respondents (Bounds & Sutherland, Reference Bounds and Sutherland2018; Lameli et al., Reference Lameli, Purschke and Kehrein2008), it seems prudent to examine whether their representation influences respondents in studies of perceptual dialectology. This study investigates whether the representation of state borders as bold solid lines or light dashed lines on the draw-a-map survey affects the number and types of dialect areas respondents identify. Specifically, the following hypothesis is tested: Respondents using maps with dashed-line state borders will draw more multistate dialect areas (i.e., encompassing two or more states) than respondents using maps with solid-line state borders.
3. Methods
In this section, we describe the survey instruments, data collection procedures, and data analyses. Since our study was carried out with two different datasets, we detail each dataset before providing their corresponding results in section 4.
3.1. Survey instruments and analysis
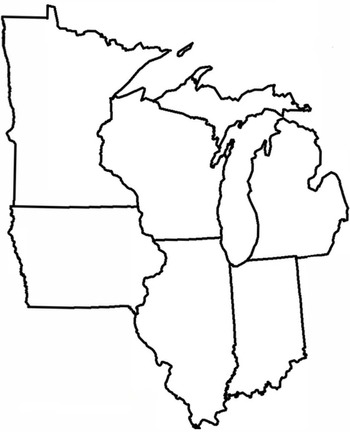
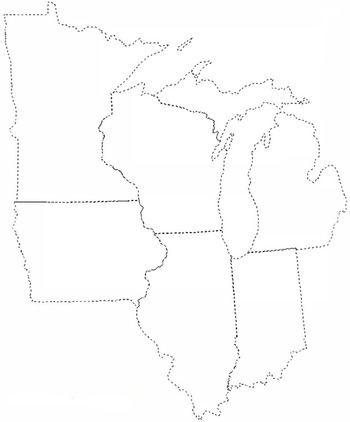
The survey instruments were paper-based and included a draw-a-map task of six states in the Midwest and the Upper Midwest—Minnesota, Wisconsin, Michigan, Iowa, Illinois, and Indiana —on one side of the page and a demographic survey on the back side. The following instructions were printed above the survey map: “1. Please draw a line or circle around areas where you think people speak different. 2. Next, write down what you’d call that way of talking. If you can, give an example of what’s different.” Respondents completed one of two versions of the draw-a-map survey, either with bold, solid-line state borders (see Map 1) or with light, dashed-line state borders (see Map 2).
Survey map with solid-line state borders.

Survey map with dashed-line state borders.

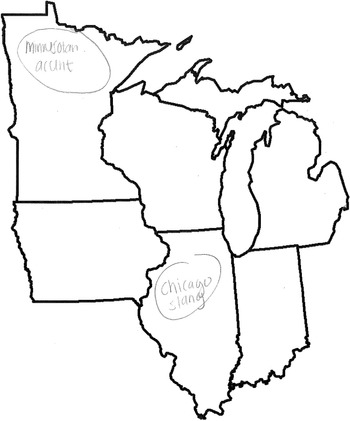
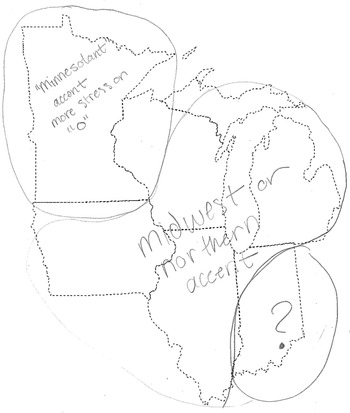
Following established procedures for Geographic Information System (GIS) analysis (Montgomery & Stoeckle, Reference Montgomery and Stoeckle2013), each respondent map was imported into ArcMap 10.4 and georeferenced with spatial locations, with the drawn dialect areas digitized and associated with the relevant map code, labels, comments, and vector data. The dialect areas were also labeled as either single state, that is, the dialect area is wholly within a single state, as illustrated in Map 3, or multistate, that is, the dialect area encompasses territory from more than one state, as seen in Map 4. For each dialect area, the number of states and names of included states were given as attributes.
Respondent map with examples of single-state dialect areas.

Respondent map with examples of multistate dialect areas.

3.2. Statistical analysis
To test the effects of the representations of the state boundaries on the number and types of polygons, a multivariate analysis of variation (MANOVA) would have been a good choice, but the data are not well suited for MANOVA (or ANOVA) for several reasons, including that the samples are not random,; sample sizes are unequal, homogeneity of covariance is violated (e.g., Box’s test p<.001), the dependent variables do not follow a normal distribution within each group (e.g., Shapiro-Wilk’s test p<.05), and outliers are present (and legitimate). Thus, to test the hypothesis and other effects, we used a Kruskal-Wallis test with Bonferroni correction of alpha to .025 (since two tests were run for each dataset).
4. Data samples and results
4.1. Dataset 1: sample
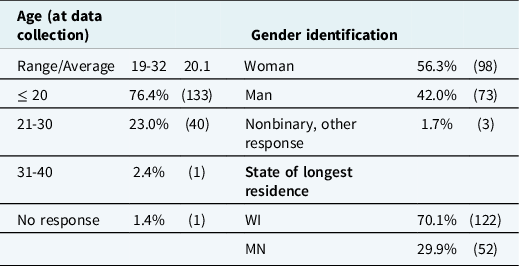
In dataset 1, 207 respondents, all undergraduates in introductory human geography courses at a regional comprehensive university in the Upper Midwest, were surveyed in fall 2016. The final respondent pool contained 174 long-term residents of Minnesota and Wisconsin; their demographic characteristics are given in Table 1.
Demographics of dataset 1 survey respondents

Notably absent is information about the race and ethnicity of respondents because our local Institutional Review Board advised against collecting data on race and ethnicity (which we had on the demographic survey originally submitted for review) as some respondents could be potentially identifiable in classes of predominately (overwhelmingly) white, European-American students. Respondents were eliminated from the respondent pool (numbers of respondents are given in parentheses after each criterion) for not completing the demographic survey (2); not providing a hometown (1); not being long-term residents of Minnesota or Wisconsin, defined as having been born in Wisconsin or Minnesota and lived at least three quarters of their life in one of those states, (15); and not drawing any dialect areas on the survey map (15).
In this dataset, 60 respondents completed the draw-a-map task with state borders represented as bold, solid lines, while 114 completed maps with state borders as light, dashed lines.
4.2. Dataset 1: results
The 174 respondents in this dataset drew 532 dialect areas in the draw-a-map task with a mean of 3.06 dialect areas/polygons (M = 3, s = 1.87) per respondent map. Respondents with solid-line border maps identified fewer dialect areas than respondents with dashed-line border maps. The solid-line border maps (n = 60) had 180 dialect areas with a mean of 3.00 (M = 3, s = 1.75), while dashed-line border maps (n = 114) had 352 dialect areas with a mean of 3.09 (M = 3, s = 1.94).
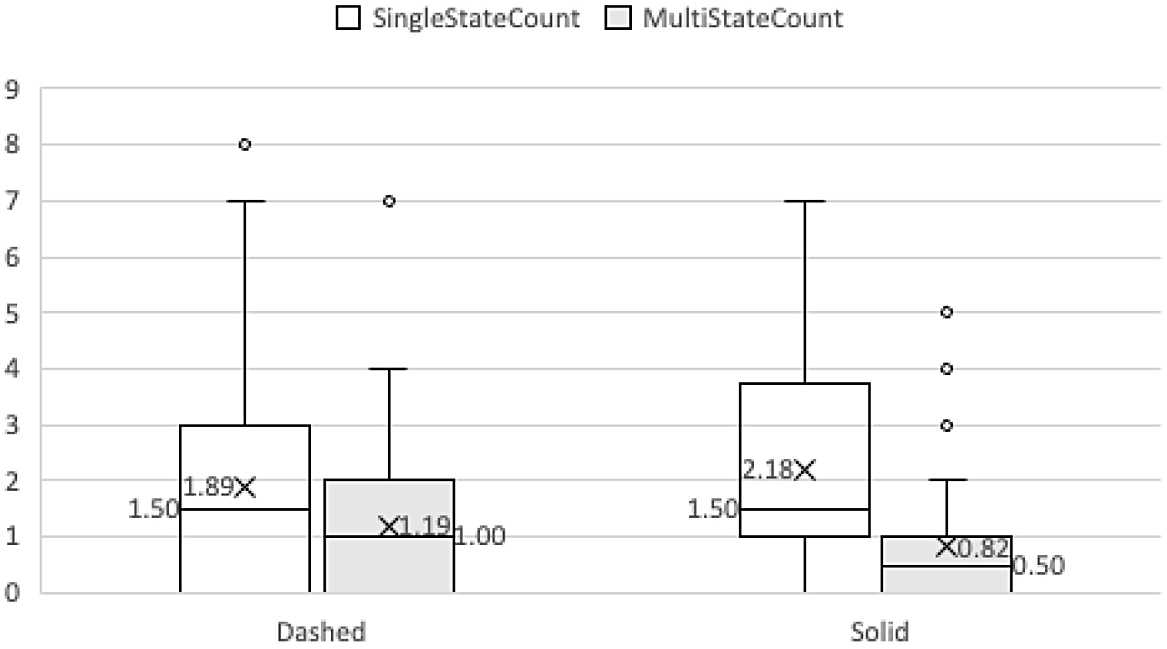
Over 80% (140) of respondents identified at least one single-state dialect area, that is, a dialect area entirely within a single state, accounting for 65.2% (347) of the dialect areas in the draw-a-map task, while over 62% identified at least one multistate dialect area, that is, a dialect area crossing state lines, encompassing territory from two or more states, accounting for the remaining 34.8% (185) of total dialect areas drawn. The data for each survey map type and dialect area type are displayed in Table 2 and Figure 1. Respondents with solid-line border maps were more likely to draw dialect areas within a single state than respondents with dashed-line border maps: 91.7% of solid-line border maps compared to 74.6% of dashed-line border maps contained at least one single-state dialect area, and the mean number of single-state dialect areas per respondent map is higher for solid-line border maps, 2.18 (M = 1.5, s = 1.71) than for dashed-line border maps, 1.89 (M = 1.5, s = 1.83). The Kruskal-Wallis test showed no significant interaction between map type and single-state dialect areas/polygons, H(1) = 1.75, P = .176.
Single-state and multistate polygons/dialect areas drawn by map type for dataset 1

Single-state and multistate dialect areas with means and medians for dataset 1.

Respondents using maps with solid-line borders were less likely to draw multistate dialect areas than those with maps with dashed-line state borders. Indeed, 50% (30) of respondents using solid-line state border maps drew at least one multistate dialect region with a mean of .82 (M = .5, s = 1.07) multistate dialect areas per respondent map compared with 69.3% of respondents using dashed-line state border maps with a mean of 1.19 (M = 1, s = 1.17). The Kruskal-Wallis tests with Bonferroni correction, α=.025, revealed a significant interaction between map type and multistate dialect regions/dialect regions, H(1) = 5.13, P = .017.
This statistical test provides support for the hypothesis that respondents using maps with dashed-line state borders will draw more multistate dialect areas than respondents using maps with solid-line state borders, allowing us to reject the null hypothesis. In this dataset, respondents given maps with dashed-line state borders drew more multistate polygons than respondents using solid-line state border maps. There is no significant difference in the number of single-state dialect areas by map type, but the difference in the number of respondents drawing multistate dialect areas is intriguing. The dashed-line state borders may have affected respondents in two ways. State boundaries on maps are typically represented with solid lines, so the dashed-line state borders are anomalous, new, and perhaps inviting. Dashed-line state borders also give the impression of permeability or porousness making them seem more crossable than traditional solid-line borders. Of course, we know from studies of dialectology that regional (and social) dialects do not exist solely within the confines of single states though some folk dialectology seems to encourage this perception with, for example, online articles and quizzes like, “10 things only Wisconsinites say” (Finstad, Reference Finstad2018) and “15 words you’ll only understand if you’re from Wisconsin” (Meli, Reference Meli2015) and books like How to talk Minnesotan (Mohr, Reference Mohr1987, Reference Mohr2013).
We found two other interesting observations in the data, one pointing to a difference between the map types and the other identifying a commonality. The mean dialect areas reported in Table 2 and Figure 1 are based on mean per respondent/map; however, if we look at the mean number of dialect areas by respondents who drew at least one such dialect area a different picture emerges. Looking at only respondents who drew at least one such dialect area, respondents with dashed-line maps typically drew more of each type of dialect area than respondents with solid-line maps. Respondents with dashed-line maps who drew at least one single-state dialect area identified on average 2.54 single-state dialect areas, while the same subset of respondents with solid-line maps identified on average 2.38. In the case of multistate dialect areas, dashed-line map respondents who drew at least one multistate dialect area identified on average 1.72, whereas those with solid-line border maps drew on average 1.63. These differences may not seem important, but they show a pattern of respondents with dashed-line maps drawing more dialect areas overall, a mean of 3.09 compared with 3.00 for solid-line maps, and of each type if they drew at least one of that type. It may be that the perceived permeability of dashed-line borders versus the perceived impermeability of solid-line borders explains this tendency. The second observation is that respondents, regardless of map type, drew a range of multistate dialect areas (see Table 3). The most common multistate dialect area encompassed two states, 47.0% for solid-line maps and 61.0% for dashed-line maps. For both map types, the multistate polygons included 3-, 4-, 5-, and 6-state polygons.
Span of multistate dialect areas by map type in dataset 1

4.3 Dataset 2: sample
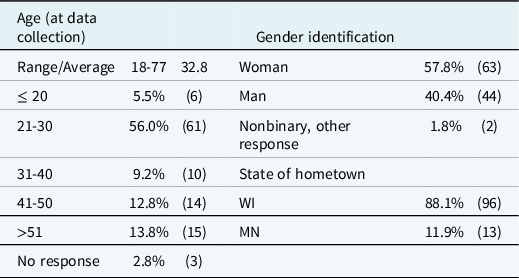
The study was repeated with a demographically more diverse group of respondents since the first dataset was composed entirely of college students (all but four of whom reported ages in the 19-23 range, and only one of whom reported an age over 30). Dataset 2 was a convenience sample of 135 respondents surveyed by trained student researchers in an upper-level sociolinguistics course in spring 2017. Similar to dataset 1, several respondents were eliminated from the pool (numbers of respondents are given in parentheses after each criterion) for not being long-term residents of Minnesota or Wisconsin, defined as having been born in Wisconsin or Minnesota and lived at least three quarters of their life in one of those states (23) or for not drawing any dialect areas (3). (Unlike the first dataset, there were no respondents who did not complete the demographic survey or did not provide a hometown.) The demographic characteristics of the 109 remaining respondents are given in Table 4.
Demographics of dataset 2 survey respondents

In this dataset, 58 respondents completed the draw-a-map task with state borders represented as solid lines, while 51 completed maps with state borders as dashed lines.
4.4. Dataset 2: results
The 109 respondents in dataset 2 drew 394 dialect areas in the draw-a-map task with a mean of 3.61 dialect areas per respondent map (M = 3, s = 2.24). Respondents with solid-line border maps identified fewer dialect areas than respondents with dashed-line border maps: the solid-line border maps (n = 58) had 203 dialect areas with a mean of 3.50 (M = 3, s = 2.35), while dashed-line border maps (n = 51) had 191 dialect areas with a mean of 3.75 (M = 3, s = 2.12).
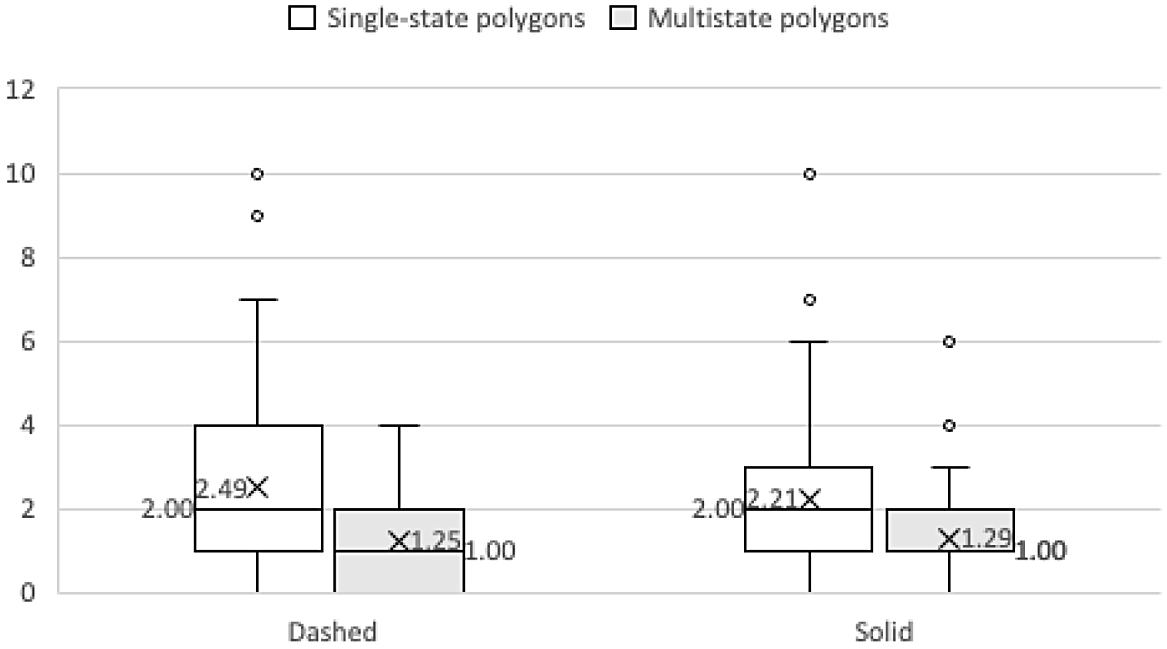
Nearly 79% (86) of respondents identified at least one single-state dialect area, accounting for 64.7% (255) of total dialect areas in the draw-a-map task, whereas just over 75% (82) of respondents identified at least one multistate dialect area, accounting for the remaining 35.3% (139) of dialect areas drawn. The data for each survey map type and dialect area type are displayed in Table 5 and Figure 2. Respondents with solid-line border maps were slightly more likely to draw dialect areas within a single state than respondents with dashed-line border maps: 79.3% of solid-line border maps versus 78.4% of dashed-line border maps contained at least one single-state dialect area; however, the respondents using dashed-line border maps individually drew more single-state dialect areas, 127 for a mean of 2.49 (M = 2, s = 2.32) single-state dialect areas per respondent map than respondents with solid-line border maps, 128, with a mean of 2.21 (M = 2, s = 2.08). The Kruskal-Wallis test showed no significant interaction between map type and single-state dialect areas, H(1) =. 34, P = .556. The respondents using maps with solid-line borders were also more likely to draw multistate dialect areas: 79.3% (46) of respondents using solid-line state border maps drew at least one multistate dialect area with a mean of 1.29 (M = 1, s = 1.11) multistate dialect areas per respondent map compared with 61.6% (36) of respondents using dashed-line state border maps with a mean of 1.25 (M = 1, s = 1.13). The Kruskal-Wallis test showed no significant interaction between map type and multistate dialect areas, H(1) = .06, P = .798. This pattern runs counter to what was found in dataset 1, and this discrepancy is examined more in the next section.
Single-state and multistate polygons/dialect areas by map type for dataset 2

Single-state and multistate dialect areas with means and medians for dataset 2.

As in dataset 1, we find that among respondents with dashed-line border maps, those who drew a single-state or multistate dialect area drew more such dialect areas than respondents with solid-line border maps. Respondents with dashed-line border maps who drew at least one single-state or multistate dialect area averaged 3.18 and 1.78 such dialect areas, respectively, while respondents with solid-line border maps who drew at least one single-state or multistate dialect area averaged 2.78 and 1.63, respectively. As in dataset 1, respondents, regardless of map type, drew a range of multistate dialect areas, as depicted in Table 6. Again, the most common multistate dialect area type encompassed two states, 70.1% for solid-line maps and 58.7% for dashed-line maps. For both map types, there were a range of multistate dialect areas, though curiously no five-state dialect areas were drawn for the solid-line border maps.
Span of multistate dialect areas by map type in dataset 2

5. Discussion and conclusions
Several patterns emerge in the comparison between survey maps with solid-line and dashed-line borders across the two datasets, and we highlight commonalities before turning the discussion to differences, in particular, the obvious difference with respect to the hypothesis that respondents with dashed-line maps would draw more multistate dialect areas than those with solid-line maps. The first similarity across the map types and datasets is that a high percentage of respondents drew at least one dialect area within a single state: In dataset 1, 91.7% of respondents with solid-line maps and 74.6% of respondents with dashed-line maps and in dataset 2, 79.3% of solid-line map and 78.4% of dashed-line map respondents drew at least one single-state dialect area. There were no significant differences within the datasets in the number of single-state dialect areas between the two map types, so there appears to be no effect of the solid-line versus dashed-line borders on single-state dialect areas.
A second similarity is that more single-state dialect areas are drawn than multistate dialect areas in solid-line and dashed-line maps in both datasets. In dataset 1, solid-line map respondents drew 131 single-state dialect areas as compared to 49 multistate dialect areas and dashed-line map respondents drew 216 and 136, respectively. In dataset 2, solid-line map respondents drew 128 single-state dialect areas and 75 multistate dialect areas, while dashed-line map users drew 127 and 64, respectively. Generally, a higher percentage of respondents also drew at least one single-state dialect area than multistate dialect area; the one exception is in dataset 2, the number of solid-line map respondents drawing at least one single-state dialect area is the same as those drawing at least one multistate dialect area. Across all map types, there is a greater tendency to perceive more dialect areas within single states rather than across states. Both of these patterns may, in part, reflect the folk linguistic belief perpetuated in popular media of states having their own, unique dialects that do not cross state lines. Videos like “50 people show us their state’s accents” (Condé Nast Traveler, 2019) and “Michigan accent and slang introductory training” (Redoute, Reference Redoute2020) and articles like “The Michigan accent and slang words” (Palen, Reference Palen2021) and “10 things only Wisconsinites say” (Finstad, Reference Finstad2018) as well as books like How to talk Minnesotan (Mohr, Reference Mohr1987, Reference Mohr2013), all of which associate regional dialects with individual states, are ubiquitous and popular. In addition, these results align with Lameli et al.’s (Reference Lameli, Purschke and Kehrein2008) and Bounds and Sutherland’s (Reference Bounds and Sutherland2018:150) findings of conceptual narrowing in response to state borders on survey maps and, in fact, bolster Bounds and Sutherland’s (Reference Bounds and Sutherland2018) observation that state boundaries provide a strong delineation factor.
A third similarity across both the solid-line and dashed-line maps in the two datasets is that, although the multistate dialect areas range in size, the highest percentage encompass two states. In dataset 1, two-state dialect areas account for 47.0% of solid-line and 61.0% of dashed-line maps’ multistate dialect areas, and in dataset 2, 70.1% of solid-line and 58.7% of dashed-line maps. This pattern is not surprising given the small subset of states on the survey map; this pattern would likely change in maps of a larger scale, as in for example national survey maps.
Alongside these similarities are two related patterns highlighting a difference between the solid-line and dashed-line survey maps. Overall, in both datasets, respondents who completed dashed-line maps drew more dialect areas on average than respondents with solid-line maps. In dataset 1, respondents with dashed-line maps drew on average 3.09 dialect areas compared with 3.00 for respondents with solid-line maps; in dataset 2, respondents with dashed-line maps drew on average 3.75 dialect areas compared with 3.50 for respondents with solid line maps. This pattern does not hold across both datasets for both types of dialect areas (see Tables 1 and 3). However, a more subtle pattern across both datasets emerges. Respondents using maps with dashed-line borders who drew at least one single-state or multistate dialect area drew more of those dialect areas on average than respondents with solid-line border maps. In dataset 1, respondents with dashed-line maps who drew at least one single-state dialect area averaged 2.54 single-state dialect areas, whereas the same subset of respondents with solid-line maps averaged 2.38. For multistate dialect areas, dashed-line map respondents who drew at least one multistate dialect area averaged 1.72, while those with solid-line maps averaged 1.63. In dataset 2, the same subset of respondents using dashed-line maps averaged 3.18 single-state dialect areas compared with 2.78 for solid-line map respondents, and, for multistate dialect areas, dashed-line map respondents averaged 1.78 compared to solid-map respondents’ 1.63 multistate dialect areas. The tendency to draw more dialect areas on dashed-line maps if a respondent has drawn one may stem from the light, dashed-line borders appearing more permeable and giving an air of invitation or even permission to respondents to see connections once they have invested in drawing at least one dialect area. The light, dashed-line borders contrast with the bold, solid-line borders in a way that may have a more pronounced delineating effect if respondents have chosen to invest in the task.
The key difference between the datasets and map types is that dataset 1 provided support for the hypothesis that respondents using maps with dashed-line state borders would draw more multistate dialect areas than those using maps with solid-line state borders, while dataset 2 did not support the hypothesis. The results from dataset 1 seem to provide evidence that characteristics of the draw-a-map task affect respondents’ representations of dialects in a given area. Bounds and Sutherland (Reference Bounds and Sutherland2018) and Lameli et al. (Reference Lameli, Purschke and Kehrein2008) found distinct effects of certain types of information on the survey instrument map, particularly, state borders at the national level. Bounds and Sutherland (Reference Bounds and Sutherland2018:154–55) also found that the effects of county lines at the state level did not mirror the effects of state lines at the national level. At the same time, the results in dataset 2 seem to follow Lameli et al. (Reference Lameli, Purschke and Kehrein2008:§4) and Montgomery (Reference Montgomery2007:347) in their findings that the information on survey instrument maps does not affect the types and numbers of dialect regions identified by respondents. Furthermore, the map in the current study is a regional map of six states, which lies between the national- and state-level maps in the Bounds and Sutherland (Reference Bounds and Sutherland2018) study. As such, it may be possible that we are seeing an effect similar to the state-level effect in Bounds and Sutherland (Reference Bounds and Sutherland2018) of familiarity with the region affecting the results differently across the two datasets. This effect as well as concerns about replication and reproducibility of results in the social sciences (e.g., Gilbert, King, Pettigrew & Wilson, Reference Gilbert, King, Pettigrew and Wilson2016; Open Science Foundation, 2015) may have to do with some other characteristics such as personality factors, life experiences, and attitudes of the respondents in the datasets.
Recent studies have associated life experiences with expressed language perceptions. Benson and Risdal (Reference Benson, Risdal, Evans, Benson and Stanford2018) found that respondents who had taken a linguistics course were significantly more accepting of statements promoting sociolinguistic diversity, which transferred into rating sentences containing regional or social features of American English higher on scales of correctness than respondents who had not taken a linguistics course. Evans et al. (Reference Evans, Dunbar and Chartier2020:6) in their study of Cardiff residents’ perceptions of English dialects in the United Kingdom found that respondents who indicated more travel experience also drew more dialect areas than those who indicated less travel experience. Though all respondents from datasets 1 and 2 were born in Wisconsin or Minnesota and lived at least three quarters of their lives in those states, the two datasets in this study are certainly different. Dataset 1 is composed entirely of undergraduate college students with an average age of 20.1, nearly all of whom were in their early twenties at the time of data collection (only one was over thirty), while dataset 2 contains a broader range of occupations and life stages, with an average age of 32.8 and a range of 18-77. It is possible that those in dataset 2 have more life experiences and more exposure to people from different areas that may allow even those with solid-line maps to identify more multistate dialect areas than hypothesized. We compared the number of multistate dialect areas drawn by older respondents (those born before 1989) and younger respondents (those born in 1990 or later) who completed solid-line maps in dataset 2 and found no significant differences, H(1) =. 02, P = .871, so age alone is not an explanatory factor. It is also possible that some other characteristic may account for the difference in the results with respect to the hypothesis. In any case, these findings point to the need for further studies on the effects of additional information on survey maps as well as life experience or other attitudinal characteristics that may help account for the wide range of individual variation in studies of perceptual dialectology (e.g., Bounds & Sutherland, Reference Bounds and Sutherland2018; Montgomery, Reference Montgomery2007; Schiesser, Reference Schiesser2020).
Acknowledgments
We owe an enormous debt of gratitude to Anna Khan, an undergraduate research assistant, who processed the second dataset; this project would not have been possible without her help. We are also grateful to two anonymous reviewers, whose thoughtful feedback helped improve the paper. Generous support for this project was provided by the University of Wisconsin Eau Claire’s Office of Research and Sponsored Programs through the Faculty Sabbatical Leave Program and Student Blugold Commitment Differential Tuition funds, specifically the Summer Research Experiences for Undergraduates program and the Student/Faculty Research Collaboration program.
Competing interests
The authors declare none.