Growers of the southeastern United States, a region where grain sorghum is primarily used as an animal feedstock for the local poultry and hog industries, have expressed renewed interest in planting grain sorghum following winter wheat (Triticum aestivum L.) (Shore Reference Shore2015). Research has shown that weed management is critical for successful grain sorghum production, especially between the second and fourth week after planting when weed growth can exceed crop development (Burnside and Wicks Reference Burnside and Wicks1967; Burnside and Wicks Reference Burnside and Wicks1969; Everaarts Reference Everaarts1993; Stahlman and Wicks Reference Stahlman and Wicks2000). Early-season competition by uncontrolled pigweeds, puncturevine (Tribulus terrestris L.), Russian-thistle (Salsola tragus L.), kochia [Kochia scoparia (L.) Schrad.], and stinkgrass [Eragrostis cilianensis (All.) Vign. ex Janchen] has been shown to reduce grain yield by 8% when rainfall following crop emergence was only 42% of the monthly average. However, in the absence of weed management yield losses increased by 25% when precipitation reached 72% of the monthly average (Wiese et al. Reference Wiese, Collier, Clark and Havelka1964). In a competition study, Moore et al. (Reference Moore, Murray and Westerman2004) reported sorghum grain yield reduction of 5.3% to 9.1% for each kilogram of Palmer amaranth dry weight per fifty square meters.
Herbicides are not commonly developed specifically for use in grain sorghum due to limited grain sorghum production worldwide and market opportunities (Stahlman and Wicks Reference Stahlman and Wicks2000). Herbicides are available to control broadleaf weeds in sorghum. However, herbicide options for grass control are extremely limited due to the lack of differential tolerance between grasses and grain sorghum (Stahlman and Wicks Reference Stahlman and Wicks2000). Additionally, troublesome weeds have been documented to develop resistance to some herbicides commonly used in grain sorghum. For example, in the southeastern United States, resistance to photosystem II (PSII)-inhibiting herbicides has been reported in common lambsquarters (Chenopodium album L.), Palmer amaranth, and smooth pigweed (Amaranthus hybridus L.), whereas resistance to acetolactate synthase (ALS)-inhibiting herbicides has been reported in common cocklebur (Xanthium strumarium L.), common ragweed (Ambrosia artemisiifolia L.), and Palmer amaranth (Heap Reference Heap2017).
Several agronomic and weed management strategies have been identified that can alleviate the development and spread of herbicide resistance (Norsworthy et al. Reference Norsworthy, Ward, Shaw, Llewellyn, Nichols, Webster, Bradley, Frisvold, Powles, Burgos, Witt and Barrett2012). Some practices that promote crop competitiveness, such as crop rotation and the use of narrower row spacing or increased crop density, also reduce weed growth and fecundity and the soil seedbank (Harder et al. Reference Harder, Sprague and Renner2007; Jha et al. Reference Jha, Norsworthy, Bridges and Riley2008; Walsh and Powles Reference Walsh and Powles2007; Yelverton and Coble Reference Yelverton and Coble1991). Previous research focused on corn (Zea mays L.) and soybean [Glycine max (L.) Merr.] confirmed the benefits of narrower rows and higher crop population density on weed control and crop yield (Buehring et al. Reference Buehring, Nice and Shaw2002; Nice et al. Reference Nice, Buehring and Shaw2001; Teasdale Reference Teasdale1998). Reduction in corn row width from 76 cm to 38 cm increased grain yield by 10% to 15% and improved sicklepod [Senna obtusifolia (L.) H.S. Irwin & Barneby] and arrowleaf sida (Sida rhombifolia L.) control by 5%, but did not have an effect on pitted morningglory (Ipomoea lacunosa L.) control (Norsworthy and Frederick Reference Norsworthy and Frederick2005). Common waterhemp (Amaranthus rudis Sauer) biomass and seed production was reduced 56% and 46%, respectively, in 19-cm soybean rows when waterhemp emergence was delayed from VE to V2-V3 soybean growth stages. Similar delayed waterhemp emergence in 76-cm soybean rows did not cause any weed biomass reduction and seed production was only 13% reduced (Steckel and Sprague Reference Steckel and Sprague2004). This response to row width was linked to a difference in the amount of photosynthetically active radiation (PAR) able to penetrate the soybean canopy. The authors found that, at the V2–V3 soybean growth stage, 98% and 45% of the available PAR was able to penetrate the soybean canopy in 76- and 19-cm rows, respectively.
Research on grain sorghum row spacing and population density has mainly focused on yield impact. Several studies demonstrated higher grain yield under favorable environmental conditions with narrower row width, due to higher density of plants per unit of surface area resulting from greater tillering in response to more equidistant plant spacing (Fromme et al. Reference Fromme, Fernandez, Grichar and Jahn2012; Jones and Johnson Reference Jones and Johnson1991; Maas et al. Reference Maas, Hanna and Mullinix2007; Staggenborg et al. Reference Staggenborg, Fjell, Devlin, Gordon and Marsh1999). Comparing the effects of velvetleaf (Abutilon theophrasti Medik.) and yellow foxtail [Setaria pumila (Poir.) Roemer & J.A. Schultes] competition on grain sorghum grain yield in Nebraska, Limon-Ortega et al. (Reference Limon-Ortega, Mason and Martin1998) reported greater yield loss in 76- versus 38-cm rows with adequate water supply, but no differences under drought conditions. Besançon et al. (Reference Besançon, Heiniger, Weisz and Everman2017) did not observe any effect of grain sorghum row spacing on large crabgrass [Digitaria sanguinalis (L.) Scop.] control, but reported reductions of 18% and 45% in large crabgrass density and biomass, respectively, when grain sorghum population density increased from 99,000 to 396,000 plants ha−1. Minimal research has been conducted to determine the influence of management practices that may provide supplemental weed control in grain sorghum. Therefore, a study was conducted to determine the influence of row spacing and grain sorghum population density on 1) Palmer amaranth control following PRE alone or PRE followed by (fb) POST herbicide applications, 2) Palmer amaranth density and biomass in the absence of herbicide treatment, and 3) grain sorghum growth and yield.
Materials and Methods
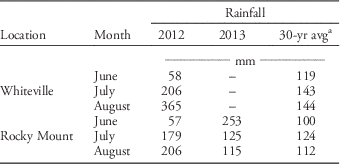
A field experiment was conducted twice during 2012: in a grower’s field near Whiteville, North Carolina, on an Aycock fine sandy loam with a pH of 6.5 and organic matter content of 1.8% (fine-silty, siliceous, subactive, thermic Typic Paleudults; 34°26′24.3″N, 78°38′10.4″W, 29 m above sea level) and at the Upper Coastal Plain Research Station near Rocky Mount, North Carolina, on a Wickham sandy loam with a pH of 5.7 and organic matter content of 1.3% (fine-loamy, mixed, semiactive, thermic Typic Hapludults; 35°59′17.0″N, 77°45′33.9″W; 23 m above sea level). A third field experiment was conducted during 2013 at the Upper Coastal Plain Research Station near Rocky Mount, North Carolina on a Roanoke loam with a pH of 6.4 and organic matter content of 2.3% (fine, mixed, semiactive, thermic Typic Endoaquults; 35°59′12.6″N, 77°45′47.5″W, 25 m above sea level). Conventional tillage was performed at all locations followed by field disking before planting grain sorghum. Seeds were planted on a flat seedbed at an average depth of 2.2 cm. Dekalb ‘DKS53-67’ grain sorghum was planted on June 19, 2012, at Whiteville and on June15, 2012, and 2013, at Rocky Mount. Standard fertilization and insect management practices recommended by the North Carolina Cooperative Extension Service were followed (Everman et al. Reference Everman, Heiniger, Weisz, Riar and Besancon2012). Fields were not irrigated because of the abundance of rainfall during the 2012 and 2013 growing seasons (Table 1).
Accumulated monthly rainfall and 30-yr average for two North Carolina locations in 2012 and 2013.
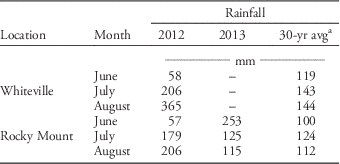
a Source: State Climate Office of North Carolina 2015.
Treatments were arranged as a three-factor factorial in a randomized complete block with treatments replicated four times at each location. Main factors consisted of row width, grain sorghum population density, and herbicide program. Grain sorghum was seeded either in 19-cm rows using a no-till drill (Model 3P606NT, Great Plains Ag, Salina, KS or Model Tye 2005, AGCO Corp, Duluth, GA) or in 38- or 76-cm rows using a vacuum planter (Model 1760, John Deere, Moline, IL, 61265). There were nine rows per plot at the 19-cm width, six rows per plot at the 38-cm width, and three rows per plot at the 76-cm width. Plots were 2.4 m wide and 9 m long at all locations. Seeding rates were adjusted within each row spacing to establish target grain sorghum population densities of 99,000; 198,000; 297,000; and 396,000 plants ha−1. Final grain sorghum population densities were determined 4 wk after planting (WAP) from three 2-m sections of row in each plot. Uniformity of grain sorghum density within treatments was confirmed with coefficients of variation ranging from 3% to 16% (data not shown). Plots were machine-harvested between mid-October and mid-November using a combine (Model Delta, Wintersteiger, Ried, Austria) specifically adapted for harvesting small plots. Crop weights were adjusted to 14% moisture.
Herbicide treatments included 1) a nontreated control, 2) S-metolachlor at 1,410 g ai ha−1 plus atrazine at 1,820 g ai ha−1 (Bicep II Magnum®, Syngenta Crop Protection, Greensboro, NC) PRE, and 3) S-metolachlor at 1,070 g ai ha−1 plus atrazine at 1,380 g ai ha−1 PRE fb 2,4-D (Weedar® 64, Nufarm Inc, Burr Ridge, IL) at 330 g ae ha−1 POST. Each year, herbicides were applied in water with a CO2-pressurized backpack sprayer equipped with XR1102 flat-fan nozzles (TeeJet, Glendale Heights, IL) calibrated to deliver 140 L ha−1 at 165 kPa. PRE treatments were applied within 24 h of grain sorghum seeding at each location. Depending on year and location, the first activating rainfall occurred between 24 h and 96 h following PRE application. In 2012, precipitation was greater than the 30-year average at all locations, with shortage in June and excess in July and August (Table 1). Despite the June deficit, the PRE herbicide received timely rainfall for incorporation with 3.7 and 2.8 cm of rainfall within the first 10 d following application at Whiteville and Rocky Mount, respectively. Rainfall greater than the 30-year average was recorded again in June 2013 at Rocky Mount, where 9 cm of rain within 10 d after spraying was sufficient for activating the PRE application. POST herbicide was applied 4 WAP when grain sorghum plant size ranged from 20 to 30 cm, corresponding to the V4 to V5 grain sorghum growth stage.
Palmer amaranth control was visually rated at 4, 7, and 10 WAP on a 0% (no control) to 100% (death of all plants) scale, according to a composite estimation of density reduction, growth inhibition, and foliar injury (Frans et al. Reference Frans, Talbert, Marx and Crowley1986). At 4 and 14 WAP, Palmer amaranth density was recorded in two 50- by 50-cm (0.25 m²) quadrats in the center of each nontreated plot. Palmer amaranth aboveground biomass was harvested from within the quadrats at 14 WAP. Collected plants were then placed in a forced-air oven at 65 C and their dry weight was measured after 1 wk of drying.
Growing degree days (GDD) were obtained from data provided by the State Climate Office of North Carolina website (http://www.climate.ncsu.edu). Growing degree day units were calculated using Equations 1 through 3 such that
 $$T_{{{\rm AVG}}} \, {\equals}\, \left[ {{{\left( {T_{{{\rm MAX}}} {\plus}T_{{{\rm MIN}}} } \right)} \over 2}} \right],$$
where T AVG is the estimated daily average temperature (C), T MAX is the daily maximum air temperature (C), and T MIN is the daily minimum air temperature (C).
 $$ {\rm GDD}\, {\equals}\, 0\;{\rm when}\;T_{{{\rm AVG}}} \,\lt\,T_{{{\rm BASE}}} ,$$
where GDD is the daily growing degree days and T BASE is the temperature below which GDD did not progress (McMaster and Wilhelm Reference McMaster and Wilhelm1997). Here, 10 C was used as T BASE (Gerik et al. Reference Gerik, Bean and Vanderlip2003). When T AVG≥T BASE, GDD was calculated as:
 $${\rm GDD}\, {\equals}\, T_{{{\rm AVG}}} {\minus}T_{{{\rm BASE}.}} $$
Gerik et al. (Reference Gerik, Bean and Vanderlip2003) showed that GDD for grain sorghum did not increase beyond an upper temperature threshold (T UT) of 38 C. Thus, whenever T MAX was greater than 38 C, T MAX was set equal to T UT.
Photosynthetically active radiation was measured at Whiteville in 2012 and Rocky Mount in 2013 at approximately 150 cumulative growing degree day (CGDD) intervals, starting at 250 CGDD. A 1-m-long line quantum sensor (Model LI-191R, LI-COR Inc, Lincoln, NE) was used to quantify PAR at the soil surface as well as above the crop canopy. Measurements were taken under cloudless sky conditions close to solar noon at two random locations in each PRE fb POST plot. The average percentage of light intercepted was calculated for each plot using these measurements.
Crop height was determined at boot stage by randomly selecting six grain sorghum plants within the PRE fb POST plots to avoid any potential interference due to competing weeds. The width and length of the flag leaves were also measured at Rocky Mount in 2012. Flag leaf area was estimated using an equation developed by Fisher and Wilson (Reference Fischer and Wilson1975):
 $${\rm Area}\left( {{\rm cm}^{2} } \right)\, {\equals}\, 0.54\,{\asterisk}\,\left( {l\,{\asterisk}\,w} \right){\plus}8.5$$
in which l is the length (cm) and w the maximum width (cm) of the leaf.
Data were subjected to PROC GLM in SAS release 9.4 (SAS Institute Inc, Cary, NC). Location, year, sorghum population density, row width, herbicide program, and all interactions containing these factors were considered fixed effects, whereas replications (nested within locations) were considered random effects. Mean comparisons were performed using Tukey’s HSD test when F values were statistically significant (P≤0.05). Because of unequal variance, visual estimates of weed control were arcsine square-root transformed prior to analysis using ANOVA (Grafen and Hails Reference Grafen and Hails2002). Because the transformation of the data did not change the separation of means, only nontransformed means are presented.
As suggested by Knezevic et al. (Reference Knezevic, Evans, Blankenship, Van Acker and Lindquist2002), a Gompertz model was used to describe the progression of light interception by the crop canopy:
 $$Y\, {\equals}\, a\,{\asterisk}\,{\rm exp}^{{\left( {{\minus}b\,{\asterisk}\,{\rm exp}^{{\left( {{\minus}kT} \right)}} } \right)}} $$
where Y is the percentage of light intercepted, a is the upper light interception asymptote, b and k are constants representing the displacement along the x axis (initiation time) and the rate at which the canopy is closing, respectively, and T is the number of CGDD after grain sorghum emergence. Nonlinear regression analysis using the PROC NLMIXED in SAS was used to evaluate light interception response to variations in row width or grain sorghum population density. CGDD was used as the independent variable, as recommended by Knezevic et al. (Reference Knezevic, Evans, Blankenship, Van Acker and Lindquist2002).
Results and Discussion
Palmer Amaranth Control, Density, and Biomass
Measurements taken within the quadrats at 4 WAP and averaged across treatments indicated that Palmer amaranth was the only weed species present at Whiteville, with 41 plants m−2. At Rocky Mount, where Ipomoea species were also present, Palmer amaranth was the dominant species with 7 and 19 plants m−2 in 2012 and 2013, respectively. Ipomoea species did not exceed 1 and 3 plants m−2.
A significant location effect (P≤0.01) was evident for Palmer amaranth control; therefore, results were analyzed by location. No significant effect of row spacing, grain sorghum population density, or herbicide strategy was observed 4 WAP, with ≥98% Palmer amaranth control at each location (data not shown).
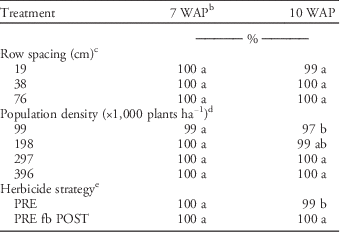
At Whiteville, in the absence of significant interaction, weed control data 7 and 10 WAP were presented by main effects (Table 2). Palmer amaranth control 10 WAP was affected by grain sorghum population density, with lowest control occurring at the lowest population density when averaged over row spacing and herbicide strategy.
Effect of row spacing, grain sorghum population density, and herbicide density on percentage of Palmer amaranth control at Whiteville, NC in 2012.Footnote a
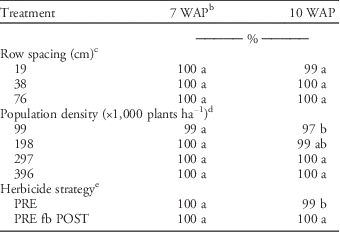
a Means within a column and treatment followed by the same letters are not different according to Tukey’s HSD test at P≤0.05.
b Abbreviation: WAP, weeks after planting.
c Data pooled over grain sorghum population density and herbicide strategy.
d Data pooled over grain sorghum row spacing and herbicide strategy.
e Data pooled over grain sorghum row spacing and population density.
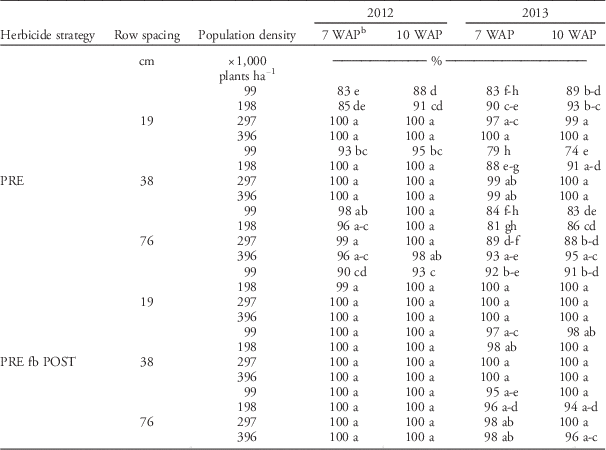
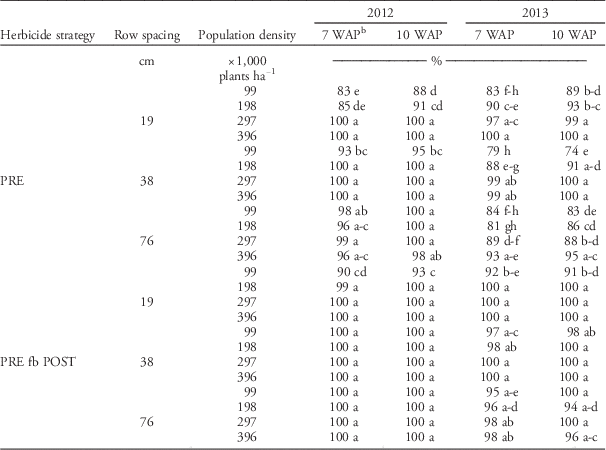
At Rocky Mount in 2012 and 2013, control 7 and 10 WAP was affected by row spacing by grain sorghum population density by herbicide strategy interaction (P≤0.01). Year was also significant; therefore, interaction results were analyzed by year. In 2012, Palmer amaranth control 7 WAP was 83% where the 19-cm row spacing was combined with the lowest grain sorghum population density and no POST herbicide application (Table 3). Increasing the population density from 99,000 to 297,000 plants ha−1 within the 19-cm row spacing increased Palmer amaranth control regardless of herbicide strategy. The same is true of the 38-cm row spacing when no POST was applied. When 2,4-D was applied, Palmer amaranth control exceeded 90% for all row spacings and grain sorghum population densities. In fact, control was >99% for all row spacings and grain sorghum population densities receiving 2,4-D POST, excluding the 19 cm row spacing by 99,000 plants ha−1 combination. Twenty treatments resulted in ≥98% control of Palmer amaranth 10 WAP and were not different from each other. Four treatment combinations had significantly lower weed control than 98%; three receiving PRE-only herbicide strategies and one that received both PRE and POST herbicide applications. For the strategy relying on PRE alone, reduced control was noted with the 99,000 plants ha−1 grain sorghum population density at the 19- and 38-cm row spacing, with 88% and 95% control, respectively. Palmer amaranth control was also lower (91%) for grain sorghum planted at 198,000 plants ha−1 in 19-cm rows. Control of Palmer amaranth was 93% where 2,4-D followed S-metolachlor plus atrazine with a 99,000 plants ha−1 grain sorghum population density planted in 19-cm rows. The inclusion of a POST application to the weed control strategy achieved complete Palmer amaranth control for 19-cm row and 198,000 plants ha−1 or 38-cm row and 99,000 plants ha−1.
Effect of row spacing, grain sorghum population density, and herbicide density on percentage of Palmer amaranth control at Rocky Mount, NC in 2012 and 2013.Footnote a
a Means within columns followed by the same letters are not different according to Tukey’s HSD test at P≤0.05.
b Abbreviation: WAP, weeks after planting.
In 2013 at Rocky Mount, precipitation following the PRE herbicide application was 2.5 times greater than the 30-year average, which may have resulted in increased leaching and more rapid breakdown of herbicides, ultimately contributing to reduced residual activity. Examining the influence of rainfall on the efficacy of different PRE and POST herbicides, Stewart et al. (Reference Stewart, Soltani, Nurse, Hamill and Sikkema2012) reported that precipitation exceeding 50% of the monthly average during the first two weeks after application could cause atrazine to leach, resulting in reduced efficacy in controlling weeds. Control of Palmer amaranth did, however, follow a similar trend to that observed in 2012 for several row spacing by grain sorghum population density by herbicide strategy combinations. In 2013, 100% control of Palmer amaranth 7 WAP was only achieved with six treatments compared to 15 treatments achieving 100% control in 2012 (Table 3). In 2013, Palmer amaranth control equal or superior to 94% was noted 7 and 10 WAP for all combinations that received 2,4-D POST, except for grain sorghum planted at 99,000 plants ha−1 in 19-cm rows. Where herbicide strategy was relying on PRE alone, Palmer amaranth control ranged from 81% to 90% at 99,000 and 198,000 plants ha−1 grain sorghum population densities and was lower than the highest grain sorghum population density for all row spacing options. Interestingly, Palmer amaranth control decreased at the highest grain sorghum population density as row spacing increased, regardless of herbicide strategy.
In 2013 at Rocky Mount, increased Palmer amaranth control was observed at 10 WAP compared 7 WAP. Similar results were seen in 2012. In the absence of POST application, less than 90% Palmer amaranth control was noted for the 99,000 plants ha−1 grain sorghum population density, whereas control exceeded 97% for the 396,000 plants ha−1 grain sorghum population density, regardless of row spacing. Additionally, Palmer amaranth control was reduced at the 76-cm row spacing compared to the 19- and 38-cm row spacings for grain sorghum population density >198,000 plants ha−1. Similar reductions in control were observed for the PRE fb POST herbicide strategy where grain sorghum population density was 198,000 or 396,000 plants ha−1 planted in 76-cm rows. Although in soybean, similar late-season control has been reported by Schultz et al. (Reference Schultz, Myers and Bradley2015), with 97% control of multiple-resistant common waterhemp in 19- and 38-cm rows and 94% in 76-cm rows, averaged over different PRE fb POST or POST-alone programs.
Palmer amaranth control for all locations benefited from the addition of a POST herbicide and from grain sorghum population density ≥297,000 plants ha−1. Palmer amaranth response to row spacing was variable across rating dates and years. In 2012, increased Palmer amaranth control was observed when grain sorghum was planted in wider rows, however, in 2013 greater control was often observed in the 19-cm row spacing.
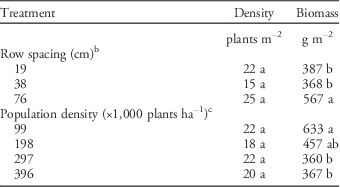
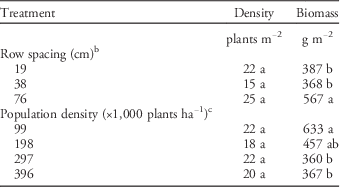
Under weedy conditions, Palmer amaranth density and biomass data were pooled over location and year because of the lack of interactions between location, year, row spacing, and grain sorghum population density. No differences in response to row spacing or grain sorghum population density were observed in Palmer amaranth density in nontreated plots (Table 4). Palmer amaranth dry biomass was reduced by 190 g m−2 on average for the 19- and 38-cm row widths compared to the 76-cm width. Hock et al. (Reference Hock, Knezevic, Martin and Lindquist2006) reported comparable reduction of common sunflower (Helianthus annuus L.) dry biomass (27%) in soybean with 275 grams per plant in 19-cm rows versus 375 grams per plant in 76-cm rows. Increasing grain sorghum population density from 99,000 to 297,000 plants ha−1 reduced Palmer amaranth dry biomass by 270 g m−2, whereas increasing density beyond 297,000 grain sorghum plants ha−1 did not provide further weed biomass reduction. Similarly, Harder et al. (Reference Harder, Sprague and Renner2007) and Schultz et al. (Reference Schultz, Myers and Bradley2015) did not observe any difference in weed density for soybean population density ranging from 124,000 to 445,000 plants ha−1. However, Harder et al. (Reference Harder, Sprague and Renner2007) reported a 27% decline in cumulative weed biomass averaged across 19-, 38- and 76-cm row spacing when soybean population density increased from 124,000 to 445,000 plants ha−1.
Effect of row width and grain sorghum population density on Palmer amaranth density and dry biomass in nontreated plots 14 weeks after planting in NC.Footnote a
a Means within a column and treatment followed by the same letters are not different according to Tukey’s HSD test at P≤0.05.
b Data pooled over grain sorghum population density.
c Data pooled over row spacing.
Grain Sorghum Canopy Closure
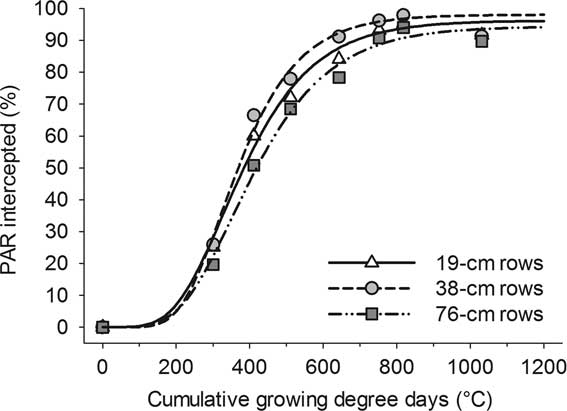
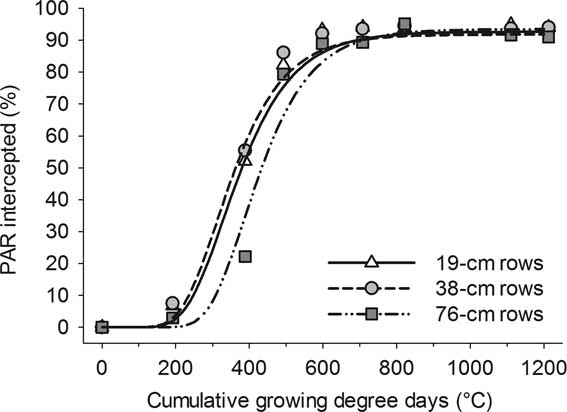
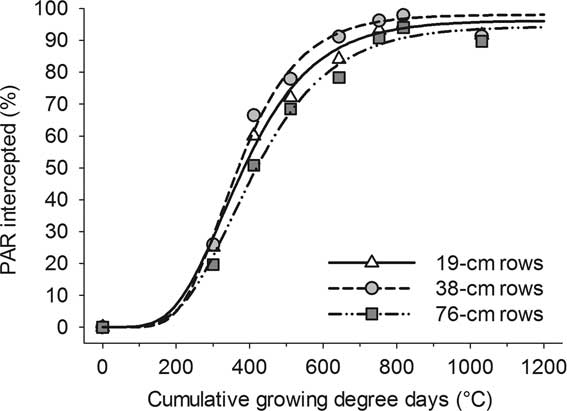
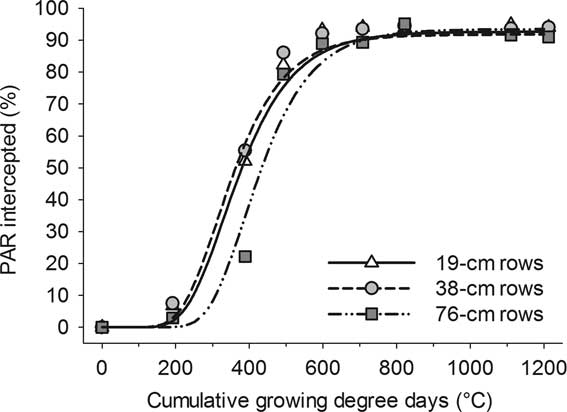
Differences (P≤0.05) were noted among parameter estimates for row width and grain sorghum population density; therefore, curves representing the progression of light interception by crop canopy as a function of CGDD are presented for each row spacing and population density within each location and year. Row width did not influence intercepted PAR at Whiteville in 2012, no difference being noted between row spacings for the light interception asymptote, initiation time, or rate at which the canopy was closing (data not shown). At Rocky Mount, the k parameter estimate, which reflects the rate at which the canopy closes, was lower (P≤0.05) for 76-cm rows compared to 38-cm rows in 2012 (Figure 1), whereas differences were observed for the time at which canopy closure was initiated between 19- or 38-cm and 76-cm row spacings (P≤0.01), with canopy closure starting 100 CGDD later in the widest rows in 2013 (Figure 2). The canopy closure lag for 76-cm rows might explain why Palmer amaranth control in 2013, and in the absence of POST application, was not complete 7 and 10 WAP in the 76-cm rows compared to the 19- and 38-cm rows for grain sorghum population density exceeding 198,000 plants ha−1. On the other hand, canopy closure was initiated at the same time for different row widths at Whiteville and Rocky Mount in 2012. Differences in the amount of PAR intercepted were observed late in the season and did not result in differences among row spacings in amaranth control. Other authors also reported no or limited row spacing effect on canopy closure, the difference in photosynthetic active radiation intercepted not exceeding 10% between 38-, 56-, and 76-cm row widths (Norsworthy and Oliveira Reference Norsworthy and Oliveira2004; Tharp and Kells Reference Tharp and Kells2001; Westgate et al. Reference Westgate, Forcella, Reicosky and Somsen1997).
Effect of row width on photosynthetic active radiation (PAR) interception by crop canopy, averaged over grain sorghum population density, at Rocky Mount, NC, in 2012. The nonlinear regression model used to predict light interception by grain sorghum was Y=a*exp(−b*exp(−kT)), where T is the cumulative growing degree days after grain sorghum emergence. Equation parameters a, b, k, and adjusted R² for each row width were as follows: 19-cm row width, 96.4, 10.9, 0.0074, 0.99; 38-cm row width, 99.8, 15.1, 0.0085, 0.98; and 76-cm row width, 95.5, 10.5, 0.0068, 0.97, respectively.
Effect of row width on photosynthetic active radiation (PAR) interception by crop canopy, averaged over grain sorghum population density, at Rocky Mount, NC, in 2013. The nonlinear regression model used to predict light interception by grain sorghum was Y=a*exp(−b*exp(−kT)), where T is the cumulative growing degree days after grain sorghum emergence. Equation parameters a, b, k, and adjusted R² for each row width were as follows: 19 cm row width, 96.5, 19.9, 0.0092, 0.99; 38 cm row width, 95.6, 15.3, 0.0090, 0.96; and 76 cm row width, 93.1, 60.9, 0.0106, 0.95, respectively.
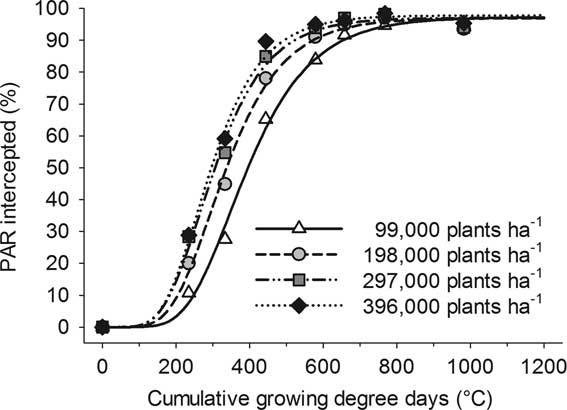
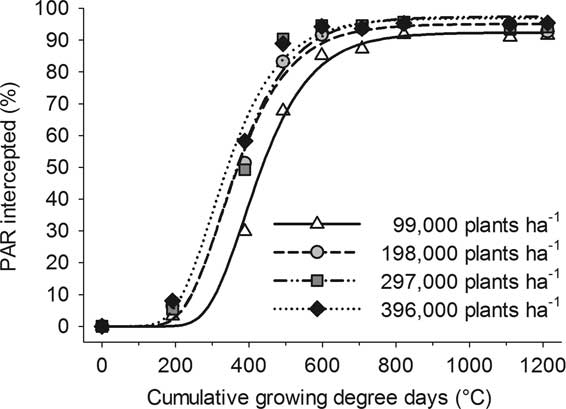
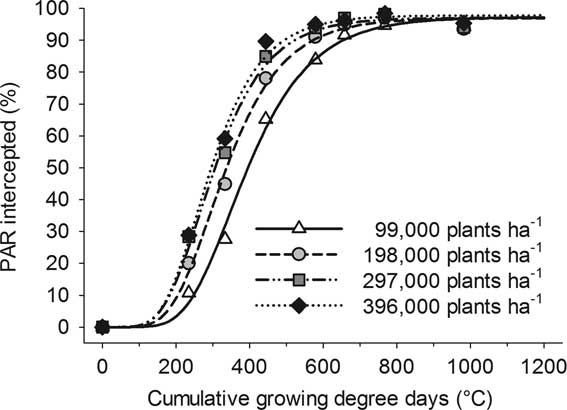
Grain sorghum population density played a more important role in the progression of canopy closure. The k parameter estimate was lower (P≤0.01) for the 99,000 plants ha−1 compared to the ≥297,000 plants ha−1 grain sorghum population density at Whiteville (Figure 3) and Rocky Mount (data not shown) in 2012, reflecting a slower rate of canopy closure for the lowest grain sorghum population density. Differences (P≤0.01) in the light interception asymptote or canopy closure initiation time were noted at Rocky Mount in 2013 (Figure 4) where canopy closure never exceeded 93% for 99,000 plants ha−1 but surpassed 97% for ≥297,000 plants ha−1 grain sorghum population density. Because of the slower rate of canopy closure or lag in time at which closure is initiated, lower Palmer amaranth control tended to be observed at the lowest grain sorghum population density compared to ≥297,000 plants ha−1 at 7 and 10 WAP and in the absence of POST application. The importance of rapid canopy closure is also expressed by the strong reduction in Palmer amaranth biomass observed for ≥297,000 plants ha−1 grain sorghum population density compared to 99,000 plants ha−1.
Effect of grain sorghum population density on photosynthetic active radiation (PAR) interception by crop canopy, averaged over row spacing, at Whiteville, NC, in 2012. The nonlinear regression model used to predict light interception by grain sorghum was Y=a*exp(−b*exp(−kT)), where T is the cumulative growing degree days after grain sorghum emergence. Equation parameters a, b, k, and adjusted R² for each sorghum population density were as follows: 99,000 plants ha−1, 97.1, 17.3, 0.0082, 0.99; 198,000 plants ha−1, 96.4, 15.2, 0.0093, 0.98; 297,000 plants ha−1, 96.4, 14.4, 0.0101, 0.98; and 396,000 plants ha−1, 96.9, 15.1, 0.0106, 0.97, respectively.
Effect of grain sorghum population density on photosynthetic active radiation (PAR) interception by crop canopy, averaged over row spacing, at Rocky Mount, NC, in 2013. The nonlinear regression model used to predict light interception by grain sorghum was Y=a*exp(−b*exp(−kT)), where T is the cumulative growing degree days after grain sorghum emergence. Equation parameters a, b, k, and adjusted R² for each sorghum population density were as follows: 99,000 plants ha−1, 91.2, 50.4, 0.0101, 0.99; 198,000 plants ha−1, 94.5, 25.3, 0.0099, 0.98; 297,000 plants ha−1, 96.4, 26.1, 0.0100, 0.96; and 396,000 plants ha−1, 96.7, 20.3, 0.0100, 0.95, respectively.
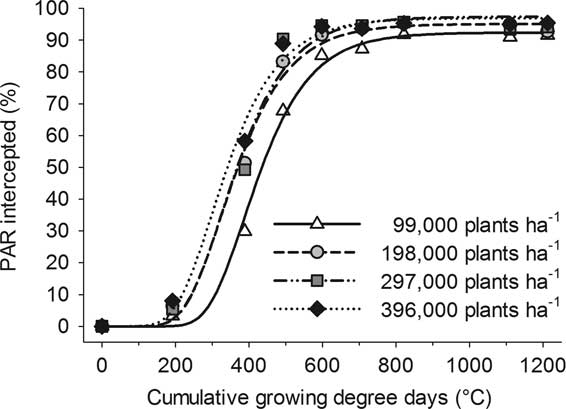
Averaged over row spacings and locations, 90% canopy closure occurred at 750, 620, 590, and 580 CGDD for grain sorghum population density equal to 99,000; 198,000; 297,000; and 396,000 plants ha−1, respectively. This would correspond to a time of canopy closure reduced by 12 d on average for grain sorghum population density ≥297,000 plants ha−1 compared to 99,000 plants ha−1. Previous researchers have also reported increased light interception or earlier canopy closure when corn population density was increased (Teasdale Reference Teasdale1995; Tollenaar et al. Reference Tollenaar, Dibo, Aguilara, Weise and Swanton1994; Westgate et al. Reference Westgate, Forcella, Reicosky and Somsen1997). Shading occurring more rapidly in grain sorghum population density ≥297,000 plants ha−1 may decrease weed emergence and growth as shown by Teasdale (Reference Teasdale1995), who observed greater weed coverage in 76-cm rows and 1× corn population density than in 38 cm rows and 2× corn population density.
Grain Sorghum Development at Boot Stage
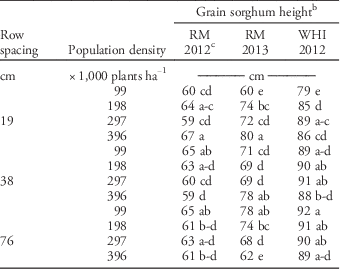
Grain sorghum height at boot stage was affected by an interaction between row spacing and grain sorghum population density. Year was also significant; therefore, interaction results were analyzed by year (Table 5). At the 19-cm row spacing, increasing grain sorghum population density from 99,000 to 396,000 plants ha−1 resulted in taller plants by 7 cm at Rocky Mount and Whiteville in 2012, and by 20 cm at Rocky Mount in 2013. No consistent trend was observed for 38-cm rows, whereas similar increases of the crop density decreased plant height by 4 and 16 cm in 76-cm rows at Rocky Mount in 2012 and 2013, respectively. Within grain sorghum population density, the effect of row width was only observed at 99,000 plants ha−1 with 5 to 18 cm taller plants when row spacing increased from 19 to 76 cm.
Effect of row spacing and grain sorghum population density on grain sorghum height at boot stage for three locations in NC.Footnote a
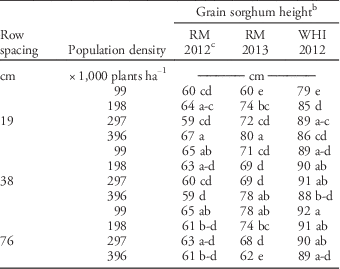
a Data pooled over herbicide strategies.
b Means within a column followed by the same letters are not different according to Tukey’s honest significant difference test at P≤0.05.
c Abbreviations: RM, Rocky Mount; WHI, Whiteville.
In 2012, at Rocky Mount, differences in the estimated flag leaf area were noted between grain sorghum population densities, with 19% diminution of the leaf area when grain sorghum population density increased from 99,000 to 198,000 plants ha−1, 10% reduction when the population density increased from 198,000 to 297,000 plants ha−1, and another 10% decrease when the population density increased from 297,000 to 396,000 plants ha−1. Similar observations relative to the leaf structure and area have been reported by Fischer and Wilson (Reference Fischer and Wilson1975), as well as by Bayu et al. (Reference Bayu, Rethman and Hammes2005), who characterized leaves in high density grain sorghum (>200,000 plants ha−1) as being narrower and less droopy than those in lower crop densities. Such features of the canopy have been reported to be more favorable to light interception per unit leaf area (Fischer and Wilson Reference Fischer and Wilson1975; Loomis and Williams Reference Loomis and Williams1969). Greater light interception, combined with rapid canopy closure as demonstrated by light interception measurements, contributes to earlier shading of the soil surface and may explain higher and longer weed control observed for grain sorghum population density ≥297,000 plants ha−1.
Grain Yield
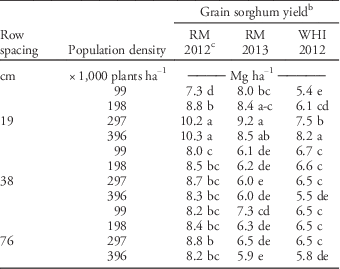
Grain sorghum yield was influenced by location and year, and by an interaction between row spacing and sorghum population density within each location (P≤0.05). Thus, the two-way interaction is presented within each location and year (Table 6). Grain sorghum population density ≥297,000 plants ha−1 planted in 19-cm rows increased yield on average by 1.8 Mg ha−1 at Rocky Mount, and by 2.8 Mg ha−1 at Whiteville in 2012 and Rocky Mount in 2013 when compared to similar grain sorghum population densities at 38- or 76-cm row width. Within 38- or 76-cm rows, increasing grain sorghum population density did not result in increased yield at Rocky Mount in 2012 and 2013, whereas in Whiteville, grain sorghum population density ≥397,000 plants ha−1 yielded less than any other lower crop densities. Similar yield response to row spacing has been observed in Kansas (Staggenborg et al. Reference Staggenborg, Fjell, Devlin, Gordon and Marsh1999), Texas (Fromme et al. Reference Fromme, Fernandez, Grichar and Jahn2012; Jones and Johnson Reference Jones and Johnson1991), and Alabama (Bishnoi et al. Reference Bishnoi, Mays and Fabasso1990). Staggenborg et al. (Reference Staggenborg, Fjell, Devlin, Gordon and Marsh1999) reported an average gain of 1.1 Mg ha−1 with 25-cm grain sorghum rows compared to 76-cm rows in environments with grain yield above 6.3 Mg ha−1. No yield response to row width was noted below this threshold, corresponding to below-average rainfall during the growing season. These authors suggested that lack of yield response in narrow rows might be due to a longer period of water stress caused by increased water consumption resulting from greater light interception. This is especially critical two months after planting, when reproductive structures of the panicles are formed and the number of seeds per panicle is determined (Fromme et al. Reference Fromme, Fernandez, Grichar and Jahn2012). In North Carolina, rainfall in July and August were above average in 2012 and 2013; thus, grain sorghum did not suffer from water stress and yield potential was not restricted in narrow rows.
Effect of row spacing and grain sorghum population density on grain sorghum yield for three locations in NC.Footnote a

a Data pooled over PRE and PRE fb POST herbicide strategies.
b Means within a column followed by the same letters are not different according to Tukey’s HSD test at P≤0.05.
c Abbreviation: RM, Rocky Mount; WHI, Whiteville.
Consistent yield response to grain sorghum population density was only noted at the 19-cm row spacing, where increasing population density from 99,000 to ≥297,000 plants ha−1 resulted in yield increase of 3 and 2.5 Mg ha−1 at Rocky Mount and Whiteville, respectively, in 2012, but only an increase of 0.9 mg ha−1 at Rocky Mount in 2013 (Table 5). Staggenborg (Reference Staggenborg, Fjell, Devlin, Gordon and Marsh1999) and Conley et al. (Reference Conley, Stevens and Dunn2005) reported up to 0.5 Mg ha−1 yield gain when grain sorghum population density increased from 74,000 to 148,000 plants ha−1, but no further increase with 222,000 plants ha−1.
Grain yield of the plots that received no herbicides was lower by 1.8 Mg ha−1 compared to PRE alone or PRE fb POST application (data not shown). Lack of herbicide treatment resulted in 336% yield reduction at Whiteville in 2012 where Palmer amaranth density and dry biomass averaged over row spacings and plant population density reached 41 plants m−2 and 948 g m−2, respectively, at the end of the growing season in nontreated plots. At Rocky Mount, only 9 plants m−2, accumulating 768 g m−2 of dry biomass, were noted in 2012. In 2013, a higher density of 51 plants m−2 was reported, but a total dry biomass of only 115 g m−2, indicating that an emergence of Palmer amaranth occurred late in the season. Lower Palmer amaranth pressure at Rocky Mount resulted in 22% and 15% yield reduction in 2012 and 2013, respectively, in the absence of herbicide application.
This research suggests that adjustments in row spacing and crop population density can be effective components of a Palmer amaranth management program in grain sorghum. Results indicate that grain sorghum population densities exceeding 198,000 plants ha−1 combined with herbicide applications improved Palmer amaranth control. Narrower rows and increased grain sorghum population density had no effect on Palmer amaranth density in the absence of herbicide application, but strongly reduced Palmer amaranth biomass. Light interception analysis revealed that canopy closure occurred earlier in moderate and high population densities compared to low population densities. Planting grain sorghum at a density greater than 198,000 plants ha−1 may be beneficial for reducing weed seed production from Palmer amaranth and may limit the risk of herbicide resistance development and spread. However, grain yield response was more consistently affected by row spacing than by plant population density, with the highest yields being achieved at the narrowest row spacing. These results are consistent with previous reports investigating the row spacing effect in grain sorghum (Fromme et al. Reference Fromme, Fernandez, Grichar and Jahn2012; Jones and Johnson Reference Jones and Johnson1991; Staggenborg et al. Reference Staggenborg, Fjell, Devlin, Gordon and Marsh1999). The results reported by Andrade et al. (Reference Andrade, Calviño, Cirilo and Barbieri2002) demonstrated that corn yield increase in response to narrow row spacing was a direct consequence of improved light interception during the critical period for kernel set. This stresses the need for limiting weed competition through high plant population density associated with PRE herbicide application at this critical period to enable maximal light interception in narrow rows.