1. Introduction
Stable carbon isotopes (δ13C) have been widely used to investigate changes in the global carbon cycle and the burial of organic carbon in the geologic past (Kaufman & Knoll, Reference Kaufman and Knoll1995; Kump & Arthur, Reference Kump and Arthur1999; Corsetti & Kaufman, Reference Corsetti and Kaufman2003; Halverson et al. Reference Halverson, Hoffman, Schrag, Maloof and Rice2005; Edwards & Saltzman, Reference Edwards and Saltzman2014). Since it has been argued that some phases of marine carbonate material are likely to record similar values to seawater δ13C (Saltzman, Reference Saltzman2005; Ainsaar et al. Reference Ainsaar, Kaljo, Martma, Meidla, Männik, Nõlvak and Tinn2010; Munnecke et al. Reference Munnecke, Zhang, Liu and Cheng2011), stable carbon isotopes (δ13C) can be used as an index of fluctuations in environmental conditions and are widely used in carbonate stratigraphic correlations and climate change research around the world (Ainsaar et al. Reference Ainsaar, Kaljo, Martma, Meidla, Männik, Nõlvak and Tinn2010; Zhang et al. Reference Zhang, Cheng, Munnecke and Zhou2010; Metzger et al. Reference Metzger, Fike and Smith2014). In addition, numerous studies have focused on positive carbon isotope excursions in Lower Palaeozoic strata and their utility in performing global correlations (Sial et al. Reference Sial, Peralta, Ferreira, Toselli, Aceñolaza, Parada, Gaucher, Alonso and Pimentel2008, Reference Sial, Peralta, Gaucher, Toselli, Ferreira, Frei, Parada, Pimentel and Pereira2013; Cramer et al. Reference Cramer, Brett, Melchin, Männik, Kleffner, McLaughlin, Loydell, Munnecke, Jeppsson, Corradini, Brunton and Saltzman2011; Munnecke et al. Reference Munnecke, Zhang, Liu and Cheng2011; Bergström et al. Reference Bergström, Lehnert, Calner and Joachimski2012; Calner et al. Reference Calner, Lehnert and Jeppsson2012; Albanesi et al. Reference Albanesi, Bergström, Schmitz, Serra, Feltes, Voldman and Ortega2013; Edwards & Saltzman, Reference Edwards and Saltzman2014). For example, the Middle Ordovician (Darriwilian) positive δ13C excursion (MDICE, Dw2/3), the Guttenberg Isotopic Carbon Excursion (GICE, Ka1) and the Hirnantian isotope carbon excursion (HICE, Hi1) are documented in the Middle–Late Ordovician Period (Bergstrom et al. 2009; Liu et al. Reference Liu, Li, Liu, Luo, Shao, Luo and Zhang2016a; Zhang & Munnecke, Reference Zhang and Munnecke2016). Several problems still exist with regard to oil and gas exploration in the Lower–Middle Ordovician strata of the Tarim Basin, NW China. First, carbon isotope research lacks the age control constrained by conodont biostratigraphy. In the Tarim Basin, both types of North Atlantic Province and North American Midcontinent Province conodonts coexisted in the Ordovician Period (Pei, Reference Pei2000; Wang et al. Reference Wang, Qi and Bergström2007; Jing, Reference Jing2009). The complexity of conodonts increases the difficulty of comparing with adjacent areas. Second, disconformities are not easy to identify in stable carbonate platforms at the outcrop, and carbon isotope stratigraphy is an auxiliary method. Third, carbon isotope correlations between the Tarim Basin and other locations need to be analysed. In addition, the Lower–Middle Ordovician rocks of the Tarim Basin have attracted much attention as they host a major part of China’s oil and gas reservoirs (Zhang & Munnecke, Reference Zhang and Munnecke2016).
When working with shallow water carbonate platforms, analysis of carbon isotopic data might produce misleading results without biostratigraphic control (Zhang & Munnecke, Reference Zhang and Munnecke2016). Therefore, in this study, we use the distribution of conodonts and the location of unconformities as controls on the carbon isotope stratigraphic framework. The purposes of this study are as follows: (1) to obtain new sedimentological and isotopic data from multiple sections and wells in the Lower–Middle Ordovician platform of the Tarim Basin; (2) to establish a carbon isotope curve with conodont biostratigraphy as a control, which can be used to constrain geochemical stratigraphic correlations; and (3) to compare δ13C to several other time-equivalent sections deposited in southern China (Munnecke et al. Reference Munnecke, Calner, Harper and Servais2010), the Great Basin, USA (Edwards & Saltzman, Reference Edwards and Saltzman2014), and the Argentine Precordillera (Buggisch et al. Reference Buggisch, Keller and Lehnert2003; Sial et al. Reference Sial, Peralta, Ferreira, Toselli, Aceñolaza, Parada, Gaucher, Alonso and Pimentel2008, Reference Sial, Peralta, Gaucher, Toselli, Ferreira, Frei, Parada, Pimentel and Pereira2013; Albanesi et al. Reference Albanesi, Bergström, Schmitz, Serra, Feltes, Voldman and Ortega2013), and Tingskullen, Sweden (Wu et al. Reference Wu, Mikael and Oliver2016).
2. Geologic setting and biostratigraphy
2.a. Depositional environments
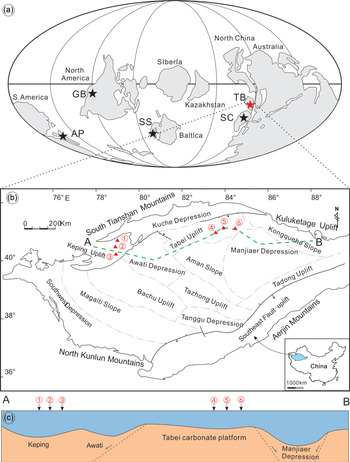
The Tarim Basin is located in northwestern China and has an area of 56 × 104 km2. The Tarim landmass was located near the equator during the Early–Middle Ordovician Period (Torsvik & Cocks, Reference Torsvik and Cocks2013; Wang et al. Reference Wang, Li, Yang and Li2013a), near the NW margin of Gondwana (Fig. 1). During the Early–Middle Ordovician, deep-water basin facies were deposited in the eastern Tarim Basin, whereas a large shallow-water carbonate platform existed in the western Tarim Basin (Zhang et al. Reference Zhang, Wang, Jin, Zhang, Wang and Bian2006; Wu et al. Reference Wu, Shou, Zhang and Pan2012). The Keping area, where the outcrops are well exposed, is located in the NW Tarim Basin (Fig. 1). This area is favourable for the detailed investigation of the Lower to Middle Ordovician strata. The geology of this area is also comparable to other regions in the Tarim Basin, and thus it can be used as a proxy for these regions (C Zhang et al. Reference Zhang, Zheng and Li2001; SB Zhang et al. Reference Zhang, Ni and Gong2003). The Keping area is suitable for studying the sedimentary setting, reservoir and hydrocarbon source rocks, as well as oil and gas accumulation conditions (Lv et al. Reference Lv, Bai, Xie and Yang2014).
Geographic positions of the studied sections and wells in the Tarim Basin. (a) Palaeogeographic reconstruction of the Middle Ordovician (470 Ma) world showing the approximate positions of the Tarim Basin (TB), South China (SC), the Great Basin (GB), the Argentine Precordillera (AP) and southern Sweden (SS) (Scotese & McKerrow, Reference Scotese, McKerrow, Barnes and Williams1991; Calner et al. Reference Calner, Lehnert, Wu, Dahlqvist and Joachimski2014; Edwards & Saltzman, Reference Edwards and Saltzman2014). (b) Structure diagram of the Tarim Basin. 1: Keping–Shuinichang section. 2: Yingshanbeipo section. 3: Dabantage section. 4: Ts2 well. 5: S88 well. 6: Ts1 well. (c) A–B profile in the Tarim Basin (modified from Zhang & Munnecke, Reference Zhang and Munnecke2016), showing the position of the outcrop and wells.

From bottom to top, the Lower to Middle Ordovician comprises the Penglaiba Formation (O1p, predominantly dolostone), the Yingshan Formation (O1-2ys, limestone with dolomite interbeds) and the Yijianfang Formation (O2yj, predominantly bioclastic limestone) (Chen et al. Reference Chen, Zhao and Li2012; Tian et al. Reference Tian, Jin, Lu, Lei, Zhang, Zheng, Zhang, Rong and Liu2016). Liu et al. (Reference Liu, Li, Zhang and Li2002) subdivided the Yingshan Formation into a lower and an upper unit based on lithology and palaeontology. The lower unit mainly consists of light grey or pale yellow micrite, calcarenite and dolostone. The upper unit is mainly composed of grey and yellow–grey skeletal packstone interbedded with lime mudstone. Fossils are common in the Yijianfang Formation, and reefs are present locally. The Tahe Oilfield is located on the southern slope of the Tabei Uplift, which lies to the west of the Manjiaer Depression, to the east of the Halahatang Depression and to the north of the low uplift of the Aman slope (Fig. 1). The thickness of the Yingshan Formation is 855–925 m in wells Ts1, Ts2 and S88 in the Tahe Oilfield.
2.b. Conodont biostratigraphy
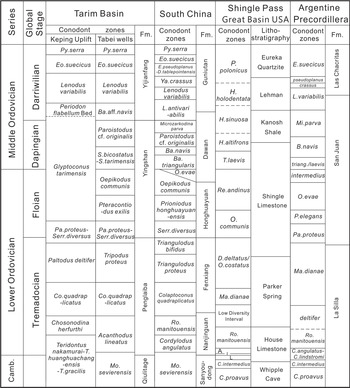
Along with graptolites, conodonts are considered to be the most useful index fossils regionally and locally in the Ordovician Period (Bergström & Ferretti, Reference Bergström and Ferretti2016). Ordovician conodont faunas can be divided into two biogeographic provinces: North Atlantic Province and North American Midcontinent Province (Sweet & Bergström, Reference Sweet and Bergström1974). Both types of conodonts coexisted during the Ordovician in the Tarim Basin (Pei, Reference Pei2000; Wang et al. Reference Wang, Qi and Bergström2007; Jing, Reference Jing2009). Many scholars have investigated the Ordovician conodont biostratigraphy of the Tarim Basin (Xiong et al. Reference Xiong, Wu and Ye2006; Zhao et al. Reference Zhao, Zhao and Huang2006; Wang et al. Reference Wang, Qi and Bergström2007, Reference Wang, Li and Wang2009, Reference Wang, Wu and Bergström2013b; Jing et al. Reference Jing, Deng, Zhao, Lu and Zhang2008; Li et al. Reference Li, Huang, Wang, Wang, Xue, Zhang, Zhang, Fan and Zhang2009; Zhen et al. Reference Zhen, Percival, Liu and Zhang2009, Reference Zhen, Wang, Zhang, Bergström, Percival and Cheng2011, Reference Zhen, Percival and Zhang2015). Different scholars have also established slightly different conodonts zones in the Tarim Basin. In order to facilitate comparison, this paper mainly uses the conodonts data from the Keping area and North Tarim area. Conodont data in the Tabei wells (S88, Ts3, Yq6, S110 and S106) are from Xiong et al. (Reference Xiong, Tao and Wang2015), and the unpublished report from the Exploration & Production Research Institute of SINOPEC Northwest Oilfield Company. Conodont data in the Yingshanbeipo and Shuinichang sections are from Deng et al. (Reference Deng, Huang, Jing, Du, Lu and Zhang2008), Jing et al. (Reference Jing, Deng, Zhao, Lu and Zhang2008) and Jing (Reference Jing2009). Conodont data in the Dabantage section are from Xiong et al. (Reference Xiong, Wu and Ye2006), Li et al. (Reference Li, Huang, Wang, Wang, Xue, Zhang, Zhang, Fan and Zhang2009) and Zhang & Munnecke (Reference Zhang and Munnecke2016). The Lower to Middle Ordovician conodonts can be grouped into 12 zones in accordance with the standard Ordovician graptolite scheme (Xiong et al. Reference Xiong, Wu and Ye2006), and thus strata with similar biostratigraphy can be compared with strata in other regions around the world (Fig. 2).
Biostratigraphic and lithostratigraphic correlations of conodont zones and formations from the Tarim Basin, South China, Shingle Pass (Nevada, USA) and the Argentine Precordillera. Conodont zone abbreviations: A = C. angulatus; C = Cordylodus; Co= Colaptoconus; I = Iapetognathus; L = C. lindstromi; Ma.= Macerodus; Mo. = Monocostodus; Mi. = Microzarkodina; Ro. = Rossodus; Re. = Reutterodus; Serr. = Serratognathus; Pa. = Paroistodus; Ba. = Baltoniodus; E. = Eoplacognathus; Py. = Pygodus; aff.= affinis. Camb. = Cambrian. Conodont zones are based on occurrence data from Lehnert (Reference Lehnert1995 a, b), Albanesi et al. (Reference Albanesi, Hünicken and Barnes1998, Reference Albanesi, Bergström, Schmitz, Serra, Feltes, Voldman and Ortega2013), Keller (Reference Keller1999), Xiong et al. (Reference Xiong, Wu and Ye2006, Reference Xiong, Tao and Wang2015), Zhen (Reference Zhen2007), Jing et al. (Reference Jing, Deng, Zhao, Lu and Zhang2008), Jing (Reference Jing2009), Li et al. (Reference Li, Huang, Wang, Wang, Xue, Zhang, Zhang, Fan and Zhang2009), Zhen et al. (Reference Zhen, Percival, Liu and Zhang2009), Munnecke et al. (Reference Munnecke, Zhang, Liu and Cheng2011), Zhen et al. (Reference Zhen, Percival and Zhang2015), Albanesi & Ortega (Reference Albanesi, Ortega and Montenari2016), Zhang & Munnecke (Reference Zhang and Munnecke2016), Bergström et al. (Reference Bergström, Kleffner and Eriksson2019) and Wang et al. (Reference Wang, Zhen, Bergström, Wu, Zhang and Ma2019). Lithostratigraphy is from Buggisch et al. (Reference Buggisch, Keller and Lehnert2003) and Edwards & Saltzman (Reference Edwards and Saltzman2014).

2.b.1. Yingshanbeipo section
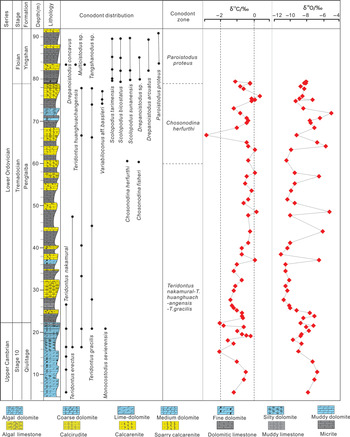
Two conodont zones or faunas were found in the Penglaiba Formation of the Yingshanbeipo section, including the Teridontus nakamurai – Teridontus huanghuachangensis – Teridontus gracilis fauna and the Chosonodina herfurthi – Chosonodina fisheri Zone. The conodonts Scolopodus tarimensis (Zhou, Reference Zhou2001), Scolopodus bicostatus, Scolopodus sunanensis, Drepanoistodus sp., Drepanoistodus arcuatus, Drepanoistodus concavus, P. proteus, Multioistodus sp. and Tangshanodus sp. can be found in the Lower Yingshan Formation. The occurrences and ranges of conodont species indicate a significant disconformity between the Penglaiba and Yingshan formations in the Yingshanbeipo section. V. aff. bassleri and Chosonodina herfurthi were used to indicate the base of the Ordovician (Zhao et al. Reference Zhao, Zhang and Xiao2000), suggesting that the exposed Penglaiba Formation here represents only the basal part of the Tremadocian. The P. proteus CZ indicates an early Floian age. The Colaptoconus quadraplicatus Zone and Paltodus deltifer Zone are absent from the unconformity between the Penglaiba and Yingshan formations in the Yingshanbeipo section. This stratigraphical gap is c. 7.2 Ma (Deng et al. Reference Deng, Huang, Jing, Du, Lu and Zhang2008).
2.b.2. Tabei wells (S88, Ad11, Ts3, Yq6, S110 and S106)
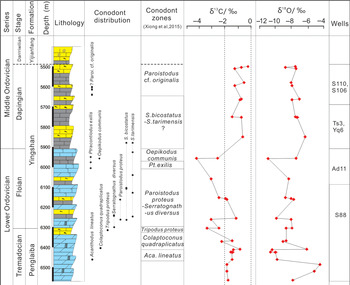
The Lower Ordovician Upper Penglaiba Formation consists of fine-grained dolomite and calcareous dolomite. These strata contain the conodonts Acanthodus lineatus, Drepanoistodus sp., Paroistodus numarcuatus, Scolopodus primitivus, Colaptoconus quadraplicatus, Scandodus cf. changoukouensis, Scolopodus cf. apterus, Scolopodus restrictus and Teridontus gracilis. The Lower Ordovician – Lower Yingshan Formation is c. 430 m thick and is composed mainly of calcarenite and fine-grained dolomite. These strata contain the conodonts Acodus dabanensis, Juanognathus sp., Oistodus sp., Drepanoistodus forceps, D. basiovalis (Sergeeva, Reference Sergeeva1963), S. sunanensis, Scolopodus filiformis, Scolopdus cf. sunanensis, S. bicostatus, Serratognathus diversus, Staufferella sp., Tripodus proteus, Paroistodus cf. parallelus, Drepanodus sp., Paroistodus proteus and Paroistodus sp. The Middle Ordovician Upper Yingshan Formation is c. 400 m thick and is composed mainly of calcarenite and micrite. These strata contain the conodonts Acodus sp., Oepikodus communis and Scolopodus tarimensis (Zhou, Reference Zhou2001).
2.b.3. Shuinichang and Dabantage sections
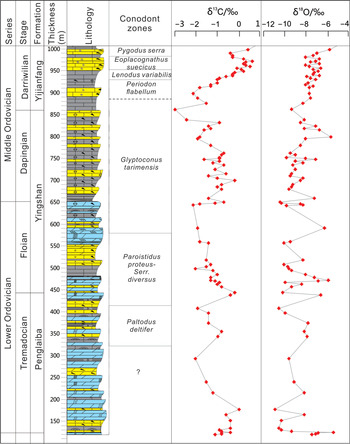
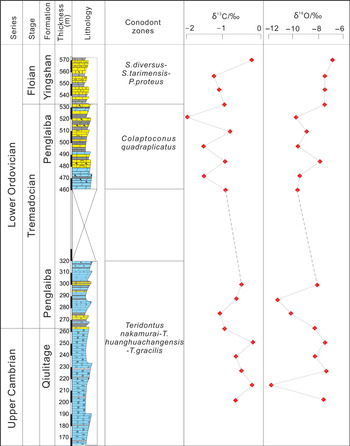
In the Shuinichang section, conodont biozones of Teridontus nakamurai – Teridontus huanghuachangensis – Teridontus gracilis fauna occur across the Cambrian–Ordovician boundary. Around the Tremadocian and Floian boundary, conodont biozones of S. diversus, S. tarimensis and P. proteus are present above the conodont biozone of Colaptoconus quadraplicatus (Deng et al. Reference Deng, Huang, Jing, Du, Lu and Zhang2008; Jing, Reference Jing2009). The lack of the Paltodus deltifer zone shows the unconformity between Penglaiba and Yingshan formations in the Shuinichang section (Deng et al. Reference Deng, Huang, Jing, Du, Lu and Zhang2008). Conodont biozones of Paltodus deltifer, Serratognathus diversus – Paroistodus proteus, Glyptoconus tarimensis, Periodon flabellum, Lenodus variabilis, Eoplacognathus suecicus and Pygodus serra are recognized upward in Lower–Middle Ordovician strata in the Dabantage section (Xiong et al. Reference Xiong, Wu and Ye2006; Li et al. Reference Li, Huang, Wang, Wang, Xue, Zhang, Zhang, Fan and Zhang2009; Zhang & Munnecke, Reference Zhang and Munnecke2016).
3. Samples and methods
3.a. Samples
To reduce the diagenetic influence on the original stable isotope composition, all samples were collected as far as possible from areas of strong weathering and calcite veining. Samples were collected from the Lower to Middle Ordovician portions of the Yingshanbeipo, Dabantage and Shuinichang sections and the Tabei wells (Fig. 1). The Lower Ordovician Penglaiba Formation has a well-exposed outcrop and obvious bottom and top boundaries in the Yingshanbeipo section. We collected 57 samples from the Yingshanbeipo section with a thickness of 82 m. In the Dabantage section, we collected 91 samples along an 880 m thick section. In addition, we collected 19 samples around the Cambrian and Ordovician boundary and the Tremadocian and Floian (O1p/O1-2y) boundary in the Shuinichang section. Finally, we collected 32 samples from the upper part of the Lower Ordovician Penglaiba Formation to the lower part of the Middle Ordovician Yijianfang Formation from wells S88, Ts3, Yq6, S110 and S106 in the Tahe oilfield.
3.b. Methods
3.b.1. Thin-sections
Thin-sections (30 μm thick) for a total of 150 samples were prepared and were examined using a transmission polarizing microscope (SYZX-CD-027/29/24).
3.b.2. Mn and Sr element analyses
Mn and Sr element analyses were carried out using an inductively coupled plasma mass spectrometer (ICP-MS, NexION300D) at the China National Nuclear Corporation Beijing Research Institute of Uranium Geology, following the methods of Qi et al. (Reference Qi, Hu and Gregoire2000). Element concentrations are expressed in parts per million (ppm), with a measurement precision better than 4 %.
3.b.3. Carbon and oxygen isotopes
After the samples were crushed to powder and dried, anhydrous phosphoric acid was added and the samples were allowed to react for more than 24 h at 25 °C under vacuum. After purification using liquid nitrogen, we collected the CO2 produced from the reaction and conducted isotopic analyses using a Finnigan-MAT 253 gas isotope mass spectrometer. Stable isotopic values are expressed in per-mil units relative to the Vienna Pee Dee Belemnite standard. The standard samples were GBW04405 and GBW04416 (Chen & Feng, Reference Chen and Feng2019). These standards have been measured and calibrated against the international standard NBS 019. The instrumental error for the δ13C and δ18O analyses was ±0.1 ‰ and ±0.2 ‰, respectively. The analytical errors for δ13C and δ18O are based on the mean squared error. Carbon and oxygen isotope analyses were performed at the Beijing Research Institute of Uranium Geology, following the geology and mineral resources industry standard of the People’s Republic of China DZ/T 0184.17-1997 (phosphate method of carbon and oxygen isotopic compositions of carbonate mineral or rock). Data for the carbon and oxygen isotopic analyses are presented in Tables 1–4.
Samples, description, and elemental and isotopic geochemical compositions of the investigated carbonates in the Yingshanbeipo section

Samples, description, and elemental and isotopic geochemical compositions of the investigated carbonates from the cores of Tabei wells

Samples, description and isotopic geochemical compositions of the investigated carbonates in the Dabantage section

Samples, description, and elemental and isotopic geochemical compositions of the investigated carbonates in the Shuinichang section

4. Results
4.a. Outcrop and thin-section analyses
Sedimentary contacts between the Cambrian and Ordovician, Tremadocian and Floian (O1P/O1-2y), Dapingian and Darriwilian (O1-2y/O2yj) and Middle and Upper Ordovician (O2yj/O3q) units have been observed at outcrop.
4.a.1. Shuinichang section
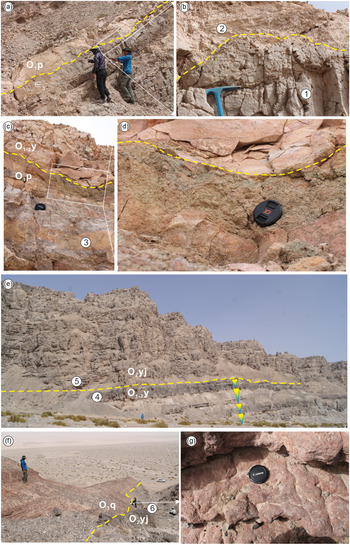
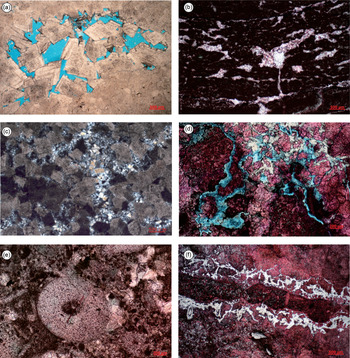
An unconformity exists between the Upper Cambrian Qiulitage Formation and the Lower Ordovician Penglaiba Formation. Solution pores and cavities formed along this unconformity (Fig. 3a, b). In thin-section, medium crystalline dolomite with intercrystalline solution pores is observed below the boundary (Fig. 4a), and grey algal limestone (5 m thick) is observed above the boundary (Figs 3a, 4b). In addition, there is a 20 cm thick weathered clay layer between the Penglaiba and Yingshan formations (Fig. 3c, d), which marks an interval of exposure and erosion. Lastly, a 1 m thick grey layer of fine- to medium-grained crystalline siliceous dolomite is present below the boundary (Fig. 4c). The unconformity between the Penglaiba and Yingshan formations is often terminated by siliceous nodules.
Outcrop photograph of the formation contacts in the Middle–Lower Ordovician, in the Shuinichang and Dabantage sections. (a–d) Shuinichang section. (e–g) Dabantage section. (g) Reddish-brown tumorous limestone. E3 = Upper Cambrian, O1p = Penglaiba Formation, O1-2y = Yingshan Formation, O2yj = Yijianfang Formation, O3q =Qiaerbake Formation; 1–6: position of the thin-sections in Figure 4.

Thin-section photographs of the carbonates near the formation contacts. (a) Coarse crystalline dolomite with intercrystalline solution pores. (b) Thrombolites; the white colour mineral filling with the porosity is calcite. (c) Finely medium crystalline siliceous dolomite. (d) Intergranular and intragranular dissolution pores exist in the calcarenite. (e) Bioclastic limestone. (f) Algal limestone. 1–6 in Figure 3 respectively represent sampling locations a–f.

4.a.2. Dabantage section
In the Penglaiba Formation, the lithology is dominated by dolomite with calcarenite interlayers, over a thickness of 15 m of light-grey medium-thick algal limestone in the lower part. Algal limestone and algal dolomite interbeds are mainly developed in the lower part of the Yingshan Formation, where the dolomite content is obviously reduced compared to that of the Penglaiba Formation, and interbedded algal limestone and calcarenite are mainly developed, with dolomite interbeds locally present in the upper part of the Yingshan Formation. Interbedded grey calcarenite and black micrite are present in the upper part of the Yingshan Formation (Fig. 3e). In thin-section, intergranular and intragranular dissolution pores are observed in the calcarenite (Fig. 4d). Bioclastic limestone (Fig. 4e) and local reefal limestone are observed in the lower part of the Yijianfang Formation. The boundary between the Middle and Lower Ordovician is clear, with an unconformity between the grey Yijianfang Formation and the purple Qiaerbake Formation (Fig. 3f, g). Algal limestone is also present at the top of the Yijianfang Formation (Fig. 4f).
4.a.3. Yingshanbeipo section
The Penglaiba Formation is c. 55 m thick, with an angular unconformity contact with both the underlying Cambrian and the overlying Yingshan Formation. Compared with the Shuinichang and Dabantage sections, the Penglaiba Formation in this section is thinner, and it is dominated by calcarenite and dolomitic limestone with an occasional dolomite interlayer (Fig. 5).
Lithology, conodont, and δ13C and δ18O data from the Yingshanbeipo section. Conodont data are from Deng et al. (Reference Deng, Huang, Jing, Du, Lu and Zhang2008), Jing et al. (Reference Jing, Deng, Zhao, Lu and Zhang2008) and Jing (Reference Jing2009).

4.b. Mn/Sr
Mn/Sr values range from 0.22 to 18.16, 0.07 to 3.50, and 0.14 to 12.05 in the Yingshanbeipo section, the Tabei wells and the Shuinichang section, respectively (Tables 1, 2, 4; Fig. 10 further below). The mean Mn/Sr values of the Yingshanbeipo carbonates (2.96, n = 55) and the Shuinichang carbonates (1.51, n = 19) are higher than those of the Tabei wells (0.32, n = 32).
4.c. Isotopic records
4.c.1. Yingshanbeipo section
We analysed 57 samples from the upper part of the Upper Cambrian strata to the Lower Ordovician Penglaiba Formation (Fig. 5). The δ13C values range from −2.9 ‰ to 0.4 ‰. In the Upper Cambrian, the δ13C values range from −2.1 ‰ to −0.1 ‰. The δ13C values are more positive in the overlying Penglaiba Formation compared to the Upper Cambrian. A negative shift in δ13C going up-section, from −0.5 ‰ to −2.1 ‰, occurs around the boundary between the Cambrian and Ordovician. In addition, a positive shift in δ18O, from −10.2 ‰ to −6.9 ‰, is observed at the base of the Ordovician strata (Tremadocian). The δ18O values range from −10.5 ‰ to −5.1 ‰ in the Yingshanbeipo section.
4.c.2. Tabei wells
We analysed 32 samples from the upper part of the Lower Ordovician Penglaiba Formation to the lower part of the Upper Ordovician (Sandbian) (Fig. 6). The δ13C values range from −4.2 ‰ to 0.2 ‰, and the δ13C values are more positive in the upper part of the Yingshan Formation, exhibiting a clear increase in δ13C (Fig. 6). A positive shift in δ13C, from −4.2 ‰ to −0.8 ‰, is observed in the middle of the Yingshan Formation. A negative shift in δ13C, from −0.9 ‰ to −3.4 ‰, is observed around the boundary between the Penglaiba and Yingshan formations. The δ18O values range from −10.6‰ to −4.3 ‰ in the Tabei wells.
Lithology, conodont, and δ13C and δ18O data from the Tabei region. Conodont data are from Xiong et al. (Reference Xiong, Wu and Ye2006, Reference Xiong, Tao and Wang2015) and the unpublished report from the Exploration & Production Research Institute of SINOPEC Northwest Oilfield Company (for legend see Fig. 5).

4.c.3. Dabantage section
We analysed 91 samples from the Lower Ordovician Penglaiba Formation to the Middle Ordovician Yijianfang Formation. δ13C values range from −4.2 ‰ to 0.6 ‰ in the Middle–Lower Ordovician, from −1.9 ‰ to 0.0 ‰ in the Penglaiba Formation, from −4.2 ‰ to −0.2 ‰ in the Yingshan Formation, and from −2.1 ‰ to 0.6 ‰ in the Yijianfang Formation (Fig. 7). The δ18O values range from −9.9 ‰ to −5.3 ‰ in the Dabantage section. A positive shift in δ13C, from −1.9 ‰ to −0.2 ‰ going up-section, is observed around the boundary between the Penglaiba and Yingshan formations. A positive shift in δ13C, from −2.1 ‰ to −0.7 ‰, occurs in the middle of the Yingshan Formation. A negative shift in δ13C, from −0.9 ‰ to −4.2 ‰ going up-section, occurs around the boundary between the Yingshan and Yijianfang formations.
Lithology and δ13C and δ18O data from the Dabantage section (for legend see Fig. 5). Conodont data are from Xiong et al. (Reference Xiong, Wu and Ye2006), Li et al. (Reference Li, Huang, Wang, Wang, Xue, Zhang, Zhang, Fan and Zhang2009) and Zhang & Munnecke (Reference Zhang and Munnecke2016).

4.c.4. Shuinichang section
We analysed 19 samples from the Cambrian–Ordovician and Tremadocian–Floian (O1p/O1-2y) boundaries. The δ13C values range from −0.5 ‰ to −1.1 ‰ around the Cambrian–Ordovician boundary. The δ13C values range from −1.4 ‰ to −0.5 ‰ around the Tremadocian–Floian (O1p/O1-2y) boundary (Fig. 8). The δ18O values range from −11.2 ‰ to −7.6 ‰ in the Shuinichang section.
Lithology and δ13C and δ18O data near the Cambrian and Ordovician and Tremadocian and Floian (O1p/O1-2y) boundaries in the Shuinichang section (for legend see Fig. 5). Conodont data are from Jing et al. (Reference Jing, Deng, Zhao, Lu and Zhang2008) and Jing (Reference Jing2009).

5. Discussion
5.a. Interpretation of diagenesis
During the diagenesis, carbon and oxygen isotopic compositions of marine carbonates can be altered by the exchange of C and O between the rock and the pore fluids (often meteoric water) (Brand & Veizer, Reference Brand and Veizer1980; Banner & Hanson, Reference Banner and Hanson1990). The diagenetic alteration mainly results in decreased Sr and δ18O values but increased Mn concentration (Azmy et al. Reference Azmy, Stouge, Christiansen, Harper, Knight and Boyce2010). There are several criteria used to evaluate the extent to which the rocks have been affected by diagenesis. (1) If δ18O < −10 ‰ in carbonate samples, then the original carbon isotopic composition may have been altered (Derry et al. Reference Derry, Kaufman and Jacobsen1992; Kaufman et al. Reference Kaufman, Jacobsen and Knoll1993; Buggisch et al. Reference Buggisch, Keller and Lehnert2003). (2) A positive correlation of carbon and oxygen isotopes on a plot of δ13C vs δ18O indicates the diagenetic alteration (Qing & Veizer, Reference Qing and Veizer1994). (3) Degree of preservation is more if Mn/Sr < 10 of marine carbonates (e.g. Kaufman & Knoll, Reference Kaufman and Knoll1995; Corsetti & Kaufman, Reference Corsetti and Kaufman2003; Azmy et al. Reference Azmy, Stouge, Christiansen, Harper, Knight and Boyce2010).
Microsamples were drilled from the finest-grained micritic material and were analysed for their elemental and isotopic compositions, particularly the Mn and Sr concentrations and O-isotope compositions. Cross plots of δ13C vs δ18O (Fig. 9) yield basically no correlation from Yingshanbeipo, Dabantage and Shuinichang sections and the Tabei wells (r 2 = 0.05, 0.03, 0.03 and 0.09, respectively) and show no clear covariation of carbon and oxygen isotopes, which would be observed in settings with high amounts of pore water (rock interaction with water of meteoric origin) (Banner & Hanson, Reference Banner and Hanson1990; Edwards & Saltzman, Reference Edwards and Saltzman2014). Data points with oxygen isotopes less than −10 ‰ or Mn/Sr greater than 10 (Fig. 10) suggest post-depositional alteration and are excluded from the analysis of the original carbon isotopic composition. Furthermore, the carbon isotope shifts are comparable at different sampling locations (e.g. Zhang et al. Reference Zhang, Li, Tan, Yue, Cai and Li2014; Liu et al. Reference Liu, Liu, Luo, Shao, Luo and Zhang2016 b; Zhang & Munnecke, Reference Zhang and Munnecke2016), and can be used for local and global correlations of equivalent sequences from different depositional settings. Therefore, the original carbon isotopic composition in most of these rocks likely preserves a record of the δ13C of Early–Middle Ordovician seawater and can reflect depositional conditions.
Cross plots of δ13C and δ18O data from the Yingshanbeipo, Dabantage and Shuinichang sections and Tabei wells.

5.b. Implications of carbon isotopic stratigraphy
The primary stable isotopic signatures preserved in marine carbonates have been proven to be an effective tool for better understanding of sedimentary sequences from different sedimentary environments (e.g. Veizer et al. Reference Veizer, Ala, Azmy, Bruckschen, Bruhn, Buhl, Carden, Diener, Ebneth, Goddris, Jasper, Korte, Pawellek, Podlaha and Strauss1999; Halverson et al. Reference Halverson, Hoffman, Schrag, Maloof and Rice2005; Immenhauser et al. Reference Immenhauser, Holmden, Patterson, Pratt and Holmden2008; Azmy et al. Reference Azmy, Stouge, Christiansen, Harper, Knight and Boyce2010). Carbon isotope stratigraphy is often used as a tool for identifying sea-level changes and unconformities (Azmy et al. Reference Azmy, Stouge, Christiansen, Harper, Knight and Boyce2010; Zaitsev & Pokrovsky, Reference Zaitsev and Pokrovsky2014). The relationship between early Palaeozoic δ13C excursions and sea level has been widely examined and compared (e.g. Saltzman et al. Reference Saltzman, Ripperdan, Brasier, Lohmann, Robison, Chang, Peng, Ergalieve and Runnegar2000; Eriksson & Calner, Reference Eriksson and Calner2008; Bergström et al. Reference Bergström, Young and Schmitz2010; Munnecke et al. Reference Munnecke, Calner, Harper and Servais2010; Calner et al. Reference Calner, Lehnert and Jeppsson2012); however, it remains unclear to what extent sea level affects δ13C values (Edwards & Saltzman, Reference Edwards and Saltzman2014). The development of karst at the Cambrian–Ordovician boundary was regarded as one of the distinguishing features of the Yingshanbeipo and Shuinichang sections (Gao et al. Reference Gao, Fan, Ding and Hu2016). A negative shift of δ13C values is also present at this interface possibly because of meteoric diagenesis in the Yingshanbeipo section. The negative δ13C shift across the Cambrian–Ordovician boundary is recognized in both the Yingshanbeipo and Shuinichang profiles (Fig. 11), which was interpreted as a fall in sea level (Jing et al. Reference Jing, Deng, Zhao, Lu and Zhang2008).
Cross plots of Mn/Sr vs δ13C (a) and δ18O (b) in the Yingshanbeipo and Shuinichang sections and Tabei wells, showing insignificant correlations.

Correlation of δ13C data from the Dabantage profile, Yingshanbeipo profile, Shuinichang profile and Tabei wells.

The boundary between the Penglaiba and Yingshan formations at the Yingshanbeipo and Shuinichang sections was identified as a disconformity mainly on the basis of the conodont and carbon isotopic stratigraphy (Deng et al. Reference Deng, Huang, Jing, Du, Lu and Zhang2008; Zhang & Munnecke, Reference Zhang and Munnecke2016). From the Tremadocian to the Floian, a negative shift from −0.9 ‰ to −3.4 ‰ is observed near the boundary between the Penglaiba Formation and the Yingshan Formation in the Tabei wells, while positive shifts are observed in the Dabantage and Shuinichang sections (Fig. 11), which may reflect the absence of equivalent strata in the Tabei wells. A 13 cm thick caliche layer can be seen between the Penglaiba and Yingshan formations in the Dabantage section. In well Yubei 5, a large number of multi-cycle exposure indicators, such as caliche, vadose pisolite, ruiniform horizon and tepee structure, have been recognized in the Penglaiba Formation (Cai et al. Reference Cai, Li, You, Gao and Ma2016). The boundary between the Penglaiba and Yingshan formations is an angular unconformity at the Penglaiba outcrop on the NW margin of the basin (Gao et al. Reference Gao, Fan, Ding and Hu2016). The unconformity between the Penglaiba and Yingshan formations extends across the Tarim Basin and was accompanied by short-term subaerial exposure due to sea-level fall and local tectonic uplift (Cai et al. Reference Cai, Li, You, Gao and Ma2016; Gao et al. Reference Gao, Fan, Ding and Hu2016).
The boundary between the Lower and Middle Ordovician has not been well constrained in the Tarim Basin. A slight fluctuation of δ13C near the boundary has already been shown in wells Shun 4 and Pishanbei 2 (Zhang et al. Reference Zhang, Li, Tan, Yue, Cai and Li2014; Liu et al. Reference Liu, Liu, Luo, Shao, Luo and Zhang2016 b) as well as in the Dabantage section (Zhang & Munnecke, Reference Zhang and Munnecke2016). The δ13C increases from −4.2 ‰ to 0.2 ‰ across the Lower–Middle Ordovician boundary in the Tabei region and from −2.10 ‰ to −0.7 ‰ in the Dabantage section (Fig. 11), which is consistent with a rise in sea level and a transition from a restricted platform in the Early Ordovician to an open platform in the Middle Ordovician (Lin et al. Reference Lin, Yang, Liu, Rui, Cai, Li and Yu2012; Zhao, Reference Zhao2015). From the Dapingian to the Darriwilian, δ13C initially decreased and then increased (Fig. 7), which is also consistent with sea-level change in the corresponding time period (Zhao, Reference Zhao2015). The remarkable positive δ13C shift, from c. −3 ‰ to c. +1 ‰ in the Darriwilian section, could correlate with the global MDICE event. However, the peak and the decreasing limb of the MDICE have probably been eroded for the extremely sharp sedimentological contact between the limestones of the Dawangou Formation and the black shales of the Saergan Formation (Zhang and Munnecke, Reference Zhang and Munnecke2016). Although the relationships between the carbon isotopic composition and relative sea level are not that obvious, they are clearer around the key boundaries, such as the Floian–Dapingian and the Dapingian–Darriwilian boundaries.
Stratigraphic units (e.g. in the Penglaiba Formation) are up to eight times thinner in the Yingshanbeipo section than at the Dabantage section. There are two possible reasons for the different stratal thickness between the two sections. First, the lack of a Colaptoconus quadraplicatus Zone, and Paltodus deltifer Zone, represents a 7.2 Ma stratigraphic gap in the Yingshanbeipo section (Deng et al. Reference Deng, Huang, Jing, Du, Lu and Zhang2008). Second, compared to the extensive dolomite in the Dabantage section, there is mainly limestone in the Yingshanbeipo section, which implies that the original palaeo-water depth is deeper. The δ13C values of the Penglaiba Formation range from −1 ‰ to 0 ‰ in the Yingshanbeipo section, which is similar to the lower part of the Penglaiba Formation in the Dabantage section (Fig. 11). This shows that the upper part of the Penglaiba Formation may have been eroded in the Yingshanbeipo section. Therefore, the Dabantage section was chosen as the reference section of the Tarim Basin to correlate with other global sections.
5.c. Implications for global correlations
Carbon isotope excursions have been proven as reliable tools for global correlation of geologic formations (e.g. Bergström et al. Reference Bergström, Saltzman and Schmitz2006, Reference Bergström, Lehnert, Calner and Joachimski2012; Ainsaar et al. Reference Ainsaar, Kaljo, Martma, Meidla, Männik, Nõlvak and Tinn2010; Albanesi et al. Reference Albanesi, Bergström, Schmitz, Serra, Feltes, Voldman and Ortega2013; Sial et al. Reference Sial, Peralta, Gaucher, Toselli, Ferreira, Frei, Parada, Pimentel and Pereira2013; Hints et al. Reference Hints, Martma, Männik, Nõlvak, Põldvere, Shen and Viira2014). It is easy to misinterpret the carbon isotope data due to a lack of biostratigraphy for a shallow water carbonate platform (Zhang & Munnecke, Reference Zhang and Munnecke2016). As a result, determining the conodont distribution and identifying unconformities would improve the accuracy of a carbon isotope stratigraphy. The Tarim Basin was a peri-Gondwana terrane for much of its history and shares many conodont taxa with the Australasian Conodont Superprovince (Zhen et al. Reference Zhen, Percival and Zhang2015). The first appearance of the conodont Iapetognathus fluctivagus is the index for the basal boundary of the Ordovician (Cooper et al. Reference Cooper, Nowlan and Williams2001); however, a relatively continuous sequence of biological evolution is difficult to construct because of the low fossil abundance in the Tarim Basin (Jing et al. Reference Jing, Deng, Zhao, Lu and Zhang2008). When I. fluctivagus is absent, the appearance of the T. nakamurai – T. huanghuachangensis – T. gracilis fauna can identify the boundary interval between the Cambrian and Ordovician. T. gracilis is also present in the Shakopee Formation in Wisconsin, USA, and the Ninmaroo Formation in Queensland, Australia (Jing, Reference Jing2009). The boundary between the Tremadocian and Floian is defined using the Paltodus deltifer and Serratognathus diversus conodont zones, which can be recognized in the Dabantage section of the Tarim Basin, and in South China (Figs 2 and 7). Both Baltoniodus triangularis and Oepikodus evae Zones are not found in the Tarim Basin (Xiong et al. Reference Xiong, Tao and Wang2015). There is no unconformable contact between Dapingian and Darriwilian in the Dabantage section (Zhang & Munnecke, Reference Zhang and Munnecke2016).
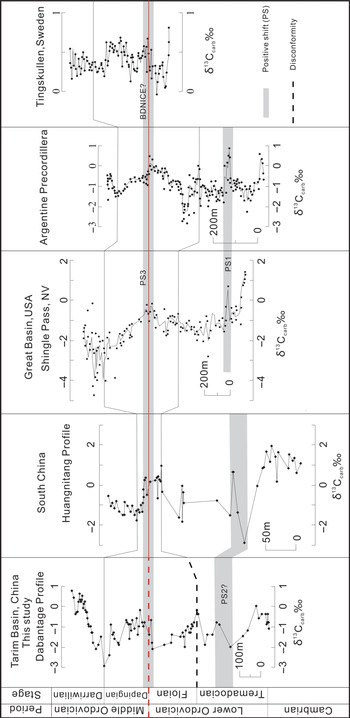
Based on the locations of the stage boundaries, the unconformities and conodont identification, the carbon isotope stratigraphy of the Tarim Basin can be compared with that of other regions (Fig. 12). During the Tremadocian, positive excursions in δ13C (PS1 in Fig. 12) were also seen in the Great Basin and in the Argentine Precordillera (Buggisch et al. Reference Buggisch, Keller and Lehnert2003; Edwards & Saltzman, Reference Edwards and Saltzman2014). It is challenging to identify this positive shift in δ13C in the Tarim Basin and in southern China due to the lack of comparable conodont zones. However, the positive shift (PS2 in Fig. 12) is apparent, which may be consistent with PS1. More conodont data are required to achieve a better correlation. The negative shift in δ13C is preserved in the Floian in the Tarim Basin; whereas in the Great Basin and the Argentine Precordillera, both the early negative δ13C shift and the later positive δ13C shift are preserved. This may reflect erosion at the end of the Floian in the Tarim Basin, which removed the record of the later positive shift in this area (Gao et al. Reference Gao, Fan, Ding and Hu2016).
Correlation of δ13C data from the Dabantage to δ13C from South China (Munnecke et al. Reference Munnecke, Zhang, Liu and Cheng2011), the Great Basin, USA (Edwards & Saltzman, Reference Edwards and Saltzman2014), the Argentine Precordillera (Buggisch et al. Reference Buggisch, Keller and Lehnert2003) and Tingskullen, Sweden (Calner et al. Reference Calner, Lehnert, Wu, Dahlqvist and Joachimski2014; Wu et al. Reference Wu, Mikael and Oliver2016). Correlative δ13C isotope positive shifts (PS1–PS3) are highlighted in grey.

During the Floian, δ13C continuous decreased in the Tarim Basin, compared with an early sustained decline and a late continuous increase in both the Great Basin and Argentine Precordillera (Fig. 12). A positive shift across the Floian–Dapingian boundary (PS3) is preserved. An increase throughout the Floian, during which δ13C reached a maximum of 0 ‰, was shown not only in the Tarim Basin, but also in South China (Munnecke et al. Reference Munnecke, Calner, Harper and Servais2010), the Great Basin (Edwards & Saltzman, Reference Edwards and Saltzman2014) and the Argentine Precordillera (Buggisch et al. Reference Buggisch, Keller and Lehnert2003) (Fig. 12). However, the generally low δ13C values observed across PS3, defined as BDNICE (Lehnert et al. Reference Lehnert, Meinhold, Wu, Calner and Joachimski2014), are different for local environmental changes in Jämtland, Sweden (Wu et al. Reference Wu, Mikael, Oliver, Olof and Michael2014, Reference Wu, Mikael and Oliver2016). There are two types of positive shift at the Lower–Middle Ordovician boundary. One of them is an initial decrease and then an increase, such as observed in the Tarim Basin. The other positive shift is a continuous increase, such as seen in the Great Basin and the Argentine Precordillera. This positive shift may show the effects of local factors, including disconformity, dolomitization and platform restriction, superimposed on the global δ13C signal. A negative shift of δ13C associated with sea-level falls usually represents stratigraphy gaps (Azmy et al. Reference Azmy, Stouge, Christiansen, Harper, Knight and Boyce2010), or the delivery of 12C-enriched carbon. Xiong et al. (Reference Xiong, Yu, Cao, Cheng, Yue, Wu, Xu and Hu2013) also identified a disconformity in the Yingshan Formation using the conodont stratigraphy. During the Dapingian, although the magnitude of the δ13C decrease varied between all sections, δ13C generally decreases (Edwards & Saltzman, Reference Edwards and Saltzman2014) (Fig. 12), which shows the consistency of global marine environment changes.
6. Conclusions
New sedimentological and isotopic data from multiple sections and wells have been obtained in the Lower–Middle Ordovician platform of the Tarim Basin. Correlations of carbon and oxygen isotopes and Mn/Sr suggest that the carbon isotopic composition in these rocks preserves an original record of the δ13C of Early–Middle Ordovician seawater and can reflect depositional conditions. On the basis of conodont biostratigraphy and the locations of unconformities, the latest interpretations of carbon isotopic compositions for the shallow water carbonate platform of the Tarim Basin have improved in accuracy. Some conodont zones and recurrent negative excursions in the Tremadocian, Floian and Dapingian stages appear to be truncated by unconformities, which are accompanied by short-term subaerial exposure due to sea-level fall and local tectonic uplift. Because of the relative continuity, the Dabantage section is chosen as the reference section of the Tarim Basin which can be correlated with other global sections. Carbon isotopes at the Lower and Middle Ordovician boundaries show complexity globally, such as an initial decrease and then an increase in the Tarim Basin, China, and Tingskullen, Sweden, and a continuous increase in the Great Basin of western USA, as well as the Argentine Precordillera, which were affected by local factors, including disconformity, dolomitization and platform restriction, superimposed on the global δ13C signal.
Acknowledgements
We thank Yuanyuan Shi, senior engineer, Yongli Liu, engineer, and Caijun Hong, engineer, from the Exploration & Production Research Institute of SINOPEC Northwest Oilfield Company, Urumqi, Xinjiang, China, for providing help with this study. We thank Accdon LLC (www.accdon.com) for its linguistic assistance during the preparation of the manuscript. We appreciate the detailed and constructive comments by Cole T. Edwards, Guillermo L. Albanesi, Stig M. Bergström, an anonymous reviewer, and editors Stephen Hubbard and Peter Clift, that greatly improved this paper. This research was funded by Natural Science Foundation of China (No. 41802134), Strategic Priority Research Program Grant of the Chinese Academy of Sciences (No. XDA14010201-02), and Excellent Supervisor Fund of China University of Geosciences, Beijing (No. 53200859664).