





1 Introduction
Taylor–Couette flow occurs between two concentric and independently rotating cylinders. It represents one of the closed systems in fluid mechanics that is widely used as a model system for turbulence studies (e.g. see the recent review article by Grossmann, Lohse & Sun Reference Grossmann, Lohse and Sun2016). In this highly symmetric system, the power input can be controlled via the differential rotation of the cylinders, and the resultant energy dissipation can be measured by means of the torque on the cylinders. Different geometrical parameters and differential rotation of the cylinders enable us to observe various flow regimes (e.g. Andereck, Liu & Swinney Reference Andereck, Liu and Swinney1986; Dong Reference Dong2007; Tokgoz Reference Tokgoz2014).
The relevant geometrical parameters are the radius ratio,
 $\unicode[STIX]{x1D702}$
, defined as the ratio of the inner and outer cylinder radius, and the aspect ratio,
 $\unicode[STIX]{x1D6E4}$
, defined as the length of the cylinders,
 $L$
, relative to the gap width,
 $d$
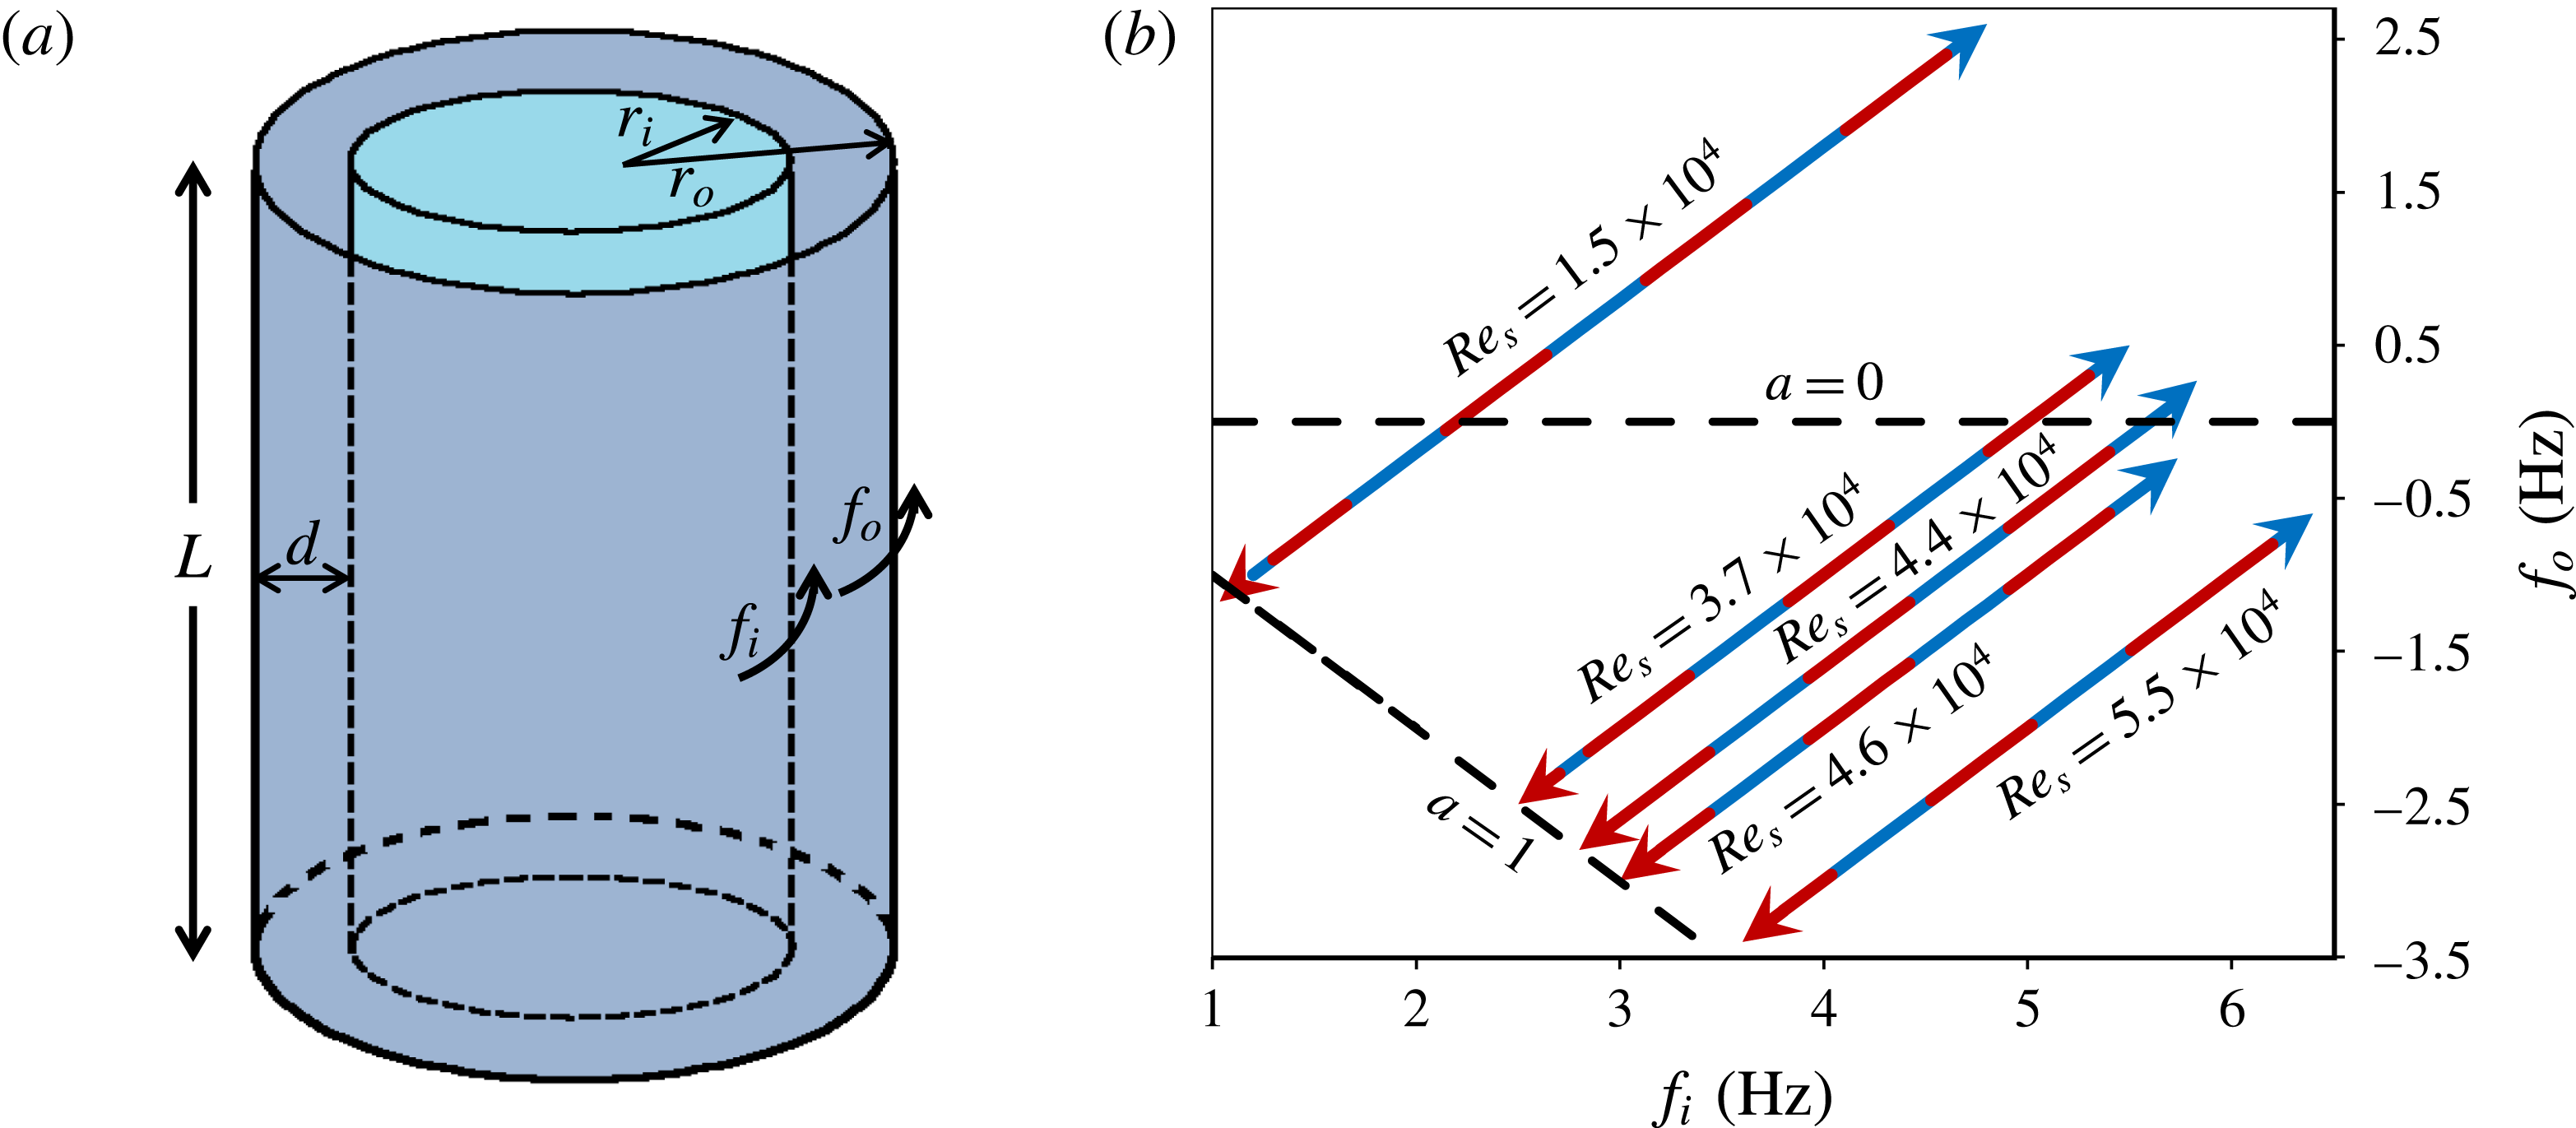
(figure 1
a). The flow conditions at the ends of the cylinders can also be considered as a geometrical parameter. Some other parameters defining Taylor–Couette flow are the shear Reynolds number,
 $\mathit{Re}_{s}=2|\unicode[STIX]{x1D702}\mathit{Re}_{o}-\mathit{Re}_{i}|/(1+\unicode[STIX]{x1D702})$
, and the rotation number,
 $\mathit{Re}_{\unicode[STIX]{x1D6FA}}=(1-\unicode[STIX]{x1D702})(\mathit{Re}_{o}+\mathit{Re}_{i})/(\unicode[STIX]{x1D702}\mathit{Re}_{o}-\mathit{Re}_{i})$
(Dubrulle et al.
Reference Dubrulle, Dauchot, Daviaud, Longaretti, Richard and Zahn2005). Here,
 $\mathit{Re}_{o}=2\unicode[STIX]{x03C0}f_{o}r_{o}d/\unicode[STIX]{x1D708}$
and
 $\mathit{Re}_{i}=2\unicode[STIX]{x03C0}f_{i}r_{i}d/\unicode[STIX]{x1D708}$
are the outer and inner cylinder based Reynolds numbers, respectively, where
 $f_{o}$
,
 $f_{i}$
are the rotation frequencies and
 $r_{o}$
,
 $r_{i}$
are radii of the outer and inner cylinders, respectively, and
 $\unicode[STIX]{x1D710}$
is the kinematic viscosity of the fluid.
Andereck et al. (Reference Andereck, Liu and Swinney1986) conducted flow visualization experiments at a radius ratio of 0.883 and accordingly formed a comprehensive map of different flow states occurring in Taylor–Couette flow at low and moderate Reynolds numbers. At low inner and outer cylinder Reynolds numbers the flow was observed to be laminar with several distinct flow states. As they increased the Reynolds number to a shear Reynolds number of
 $5.9\times 10^{3}$
no obvious structures were observed in the flow, and they termed this regime ‘featureless turbulence’. However, recent experimental and numerical studies (e.g. Bilson & Bremhorst Reference Bilson and Bremhorst2007; Dong Reference Dong2008; Ravelet, Delfos & Westerweel Reference Ravelet, Delfos and Westerweel2010; Tokgoz, Elsinga & Westerweel Reference Tokgoz, Elsinga and Westerweel2011; Huisman et al.
Reference Huisman, van der Veen, Sun and Lohse2014; Ostilla-Mónico et al.
Reference Ostilla-Mónico, van der Poel, Verzicco, Grossmann and Lohse2014a
) showed the persistence of large-scale structures even at much higher Reynolds numbers.
Schematic of a Taylor–Couette system (a) and sketch of the trajectories in the (
 $f_{i}$
,
 $f_{o}$
) parameter space followed during the torque measurements for different constant
 $\mathit{Re}_{s}$
(b). The red and blue arrows respectively indicate the direction of increasing and decreasing frequency ratio,
 $a$
, along each trajectory.
In their study, Lathrop, Fineberg & Swinney (Reference Lathrop, Fineberg and Swinney1992) proposed that a boundary layer transition to a turbulent regime occurs at a Reynolds number of
 $1.3\times 10^{4}$
based on their highly accurate torque and wall shear stress measurements. Later, this finding was verified by local measurements by Lewis & Swinney (Reference Lewis and Swinney1999). The transition can also be seen in the torque scaling experiments of Wendt (Reference Wendt1933). Recent experimental (e.g. Lathrop et al.
Reference Lathrop, Fineberg and Swinney1992; Huisman et al.
Reference Huisman, Scharnowski, Cierpka, Kähler, Lohse and Sun2013) and numerical (e.g. Ostilla-Mónico et al.
Reference Ostilla-Mónico, van der Poel, Verzıcco, Grossmann and Lohse2014b
) studies showed that at Reynolds numbers beyond the transition the boundary layer is turbulent having a logarithmic velocity profile similar to other wall bounded turbulent flows.
Studies carried out by van Gils et al. (Reference van Gils, Huisman, Bruggert, Sun and Lohse2011), Paoletti & Lathrop (Reference Paoletti and Lathrop2011), Brauckmann & Eckhardt (Reference Brauckmann and Eckhardt2013a
,Reference Brauckmann and Eckhardt
b
) showed that optimum angular momentum transport occurs around moderate counter-rotation, i.e.
 $f_{o}/f_{i}\approx -0.4$
, with radius ratios
 $0.5<\unicode[STIX]{x1D702}<0.7245$
. A recent study conducted by Tokgoz (Reference Tokgoz2014) revealed that at a constant shear Reynolds number of
 $2.9\times 10^{4}$
and a radius ratio of 0.917, coherent structures change orientation from Taylor vortices to inclined vortices and to Taylor column-like structures at rotation numbers of
 $-0.083$
,
 $-0.010$
and 0, respectively. He relates this change in the orientation with the rotation numbers to the change in the angular momentum transport and therefore torque. So, depending on the control parameters, differences in turbulent states occur.
An interesting question raised recently is whether multiple states exist in turbulent Taylor–Couette flows at the same experimental conditions. Huisman et al. (Reference Huisman, van der Veen, Sun and Lohse2014) performed torque and velocity measurements at a very high shear Reynolds number, of the order of
 $10^{6}$
. During their experiments they followed basically two different trajectories at a constant shear Reynolds number while varying a, defined as
 $a=-f_{o}/f_{i}$
. One trajectory is in the direction of increasing
 $a$
, while the other one is in the direction of decreasing
 $a$
. Their results reveal that hysteresis occurs with a high probability (80 %) within a certain range of values for
 $a$
, i.e.
 $0.17<a<0.51$
. They conjecture that this difference in the torque values is due to different turbulent states occurring in the Taylor–Couette flow. Later, van der Veen et al. (Reference van der Veen, Huisman, Dung, Tang, Sun and Lohse2016) continued this work with a different set-up having a higher aspect ratio (
 $\unicode[STIX]{x1D6E4}=18.3$
compared to
 $\unicode[STIX]{x1D6E4}=11.7$
before). They measured the radial and azimuthal velocity components at several axial locations. Similar to their earlier study, they observed bifurcation and different velocity distributions for a certain range of values for a, most significantly in the radial velocity component. They concluded that hysteresis in highly turbulent Taylor–Couette flow is robust, meaning that it occurs also at
 $\unicode[STIX]{x1D6E4}=18.3$
. However, the detailed dependence of the hysteresis on the geometrical parameters, such as the aspect ratio, radius ratio and boundary conditions at the ends of a Taylor–Couette facility, remains unclear. Furthermore, we wonder if the torque hysteresis represents a genuine change in the turbulent flow state, i.e. the structure of velocity fluctuations, as opposed to a change in the base flow, i.e. mean flow. Hence, in order to understand the hysteresis or multiple states in turbulent Taylor–Couette flow further studies with different geometrical parameters and flow conditions are required.
In this study, we performed torque and particle image velocimetry (PIV) measurements for different geometrical configurations and flow conditions to study the hysteresis in Taylor–Couette flow up to a shear Reynolds number of
 $5.5\times 10^{4}$
, which is beyond the transition regime, and therefore can be considered as fully turbulent. Different geometrical configurations were achieved by changing the aspect ratio and the end conditions, while maintaining a radius ratio of
 $\unicode[STIX]{x1D702}=0.917$
.
This paper is organized as follows: a description of the experimental set-up and methodology is given in § 2. This is followed, in § 3, by the results of the torque measurements at different shear Reynolds number and aspect ratio, and the analysis based on the PIV measurements at the shear Reynolds number of
 $4.4\times 10^{4}$
and aspect ratio of 88. Finally, the findings are summarized in § 4.
2 Experimental set-up and methodology
Torque measurements were performed in the same Taylor–Couette flow facility with water as the working fluid. However, cylinders of different length were used to vary the aspect ratio. The axial aspect ratios,
 $\unicode[STIX]{x1D6E4}=L/d$
, of the shorter and the taller cylinders were 22 and 88, respectively. Fully filled Taylor–Couette systems were closed at both ends with end plates rotating together with the outer cylinder. On the other hand, intermediate values for
 $\unicode[STIX]{x1D6E4}$
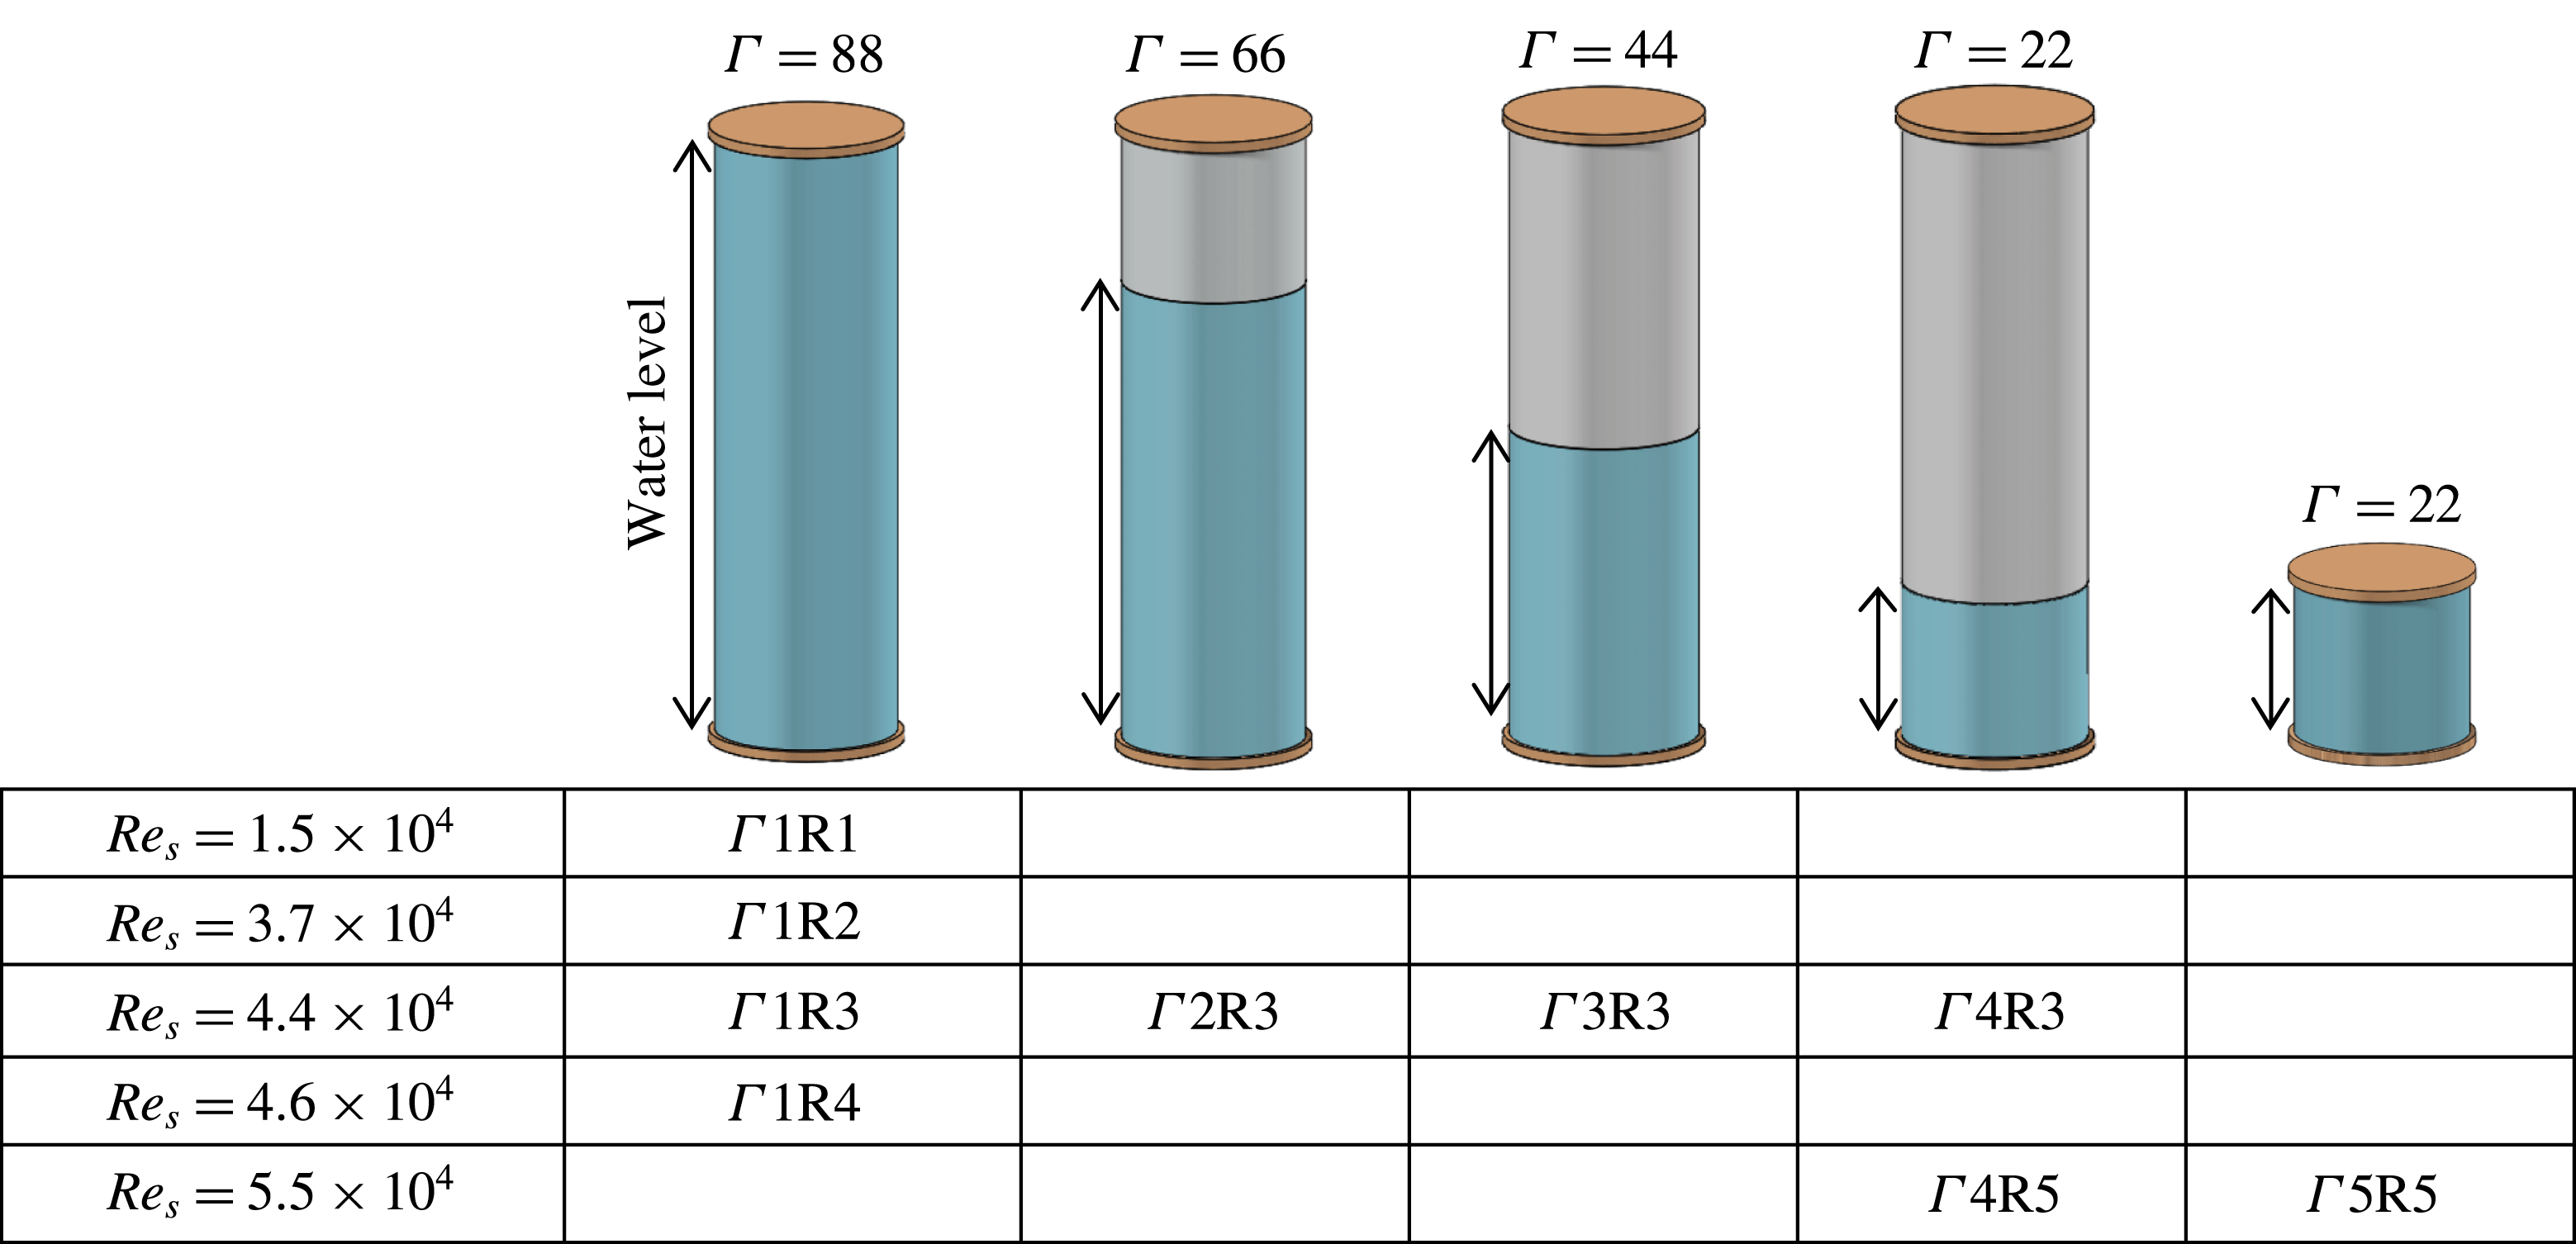
were achieved by changing the water level in the taller cylinder, where the system had only the lower end plate while the upper boundary was a free surface (figure 2). For all cases the inner and outer cylinder radii were
 $r_{i}=110$
and
 $r_{o}=120$
mm respectively, which resulted in a gap width
 $d=10$
mm and a radius ratio of
 $\unicode[STIX]{x1D702}=0.917$
.
During the torque measurements the outer and the inner cylinders were rotated, varying the frequency ratio while maintaining a constant difference in the frequencies of the two cylinders,
 $\unicode[STIX]{x0394}f=f_{i}-f_{o}$
. Therefore, the shear Reynolds number,
 $\mathit{Re}_{s}$
, remained constant. In order to investigate the hysteresis in the torque, the frequency ratio,
 $a$
, was first decreased incrementally, and at the end of the trajectory it was increased again with the same increments for each data set. Since the measurements with various step sizes showed that the hysteresis is not affected by the step size used, larger increments in
 $a$
outside the hysteresis loop were used to shorten the overall measurement time. After each increment in a, torque data were collected for two minutes after waiting for the flow to reach stable conditions. Finally, the mean torque at each setting was computed. Figure 1(b) shows these trajectories at five different constant shear Reynolds numbers in the
 $(f_{i},f_{o})$
parameter space and indicates the range of the measurements. In addition, figure 2 provides a schematic, summarizing and labelling all the cases considered for this study.
Schematic showing the water level in the gap of the tall and short Taylor–Couette cylinders with the resulting aspect ratios,
 $\unicode[STIX]{x1D6E4}$
, as well as the shear Reynolds numbers,
 $\mathit{Re}_{s}$
, studied. The labels for the considered cases are given in the table.
In our Taylor–Couette set-up the water temperature cannot be actively controlled. Thus, to avoid significant changes in temperature during the measurements, the system was operated for a few hours until a stable temperature was reached before taking the measurements. Furthermore, the temperature was recorded at the start and at the end of each data set. Repeated experiments showed that the hysteresis always occurred over the same range of rotational numbers and with approximately the same magnitude, even if the temperature difference in these experiments for an individual set varied between
 $0$
and
 $2.2\,^{\circ }\text{C}$
. Moreover, the range of rotational numbers for which hysteresis occurs spans only a limited part of the full range of
 $a$
covered in each experiment, and the torque differences in the hysteresis loop were small. Therefore, the power supplied to the flow was nearly constant, and consequently we may assume that the temperature change is small during hysteresis. This is confirmed by separate measurements covering only the range of rotational numbers corresponding to the hysteresis loop, which showed temperature changes less than
 $0.5\,^{\circ }\text{C}$
(compared to
 $2.2\,^{\circ }\text{C}$
for the full range).
On the other hand, not only for each individual data set, but also for the combined data set for a certain flow case, approximately constant temperature conditions should be maintained. For that, we applied a threshold of
 $2.2\,^{\circ }\text{C}$
on the temperature variation among the data sets for a particular flow case, and accordingly, we excluded the data that cause a temperature variation exceeding the threshold. This resulted in an overall deviation of less than 0.5 % in the torque at
 $a=1$
, which is outside the hysteresis loop in all cases, where we expect the torque to return to the same value at the end of an experiment. Finally, as a result of this threshold, the temperature difference over the remaining sets varies between
 $0$
and
 $1.2\,^{\circ }\text{C}$
.
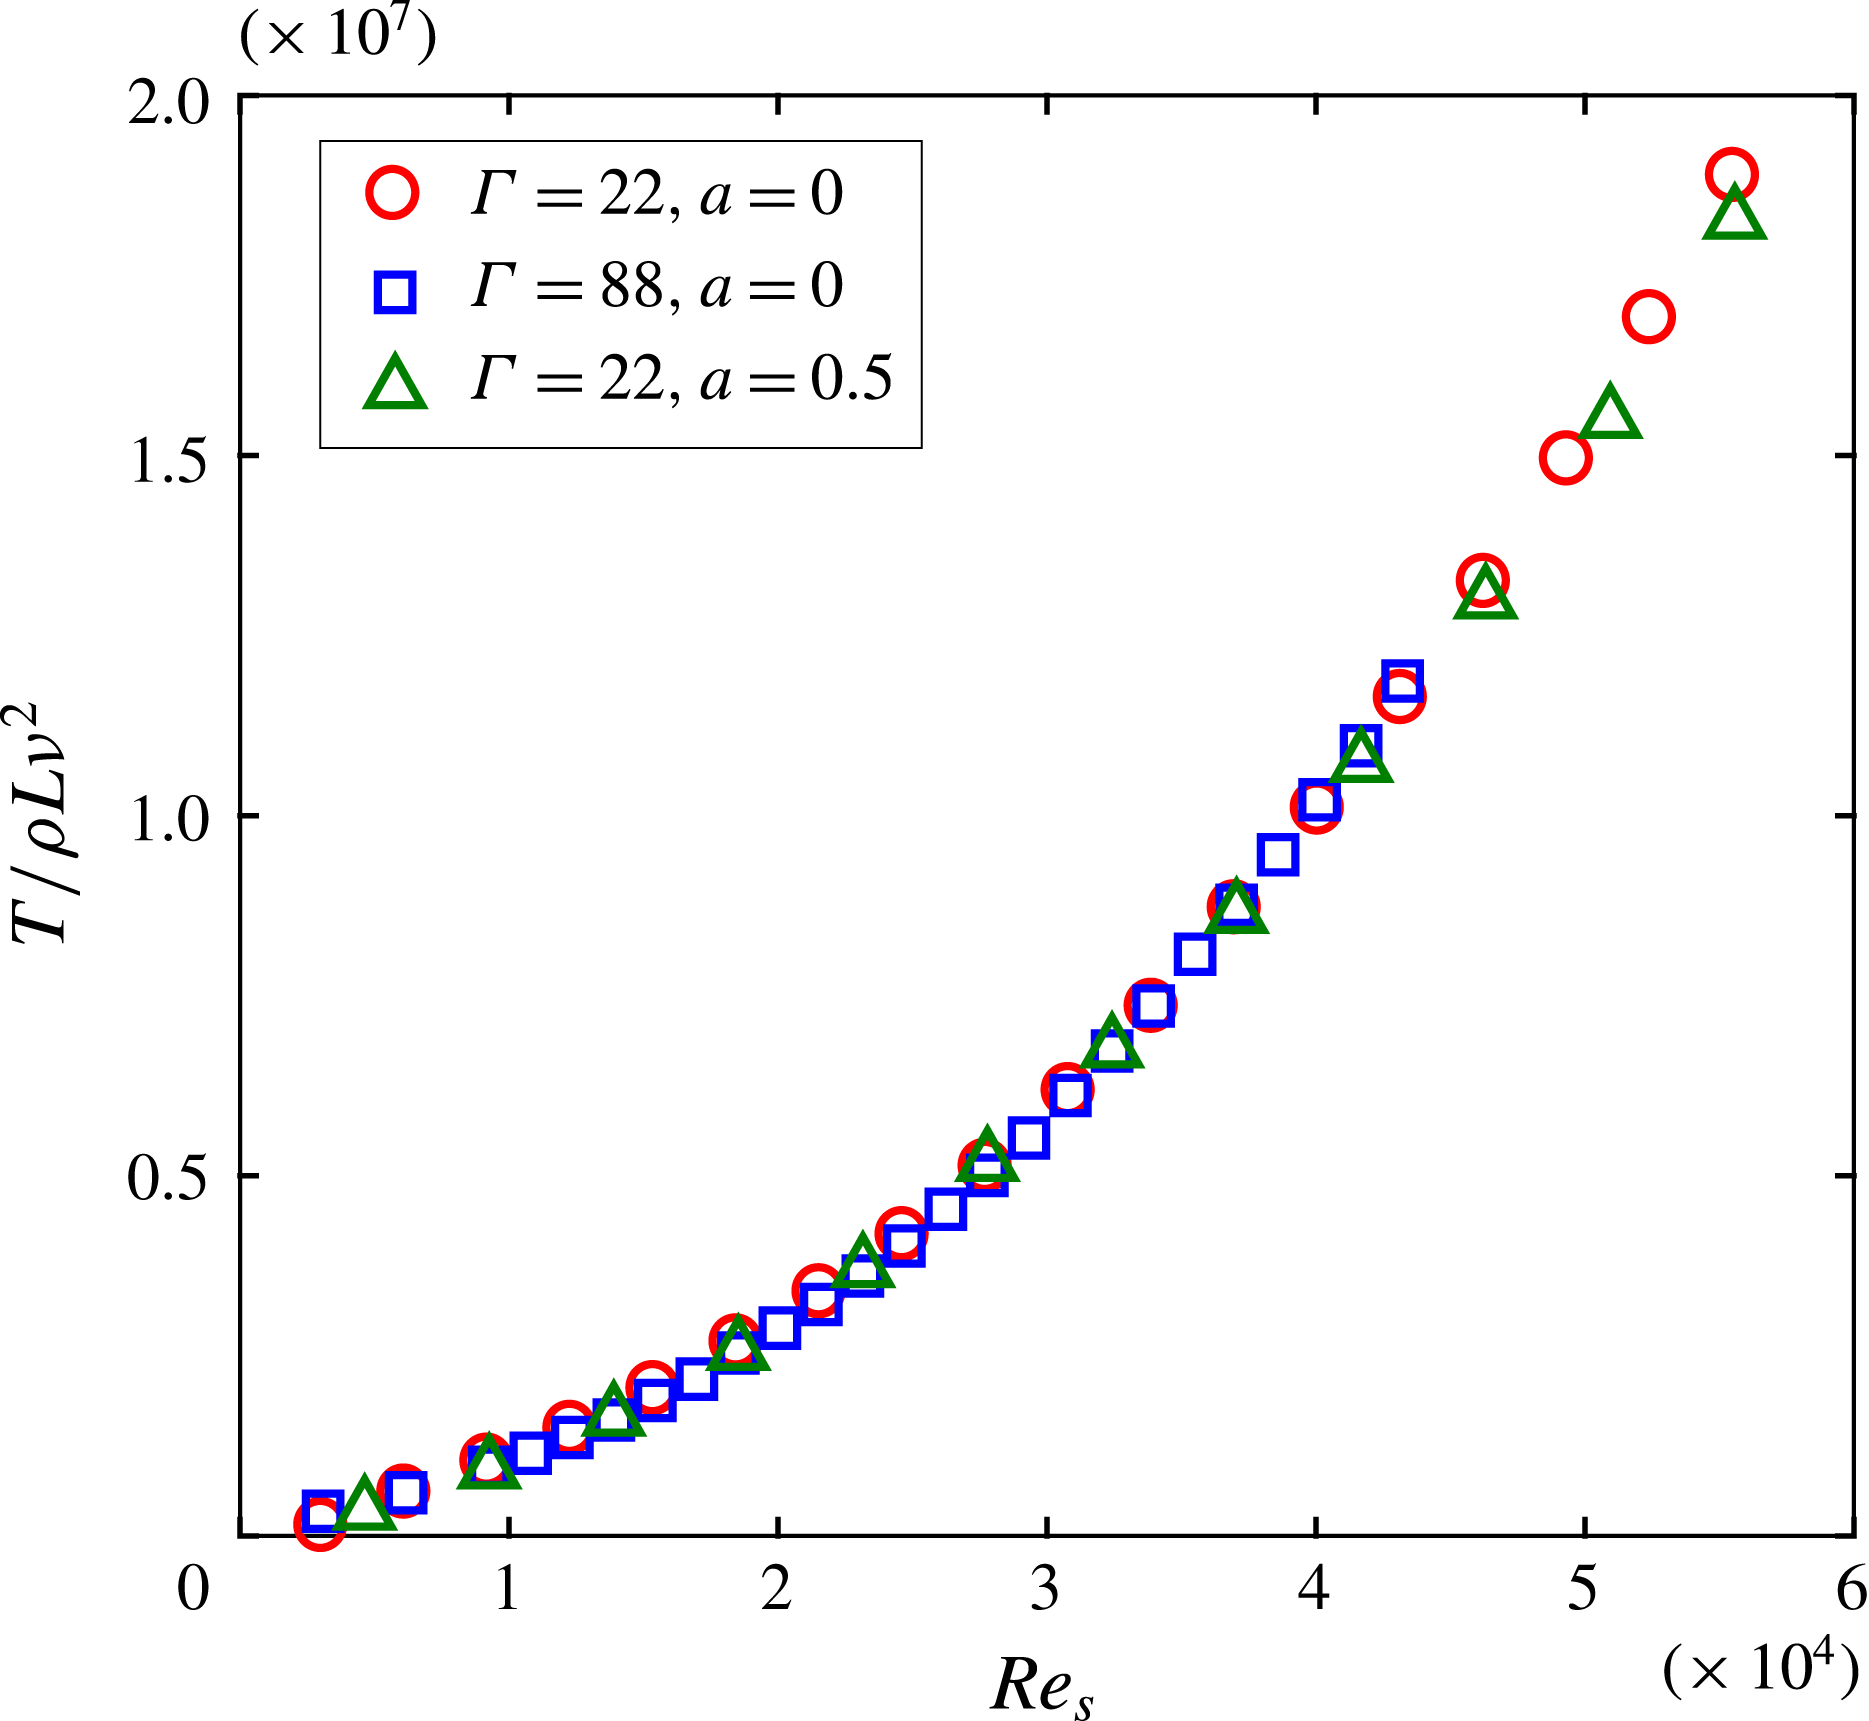
Corrected and normalized torque at different
 $\mathit{Re}_{s}$
for the short cylinder (
 $\unicode[STIX]{x1D6E4}=22$
) and the taller cylinder (
 $\unicode[STIX]{x1D6E4}=88$
) set-ups.
The torque measurements were performed by means of a torque-meter (HBM T20WN, 2 Nm) attached to the inner cylinder shaft. Therefore, the measured torque contained contributions from the Taylor–Couette flow and the von Kármán flow. The latter flow state is the flow in the gap between the end plates which are rotating together with the inner and outer cylinders. The contribution of the von Kármán flow was determined for several shear Reynolds numbers, based on the study conducted by Greidanus, Delfos & Westerweel (Reference Greidanus, Delfos and Westerweel2011) in the same set-up (their figure 4
a). Accordingly, the torque values were corrected. After applying the correction, a very good agreement in the torque was found for both the shorter and taller cylinders at
 $a=0$
and
 $a=0.5$
(figure 3). The corrected torque,
 $T$
, before and after the laminar–turbulent flow transition follows a similar power law, i.e.
 $T\propto \mathit{Re}_{s}^{\unicode[STIX]{x1D6FC}}$
. In the turbulent flow regime,
 $\unicode[STIX]{x1D6FC}$
is between 1.77 and 1.80 for the cases shown in figure 3, which are in the range of previously reported values (e.g. Wendt Reference Wendt1933; Lathrop et al.
Reference Lathrop, Fineberg and Swinney1992; van Gils et al.
Reference van Gils, Huisman, Bruggert, Sun and Lohse2011). The standard uncertainty of the mean torque for an individual data set,
 $\unicode[STIX]{x1D700}_{mean}=\unicode[STIX]{x1D70E}_{T}/\sqrt{N}$
, was also determined for each case studied. Here,
 $\unicode[STIX]{x1D70E}_{T}$
is the standard deviation of the torque, and
 $N$
is the number of independent samples (Adrian & Westerweel Reference Adrian and Westerweel2011). The uncertainty was found to be less than the magnitude of the hysteresis in the torque,
 $\unicode[STIX]{x0394}T$
, i.e. (
 $\unicode[STIX]{x1D700}_{mean}\sim 10^{-2}\unicode[STIX]{x0394}T$
), for all the cases considered. Further information about the set-up and accuracy of the measurements (torque and stereoscopic & tomographic PIV) conducted in the same facility can be found in the studies of Ravelet et al. (Reference Ravelet, Delfos and Westerweel2010), Tokgoz (Reference Tokgoz2014), Greidanus et al. (Reference Greidanus, Delfos, Tokgoz and Westerweel2015).
In figure 3, the corrected torque was normalized by
 $\unicode[STIX]{x1D70C}L\unicode[STIX]{x1D708}^{2}$
. However, all following torque data were normalized with the torque value,
 $T_{ref}$
, obtained at
 $a=0$
along the trajectory where
 $a$
increases, which facilitates an easy comparison of the hysteresis loops at different flow conditions.
Stereo-PIV set-up with two high-resolution cameras (a). Green lines indicate the laser sheet. Sample mean velocity field (b). Arrows indicate the radial and axial velocities, while the azimuthal velocity (normalized by the outer cylinder velocity) is represented by colour coding.

Finally, stereoscopic PIV measurements were conducted in the plane spanning the radial and the axial directions, which allowed examination of the large-scale flow structures. Fluorescent spheres (rhodamine B) with a mean diameter of
 $15~\unicode[STIX]{x03BC}\text{m}$
and a nominal density of
 $1.1~\text{g}~\text{cm}^{-3}$
were used as tracer particles. The tracers were illuminated by a double-pulsed Nd:YAG laser in a 1 mm thick light sheet, and the scattered light was recorded by two double-frame CCD cameras (Imager Pro LX 16M) in a stereoscopic configuration with a 90
 $^{\circ }$
angle between the viewing directions. The field of view was
 $4.09d\times 0.84d$
, which was imaged onto
 $4872\times 1000$
pixels. The time separation between the laser pulses was adjusted such that in each case the average particle image displacement was approximately 6 pixels. For each measurement, 800 image pairs, hence velocity fields, were obtained. The raw PIV images were processed with a commercial code (DaVis 7.2 by LaVision GmbH). A multi-pass algorithm was applied with a final interrogation area of
 $32\times 32$
pixels for the
 $a=0$
and
 $a=0.12$
cases, and
 $64\times 64$
pixels for the
 $a=0.22$
and
 $a=0.4$
cases. The corresponding in-plane spatial resolution is
 $0.027d\times 0.027d$
and
 $0.054d\times 0.054d$
, respectively, which is sufficient to capture the large-scale turbulent motions (
 $O$
(
 $d$
)) and the mean flow structures. Furthermore, a 50 % overlap of adjacent interrogations was used for all cases. Pictures showing the stereo-PIV set-up and a sample velocity field are given in figures 4(a) and 4(b), respectively.
3 Results
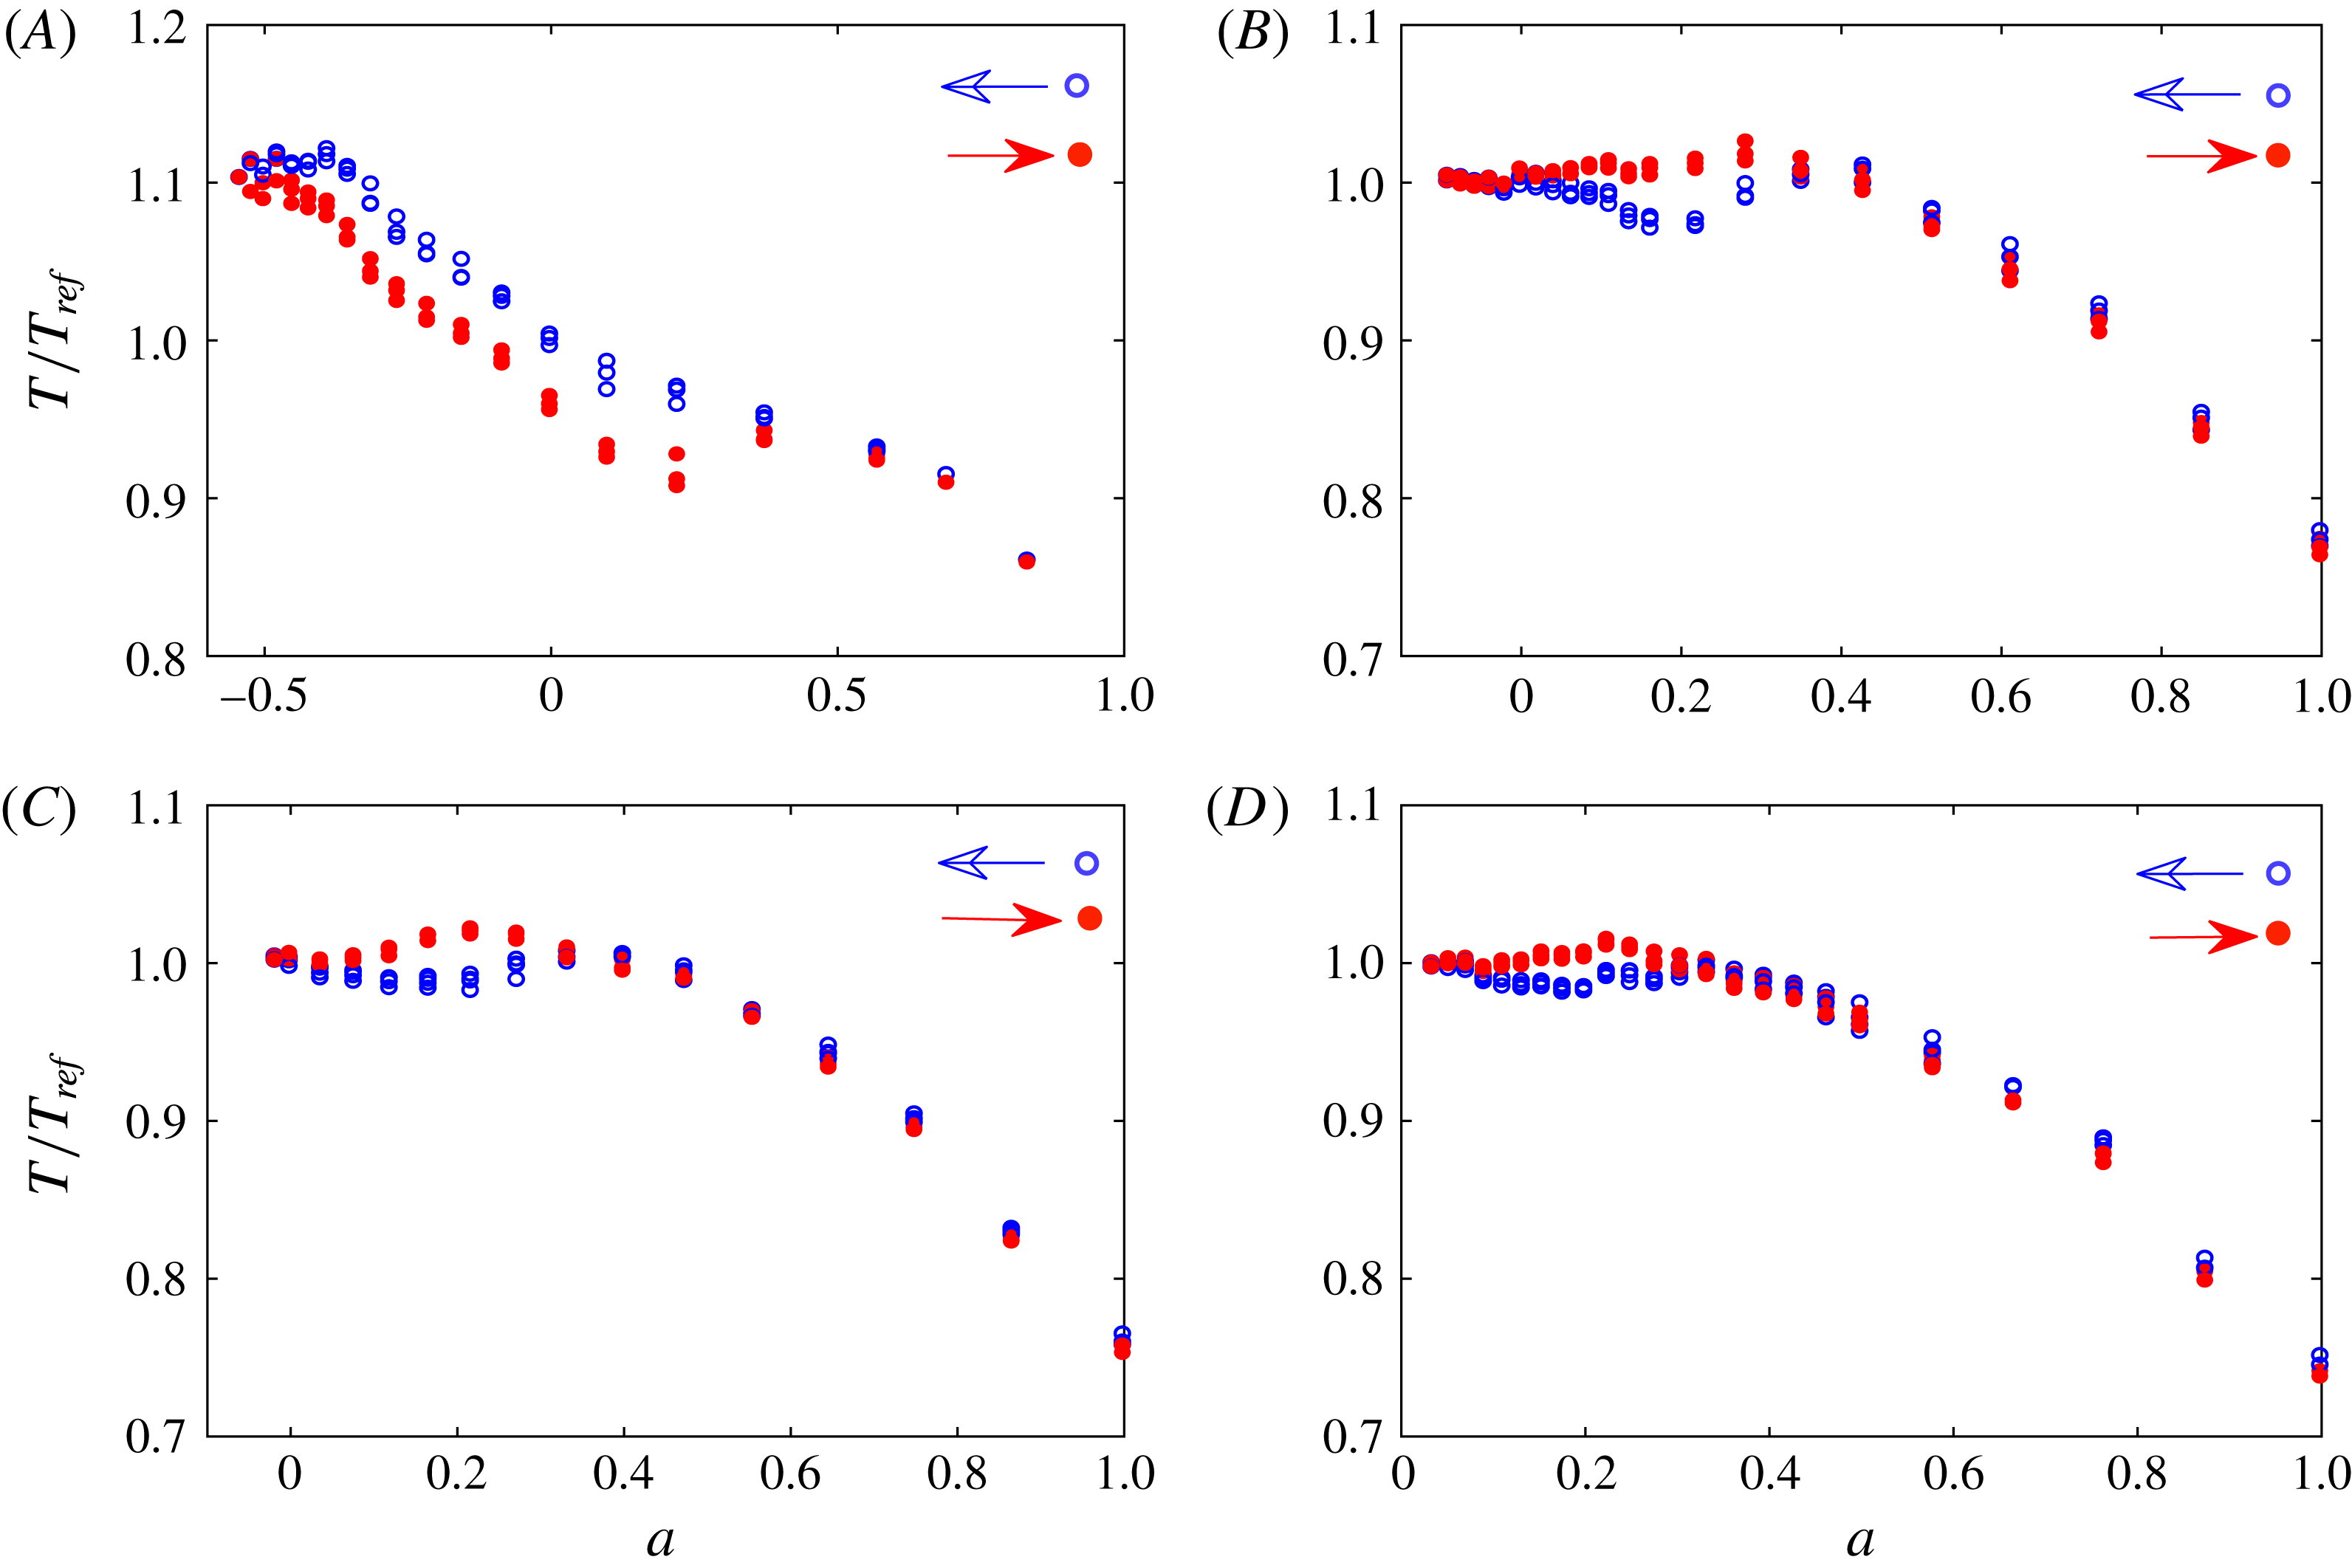
Hysteresis in the measured torque,
 $T$
, at different constant shear Reynolds numbers (A)
 $\unicode[STIX]{x1D6E4}1\text{R}1$
,
 $\mathit{Re}_{s}=1.5\times 10^{4}$
, (B)
 $\unicode[STIX]{x1D6E4}1\text{R}2$
,
 $\mathit{Re}_{s}=3.7\times 10^{4}$
, (C)
 $\unicode[STIX]{x1D6E4}1\text{R}3$
,
 $\mathit{Re}_{s}=4.4\times 10^{4}$
and (D)
 $\unicode[STIX]{x1D6E4}1\text{R}4$
,
 $\mathit{Re}_{s}=4.6\times 10^{4}$
at an aspect ratio of
 $\unicode[STIX]{x1D6E4}=88$
. For cases (A) and (B) we show 3 data sets, and for cases (C) and (D) 4 data sets. Torque values are normalized by a reference value,
 $T_{ref}$
(§ 2).
The effect of the shear Reynolds number,
 $\mathit{Re}_{s}$
, on the hysteresis is investigated first. Figure 5 presents the measured torque for four different values of
 $\mathit{Re}_{s}$
between
 $1.5\times 10^{4}$
and
 $4.6\times 10^{4}$
at an aspect ratio of 88. The lowest shear Reynolds number (figure 5
A) is around the laminar–turbulent transition Reynolds number, while the other shear Reynolds numbers correspond to the fully turbulent regime. The blue (unfilled) symbols represent measurements taken for decreasing
 $a$
while the red (filled) symbols represent for increasing
 $a$
. The results clearly depict a hysteresis in the torque at all shear Reynolds numbers considered. The magnitude of the hysteresis in terms of the normalized torque depends on the shear Reynolds number. Moreover, a clear difference in the hysteresis behaviour is visible between the transitional case (figure 5
A) and the turbulent regime (5
B–D). For the turbulent regime the torque values obtained for increasing
 $a$
(red) are higher than the values obtained for the opposite trajectory, whereas the reverse is observed for the transition regime. In addition, for the turbulent cases, it can be seen that the hysteresis does not occur around the peak torque values, which was found to be the case in the study of Huisman et al. (Reference Huisman, van der Veen, Sun and Lohse2014) (their figure 3
a). This may be explained by the different radius ratio (
 $\unicode[STIX]{x1D702}=0.716$
in their experiment, while
 $\unicode[STIX]{x1D702}=0.917$
for the present data), which can cause some discrepancies in Taylor–Couette flow (Ravelet et al.
Reference Ravelet, Delfos and Westerweel2010; Brauckmann & Eckhardt Reference Brauckmann and Eckhardt2013b
; Ostilla-Mónico et al.
Reference Ostilla-Mónico, van der Poel, Verzicco, Grossmann and Lohse2014a
). Moreover, the torque in our Taylor–Couette system follows the same behaviour without any jump between the states, in contrast to the results of Huisman et al. (Reference Huisman, van der Veen, Sun and Lohse2014). Furthermore, as the shear Reynolds number increases, the range of frequency ratios
 $a$
, for which the hysteresis is observed, shrinks.
Torque hysteresis behaviour at different aspect ratios (A)
 $\unicode[STIX]{x1D6E4}1\text{R}3$
,
 $\unicode[STIX]{x1D6E4}=88$
, (B)
 $\unicode[STIX]{x1D6E4}2\text{R}3$
,
 $\unicode[STIX]{x1D6E4}=66$
, (C)
 $\unicode[STIX]{x1D6E4}3\text{R}3$
,
 $\unicode[STIX]{x1D6E4}=44$
and (D)
 $\unicode[STIX]{x1D6E4}4\text{R}3$
,
 $\unicode[STIX]{x1D6E4}=22$
, at
 $\mathit{Re}_{s}=4.4\times 10^{4}$
. Four data sets for cases (A) and (D), and three data sets for cases (B) and (C) are shown.
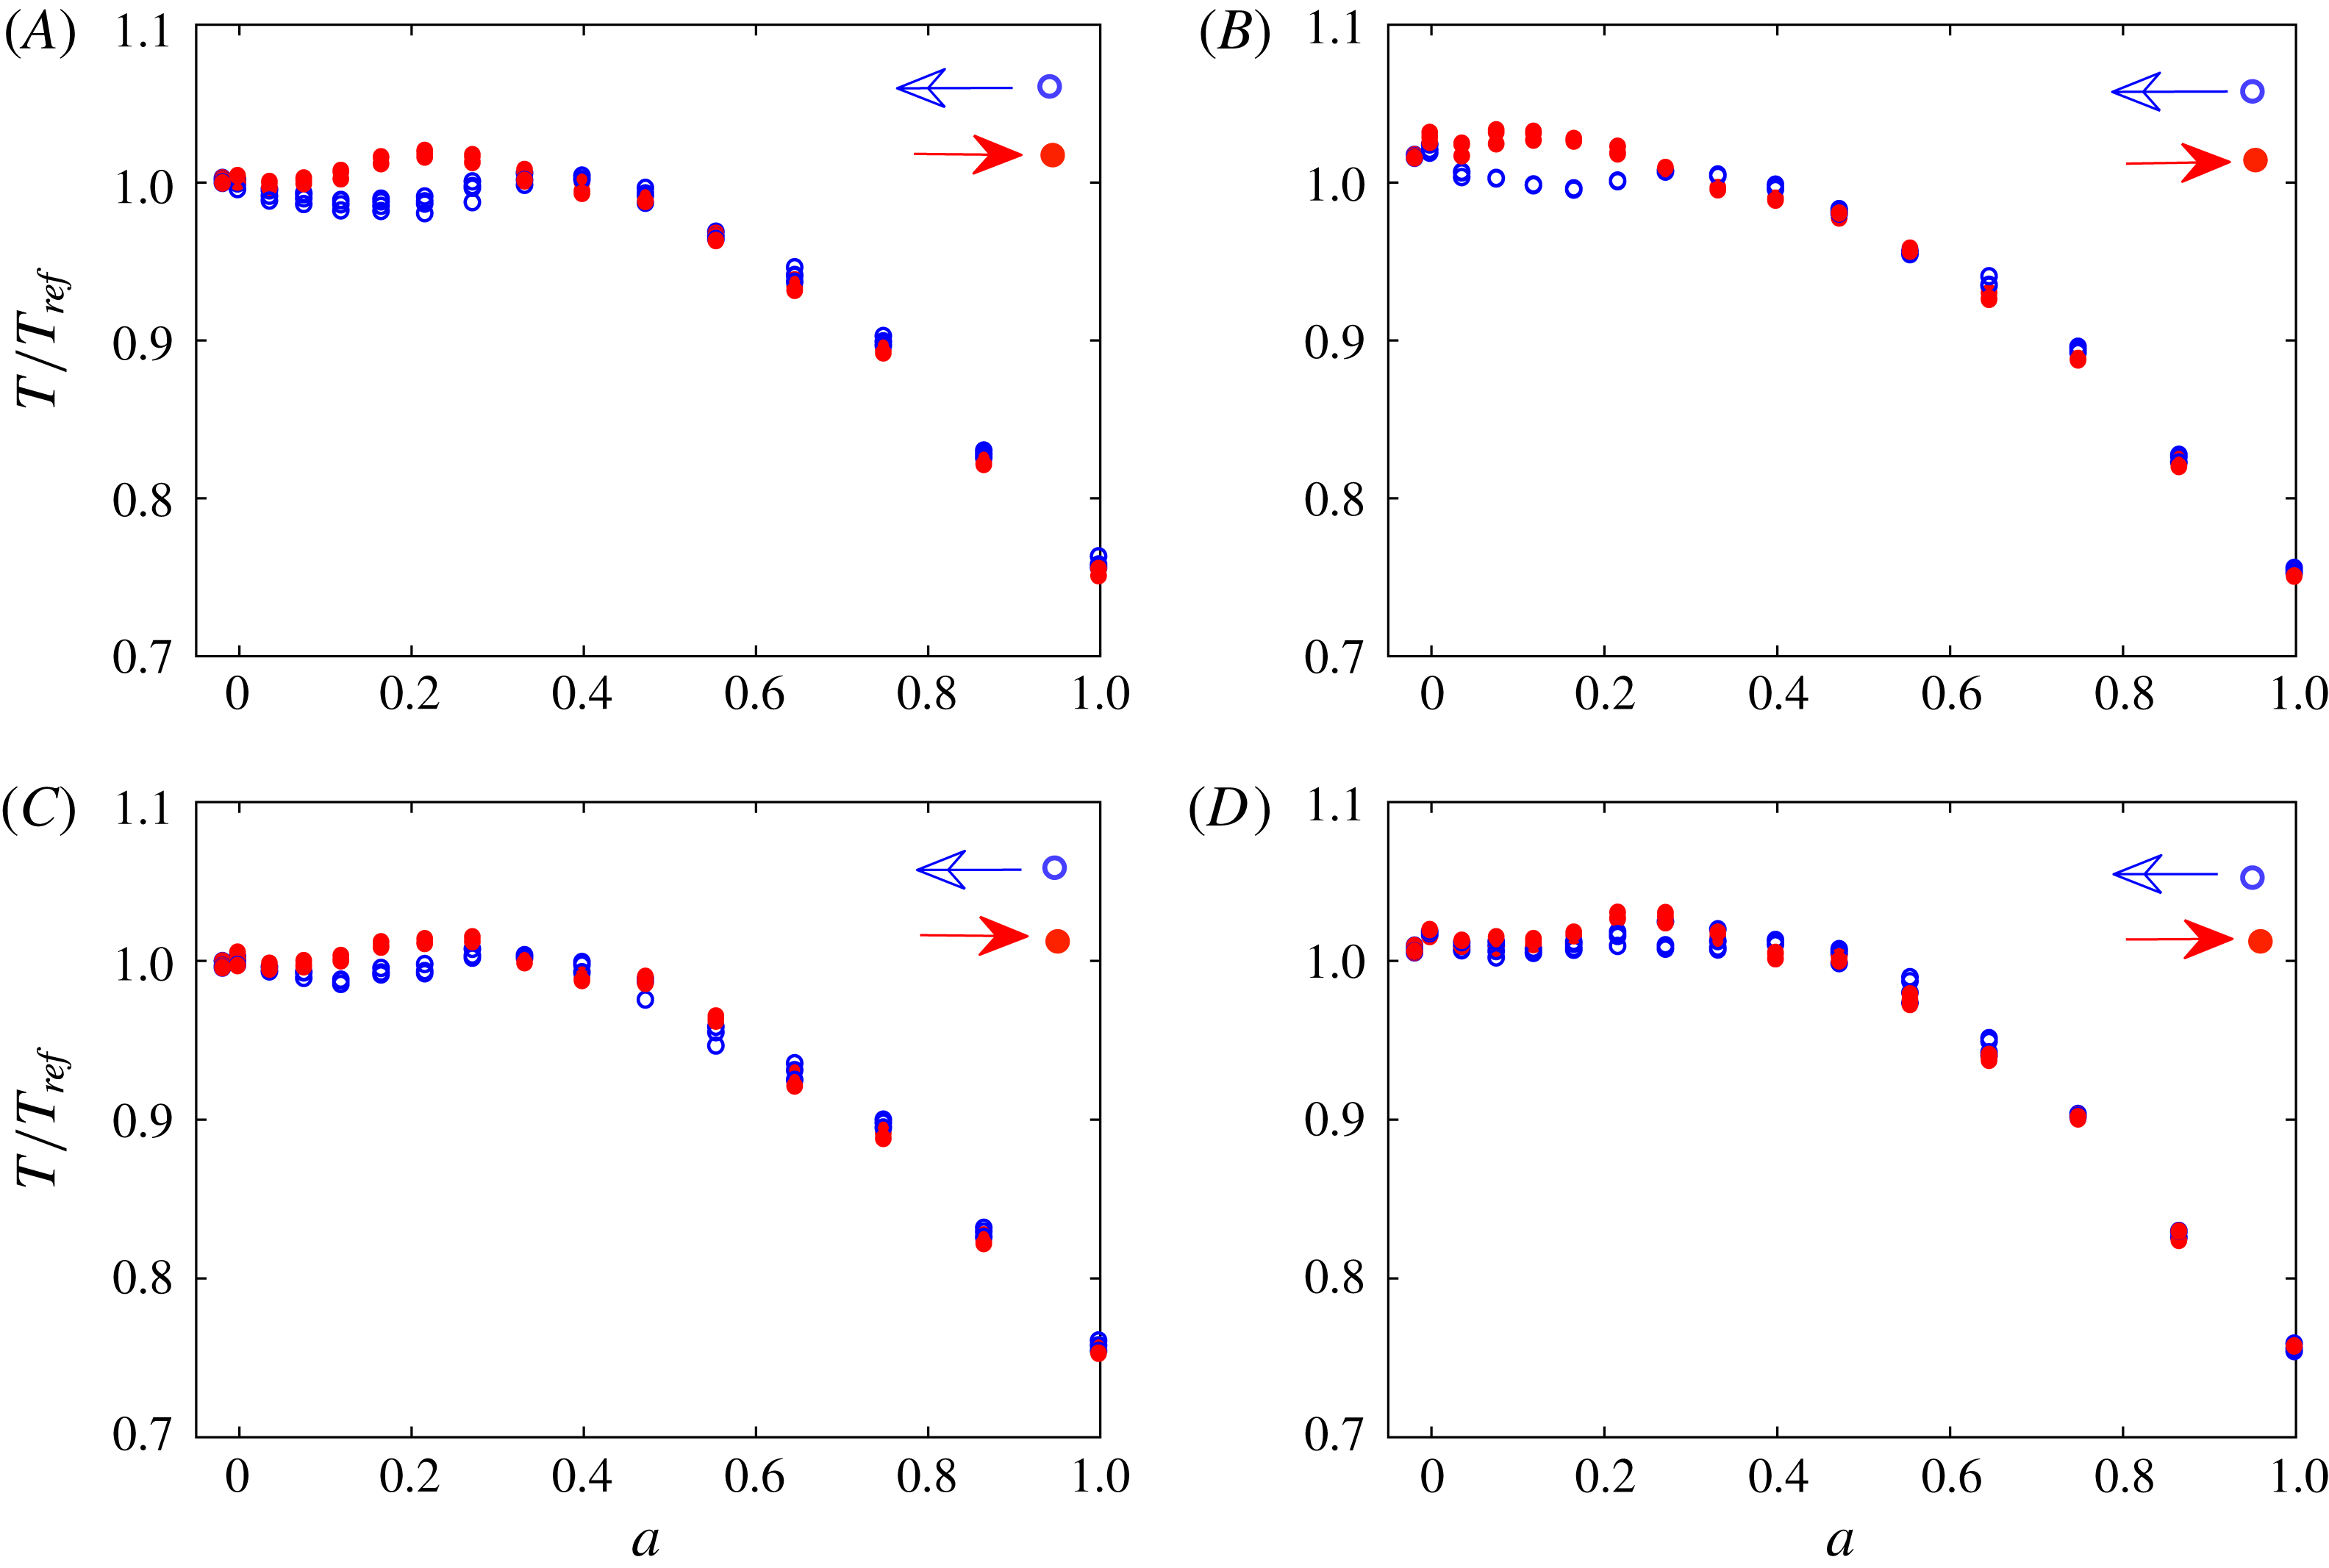
Further torque measurements were conducted with different aspect ratios at a constant shear Reynolds number of
 $\mathit{Re}_{s}=4.4\times 10^{4}$
. Different aspect ratios were achieved by changing the wetted surface of the cylinders; that is, changing the water level in the gap between the cylinders (see figure 2). The contributions of the top and bottom von Kármán gaps were determined based on the torque obtained at
 $a=1$
for all aspect ratios. Note that only in the
 $\unicode[STIX]{x1D6E4}=88$
case, the top gap correction needs to be included, while the bottom gap contribution is corrected in all cases. The total gap contribution was found to be as the same as that reported by Greidanus et al. (Reference Greidanus, Delfos and Westerweel2011), where a similar frequency ratio (
 $a=0.917$
) was considered. As can be seen in figure 6, the hysteresis in the resulting torque becomes more pronounced as the aspect ratio increases. It is thus concluded that, as the confinement of the Taylor–Couette flow in the axial direction is reduced, i.e.
 $\unicode[STIX]{x1D6E4}$
is increased, the hysteresis persists and becomes even more pronounced. This implies that the hysteresis does not result from confinement, but represents a genuine change in the turbulent flow state in the Taylor–Couette gap. Still, end wall conditions can potentially lead to significant changes in the large-scale meridional circulation, and consequently affect the shear boundary layer on the inner or outer cylinder (Avila et al.
Reference Avila, Grimes, Lopez and Marques2008; Lopez Reference Lopez2016; Lopez & Avila Reference Lopez and Avila2017). Hence, end effects and boundary conditions can affect the hysteresis, especially at low aspect ratio
 $\unicode[STIX]{x1D6E4}$
, as discussed below.
Final torque measurements were performed in two different Taylor–Couette set-ups at the same aspect ratio,
 $\unicode[STIX]{x1D6E4}=22$
, and same shear Reynolds number,
 $\mathit{Re}_{s}=5.5\times 10^{4}$
. In the shorter set-up, the fluid is bounded both from the top and bottom with end plates, whereas in the taller set-up it has a free surface at the top, therefore there is no von Kármán gap at the top. Here, a similar analysis was carried out taking into account the different torque contributions of the bottom and top gaps. The corrected and normalized results are presented in figure 7. The measurements were conducted within a temperature range of 23.9–
 $24.3\,^{\circ }\text{C}$
for case (A), and 25.5–
 $25.9\,^{\circ }\text{C}$
for case (B). The maximum temperature change for each run is
 $0.4\,^{\circ }\text{C}$
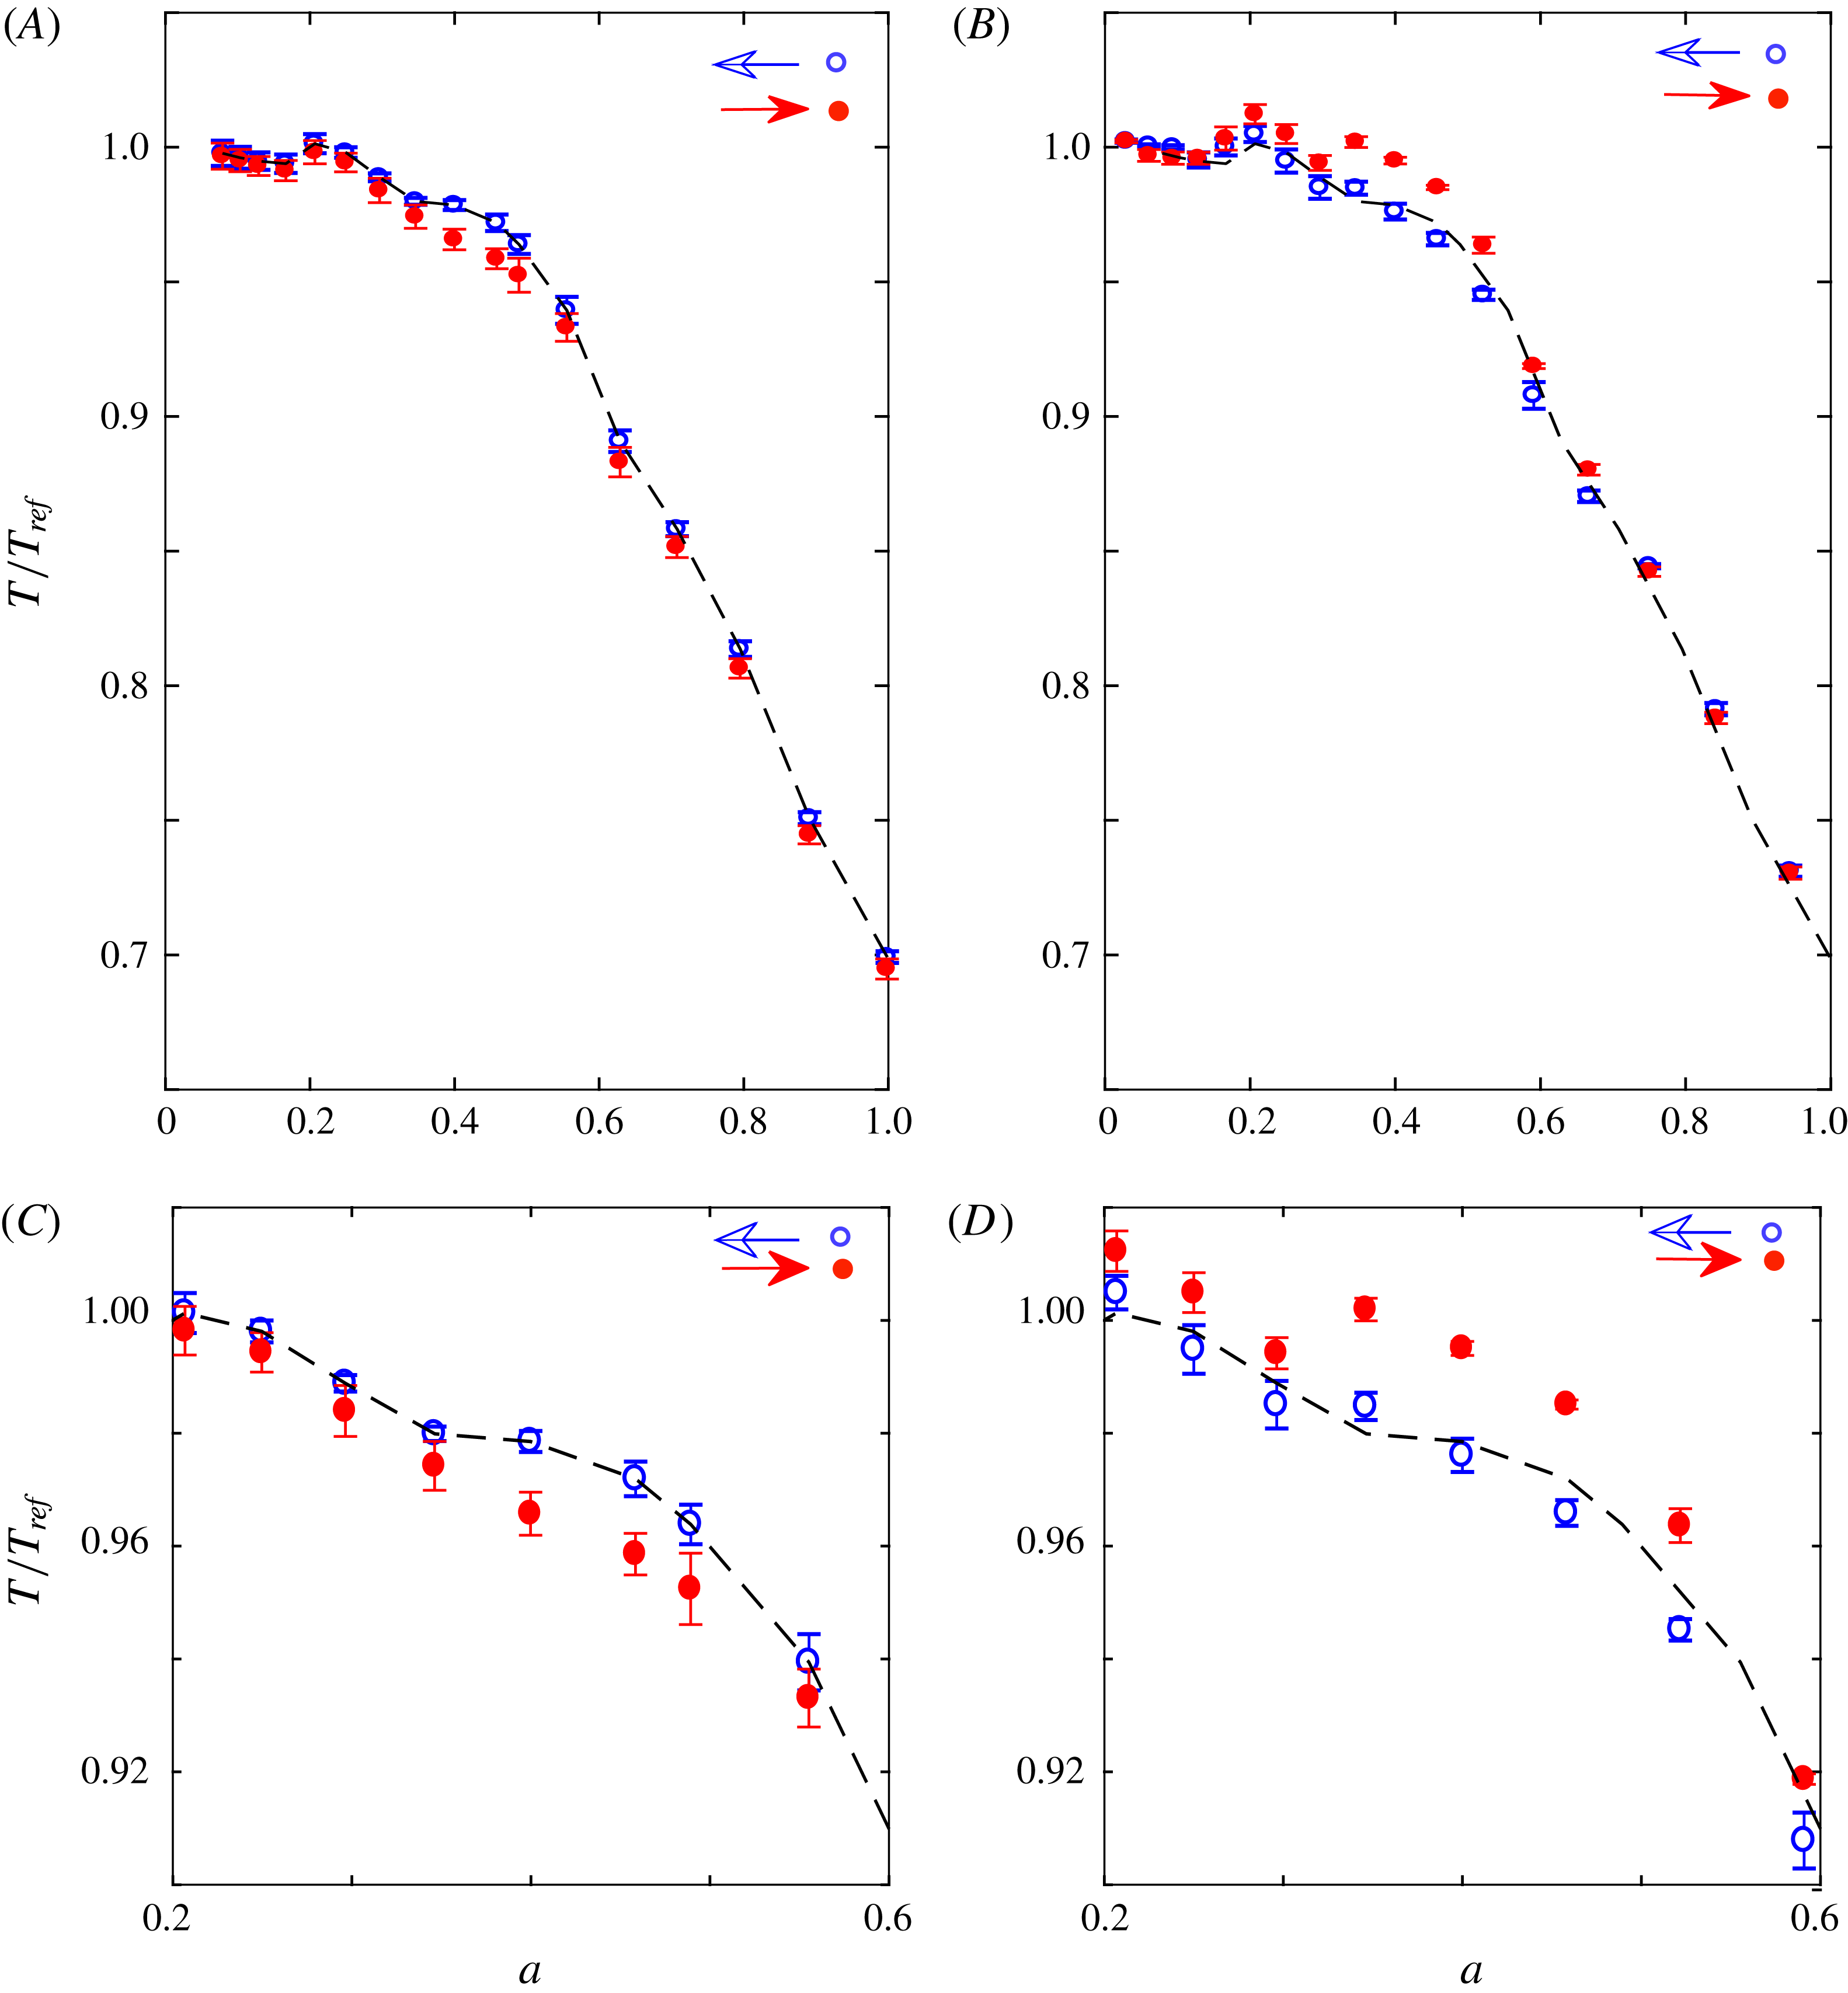
in both cases. When the two cases in figure 7 are compared, it can be clearly seen that the hysteresis behaviour is different, although the hysteresis in the torque measurements occurs at the same value,
 $a\approx 0.4$
. The hysteresis observed in the shorter set-up covers a shorter range, and inside this region the torque values are higher along the trajectory for decreasing
 $a$
, which is found to be the reverse of the behaviour observed in the taller system. The resultant torque data for both configurations are in quantitative agreement outside the hysteresis loop, which confirms the correct determination of the torque contribution from the von Kármán gaps. Hence, all differences between these two systems seem to occur due to the different boundary conditions of the set-ups.
Torque hysteresis for two different Taylor–Couette (TC) set-ups, with aspect ratio
 $\unicode[STIX]{x1D6E4}=22$
and shear Reynolds number
 $\mathit{Re}_{s}=5.5\times 10^{4}$
. (A) Shorter TC set-up with two end plates,
 $\unicode[STIX]{x1D6E4}5\text{R}5$
. (B) Tall TC set-up with bottom end plate and top free surface,
 $\unicode[STIX]{x1D6E4}4\text{R}5$
. The black dashed line in (A) is a fitted torque curve along the trajectory for decreasing
 $a$
for the
 $\unicode[STIX]{x1D6E4}5\text{R}5$
case, and it is duplicated in (B) for comparison. The error bars show the uncertainty in the repeatability. Panels (C) and (D) are the close-up views of the hysteresis regions of (A) and (B), respectively.
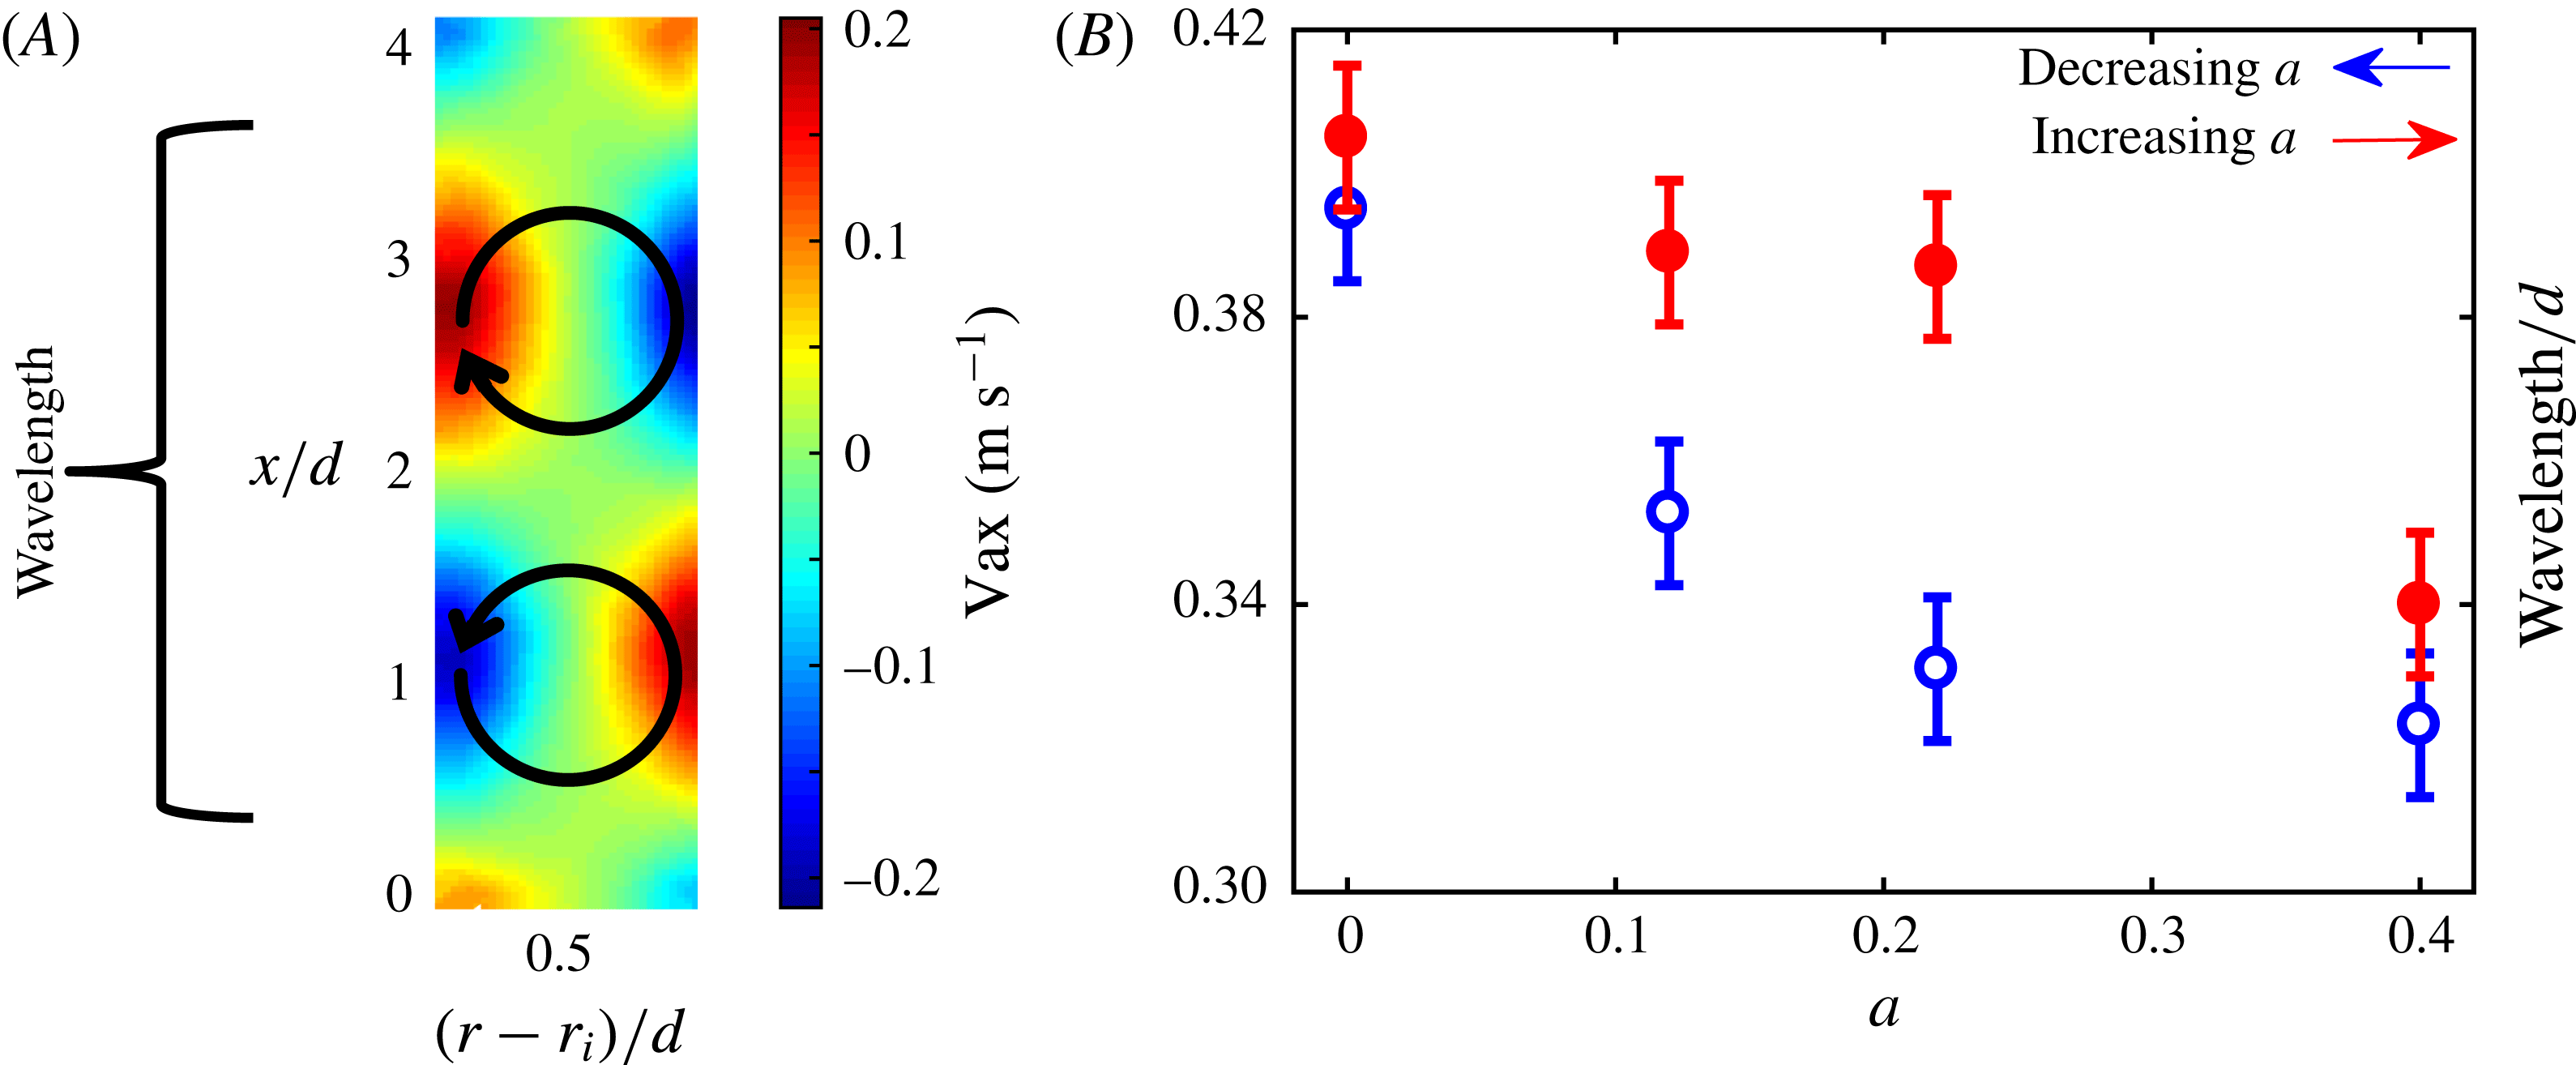
(A) Mean velocity field of the axial velocity component and (B) normalized wavelengths of the patterns together with reading errors. The black arrows schematically illustrate the rolls and flow direction.
First POD mode of the axial velocity component at: (A)
 $a=0$
, (B)
 $a=0.12$
, (C)
 $a=0.22$
and (D)
 $a=0.4$
. The top and bottom rows represent the results along the trajectory for decreasing and increasing
 $a$
, respectively.

3.1 PIV measurements
After investigating the torque hysteresis, the associated flow structures were examined using the PIV measurements together with the proper orthogonal decomposition (POD) method (Lumley Reference Lumley, Yaglom and Tatarski1967). In particular we consider the case
 $\mathit{Re}_{s}=4.4\times 10^{4}$
and
 $\unicode[STIX]{x1D6E4}=88$
,
 $\unicode[STIX]{x1D6E4}1\text{R}3$
, which is exemplary for hysteresis in the fully turbulent regime (§ 3.1). The average flow contains a large-scale periodic structure consisting of rolls (figure 8
A). The wavelength of the rolls was determined based on the mean axial velocity field at four different values for
 $a$
around the hysteresis region. Figure 8(B) shows the resultant wavelengths normalized by the gap width. Again, blue and red symbols refer to the trajectories followed in the decreasing and increasing
 $a$
direction, respectively. As is evident from figure 8(B), inside the hysteresis region the wavelengths of the structures are longer when the trajectory of the increasing
 $a$
direction is followed (for the
 $a=0.22$
,
 $a=0.12$
,
 $a=0$
cases). It should be noted that in these cases the torque is also larger along the same trajectory (figure 5
C). For the
 $a=0.4$
case, where there is no observable hysteresis in the torque data, the values of the wavelengths are the same to within the measurement uncertainty. Similar behaviour is observed in the experimental study of Huisman et al. (Reference Huisman, van der Veen, Sun and Lohse2014) (their figure 3
c–d). In addition, longer wavelengths of the structures would imply fewer rolls in the flow. Therefore, when the results of the wavelengths for the same
 $a$
values are considered together with the torque results in figure 5(C), it can be seen that the torque values are higher in the presence of fewer rolls. This result is also in agreement with the findings of Martinez-Arias et al. (Reference Martinez-Arias, Peıxınho, Crumeyrolle and Mutabazı2014) in the turbulent flow regime.
At the same conditions, the POD velocity modes were determined using the snapshot method of Sirovich (Reference Sirovich1987). The POD modes represent coherent structures, as explained by Lumley (Reference Lumley, Yaglom and Tatarski1967). Since the modes are ordered according to their energy magnitude, the most energetic POD mode is the first mode, which often reveals large coherent structures if they exist in the flow. The plots of the axial velocity component of the first mode are presented in figure 9. Note that for visualization purposes and easy comparison, the ranges of all the colour bars are kept similar except for the data of cases (B) and (C) along the trajectory for increasing
 $a$
. In figure 9(D), which corresponds to the case outside the hysteresis region, no significant change (quantitatively) in the flow structures as well as the energy content is observed. On the other hand, in the other two cases (B) and (C), which both occur within the hysteresis loop, it can be seen that the flow structures change significantly, becoming more dispersed along the trajectory for decreasing
 $a$
. Also, a significant decrease in the amplitude of the axial velocity is clearly visible when following the trajectory for increasing
 $a$
. For case (A), there are changes in the flow structures and in the magnitudes for axial velocity, but these changes are not as pronounced as for the previous two cases. Similar results were found when the radial and azimuthal velocity components of the first mode are analysed, although for brevity these results are not included in this paper. Hence, it can be concluded that large coherent structures exist in the turbulent flow at this shear Reynolds number, and with the occurrence of the hysteresis in the flow, the effect of following different trajectories at the same flow conditions shows up both quantitatively and qualitatively in the most dominant flow structures. This suggests that a genuine change in the flow dynamics and therefore different flow states occur inside the hysteresis region when different trajectories are followed.
4 Conclusions
Measurements of the torque and of the instantaneous flow fields (using PIV) were performed to study the hysteresis in the measured torque in a Taylor–Couette system with a radius ratio of 0.917 and aspect ratios of 22 to 88.
In the first part of the study, torque measurements were carried out for different shear Reynolds numbers and at different aspect ratios. The results for the torque show that the magnitude of the hysteresis decreases at higher shear Reynolds numbers, whereas it is increasing with increasing aspect ratio. This indicates that the observed hysteresis could be the result of multiple turbulent states, and not due to the confinement of the flow. On the other hand, the resultant torque measurements obtained in two different Taylor–Couette configurations at the same shear Reynolds number and same aspect ratio show different behaviour, which illustrates the relevance of different boundary conditions.
Stereoscopic-PIV measurements were performed and the axial wavelength of the structures were determined based on the mean axial velocity field. It was observed that the wavelength, and therefore the number of the rolls along the height of the Taylor Couette gap, changes inside the hysteresis region depending on the direction of the trajectory followed for the frequency ratio
 $a$
. It was found that the torque values along the trajectory for increasing
 $a$
are larger inside the hysteresis region where also the wavelengths of the structures are longer. Similarly, the axial velocity component of the first mode shows how the dominant flow structures respond to a change in the measurement direction when hysteresis occurs. With these results it can be concluded that the signature of different turbulent states observed in the behaviour of the torque is also visible in the flow structures.
Acknowledgements
The assistance of J. Ruijgrok and Ing. E. F. J. Overmars during the experiments are greatly acknowledged. The authors thank the Netherlands Foundation of Scientific Research Institutes (NWO-I) for their financial support through the programme 142 ‘Towards ultimate turbulence’ coordinated by Professor Lohse from the Physics of Fluids group at the University of Twente.


 Open access

