I. Introduction
Numerous French wine companies have had declining profitability, mainly due to a decrease in domestic consumption, which constitutes two-thirds of French wine sales. Although the population of France rose by 9.38% between 1994 and 2010,Footnote 1 wine consumption fell 18%, from 35.1 million hectoliters (hl) to 28.9 million hl, which represents a decrease in per capita consumption from 75.6 to 56.5 liters over the same period.Footnote 2 French wine companies are challenged to find new outlets in foreign markets to remedy this situation and address the decrease in profit induced by this crisis. Some authors suggest that French winemakers should move from a product orientation to a market orientationFootnote 3 and invest in their marketing. French wines are historically leaders in foreign markets but are currently threatened by more market-oriented competition from New World wine producers.
Achieving a competitive advantage that can lead to better export performance requires numerous resources (Dhanaraj and Beamish, Reference Dhanaraj and Beamish2003), including intangible investments. In France, intangibles have helped to develop the positive reputation traditionally associated with the country's wines. However, this advantage has weakened due to the rising reputation of New World wines. Intangible investments and image development are supported at two levels: first, they are supported at the regional level by collective organizations called “interprofessions,” which undertake several actions to promote wine and companies of a given wine region in France and abroad; second, they are supported at the company level through marketing or research and development (R&D).
Research has focused on the benefits of intangible capital on the competitive position of companies in both foreign and domestic markets. Intangible expenses or assets,Footnote 4 such as a skilled workforce, patents and know-how, software, strong customer relationships, branding, and unique organizational designs and processes, represent a growing proportion of company investments.Footnote 5 In general, intangibles can be characterized as having two dimensions: intangible capital and intangible effort. Whereas intangible capital is the stock of capital that a company possesses, intangible effort represents the intangible expenses spent each year to maintain and develop intangible capital.
Previous research has analyzed the impact of intangible assets on company performance (Hand and Lev, Reference Hand and Lev2004; Henning et al., Reference Henning, Lewis and Shaw2000). Some studies have found that this impact depends on the industry in question (Bobillo et al., Reference Bobillo, Rodriguez-Sanz and Tejerina-Gaite2006; Lev and Zarowin, Reference Lev and Zarowin1998; Villalonga, Reference Villalonga2004). In agriculture, Alene (Reference Alene2010) and Thirtle et al. (Reference Thirtle, Piesse and Schimmelpfenning2008) show that R&D expenditure has a positive effect on firm productivity growth. A recent study on the French wine industry shows the favorable effect of intangible expenses on company performance from the impact on company profit and risk (Viviani, Reference Viviani2009). Intangibles appear to develop export activities and to improve company performance. The aim of the current paper is to extend these results by considering the relationship between intangible effort, exports, and performance (in terms of company profit and risk) in French wine companies.
In particular, our goal is to determine whether the impact of intangibles on company financial performance differs according to the level of its export development (measured by export intensity). This will help to shed light on the relevance of intangible effort on export development within the context of a goal to improve performance.
The remainder of this paper is organized as follows. We first explore the potentially moderatingFootnote 6 role of exports on the intangibles–performance relationship. Section 2 provides a review of the theoretical foundations and past empirical evidence on both the positive impact of intangibility on exports and the benefits of exports on company financial performance. As an introduction to the empirical part of this study investigating the link between intangibility, export intensity, and company performance, Section 3 describes the data and several measurement issues (intangibility and performance). The different methodologies and results of the empirical study are provided in Section 4, and Section 5 concludes the paper.
II. Literature Review
A. Intangibles and Exports
The impact of intangibles on exports is explored in the literature dealing with export performance and its determinants. Theoretical developments on the intangibles–exports relationship have called on the resource-based view and firm-specific asset theory (for recent literature reviews on this topic, see Ruppenthal and Bausch, Reference Ruppenthal and Bausch2009; Sousa et al., Reference Sousa, Martínez-López and Coelho2008; Wheeler et al., Reference Wheeler, Ibeh and Dimitratos2008).
The positive impact of intangibles on exports also has been empirically tested, and this impact has been validated most of the time (Braunerhjelm, Reference Braunerhjelm1996; Kotha et al., Reference Kotha, Rindova and Rothaermel2001; López Rodríguez and García Rodríguez, Reference López Rodríguez and García Rodríguez2005; Rialp and Rialp, Reference Rialp and Rialp2006). Some studies have also dealt with a particular intangible resource, such as innovation, that appears to be a favorable determinant of export intensity in small and medium-size enterprises (SME), even for those in non–R&D-intensive industries (Dhanaraj and Beamish, Reference Dhanaraj and Beamish2003; Lefebvre et al., Reference Lefebvre, Lefebvre and Bourgault1998; Sterlacchini, Reference Sterlacchini1999). This finding could be applied, at least partially, to French wine companies, most of which are small and medium-size family businesses. In the wine industry, innovation has been recognized as contributing to a sustainable competitive advantageFootnote 7 (Remaud, Reference Remaud2006; Wood and Kaplan, Reference Wood and Kaplan2005) for exporters. In addition, through brand equity, reputation can favor the introduction of new products in international markets (Aaker, Reference Aaker1996), but the effect on the performance of an export venture market may not be direct (Morgan et al., Reference Morgan, Vorhies and Schlegelmilch2006).
Considering that intangible assets are among the determinants and resources influencing exports and that the impact of some intangible assets on exports has already been verified in the wine industry and in SMEs, we offer a first hypothesis:
Hypothesis 1: Intangibles bring about an increase in export intensity in French wine companies.
B. Exports and Company Performance
1. Exports and company profit
Numerous studies confirm the favorable impact of exports on company profits. Park et al. (Reference Park, Yang, Shi and Jiang2010) found that export growth in Chinese firms leads to higher firm productivity and other performance measures, such as sales and return on assets. The same idea is developed by Han (Reference Hahn2005, 54), who justifies the favorable role of exports on productivity by the fact that it constitutes a “vehicle for diffusion of disembodied technology or knowledge across countries and, hence, improves productivity.” This relationship has been confirmed in additional studies (Delios and Beamish, Reference Delios and Beamish1999; Dhanaraj and Beamish, Reference Dhanaraj and Beamish2003; Van Biesebroeck, Reference Van Biesebroeck2003). Weasthead et al. (Reference Weasthead, Wright and Ucbasabaran2001; following McDougall and Oviatt, Reference McDougall and Oviatt1996) study company performance according to past export status of SMEs and confirm that being an exporter one year influences the operating profit several years later.
This relationship can be theoretically justified by the profit maximization principle (Edmunds and Khoury, 1976). Indeed, according to financial theory, a company should undertake an activity or an investment only if it leads to profit maximization. According to this principle and different empirical validations, exports and internationalization can favorably affect firm profits. Presuming that intangibles and exports are positively related, we offer a second hypothesis:
Hypothesis 2: Intangibles increase the profitability of French wine companies particularly when their export intensity is high.
2. Exports and Company Risk
The impact of exports on company risk is thus enhanced by the use of resources that generate export development, including intangibles. The theoretical motivations for the exports–risk relationship rely on the diversification gains from exports. According to Hirsch and Lev (Reference Hirsch and Lev1971), foreign activities reduce the risk of sales for multinational firms. Along the same lines, Rugman (Reference Rugman1976) shows that exports stabilize company profits by reducing risk. These relationships can be explained by the diversification effect highlighted by the portfolio theory (Markowitz Reference Markowitz1952, Reference Markowitz1959), which posits that a firm can be considered a portfolio of activities in which the combination of different activities (domestic and export) is selected to reduce portfolio risk while maximizing profits. This approach is supported by Miller and Pras (Reference Miller and Pras1980), showing that multinational diversification stabilizes company profits and reduces risk. Numerous other papers study the diversification effect of international activities at the firm level (Caves, Reference Caves1982; Cavusgil and Naor, Reference Cavusgil and Naor1987; Kim et al., Reference Kim, Hwang and Burgers1989, Reference Kim, Hwang and Burgers1993; Ogbuehi and Longfellow, Reference Ogbuehi and Longfellow1994; Porter, Reference Porter1990; Richardson and Rindal, Reference Richardson and Rindal1995; Salomon and Shaver, Reference Salomon and Shaver2005; Shrader et al., Reference Shrader, Oviatt and McDougall2000). Lu and Beamish (Reference Lu and Beamish2004) explain that the benefits of geographical diversification on company performance can come from economies of scale and, as evoked by Silvente (Reference Silvente2005), economies of scope and profit volatility reduction.
However, this positive effect can be moderated by the risks induced by the export activity itself. Due to the increased uncertainty characterizing export activity (Katz et al., Reference Katz, Rosenberg and Zilberfarb1985), risk is considered higher in the export context. Exports also generate risk, owing to exchange risk and political risk, or even increase it, in the case of nonpayment (Leonidou, Reference Leonidou2004; St-Pierre, Reference St-Pierre2003). This can counterbalance the favorable effect that results from diversification. Another factor that contributes to higher risk in export activities is the fact that export-related investments are themselves considered riskier than domestic investments (Tannous and Sarkar, Reference Tannous and Sarkar1993). It is significant that some of these investments include intangible assets, such as R&D, advertising, or even company reputation, notably in the wine industry.
Considering that these export-specific risks can be reduced by hedging and supporting the diversification effect of exports on company global risk, we offer a third hypothesis:
Hypothesis 3: Intangibles reduce the risk for French wine companies, particularly when their export intensity is high.
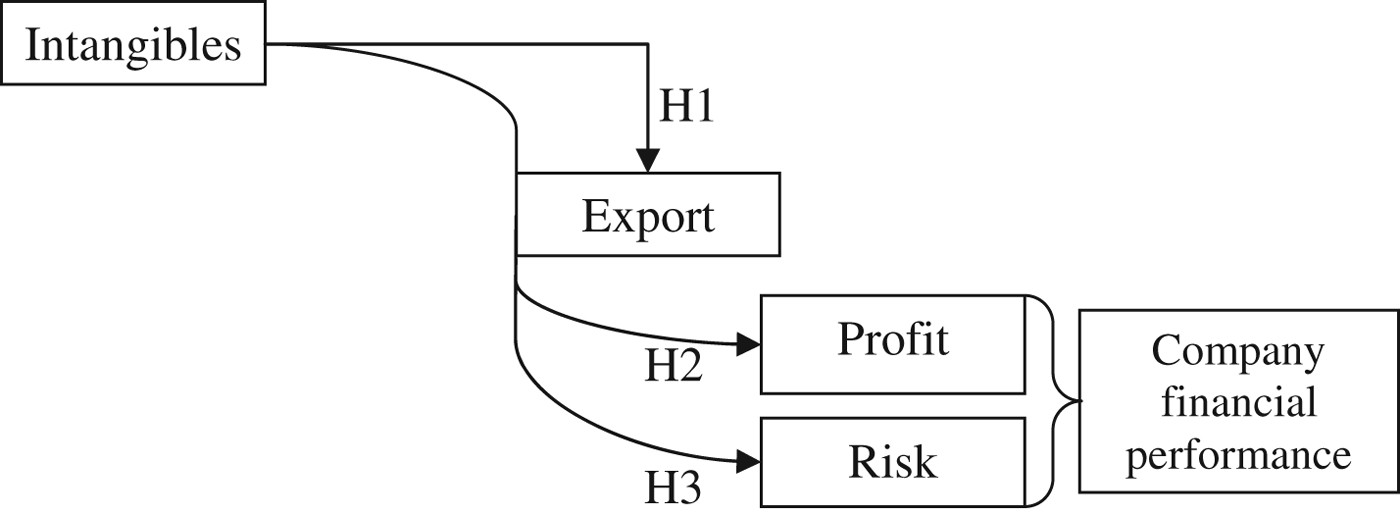
Figure 1 summarizes our research design and the three hypotheses tested in this study. French wine companies make an intangible effort to develop their export intensity (H1). Through the export activity, this effort can increase profit (H2) and reduce risk (H3) and, consequently, improve company financial performance.
Intangibles Hypotheses and Research Design

III. Measurement Issues, Data, and Variables
A. Intangible Expenses and Company Financial Performance Measures: A Review
1. Intangible Expense Measures
Currently, there is no standardized way to measure a company's intangible capital. Since there is no generally accepted definition of intangibles, many measurement methodsFootnote 8 exist, all with different purposes and, often, a lack of comparability. Two approaches are used and often combined (Hunter et al., Reference Hunter, Webster and Wyatt2005): cost-based measurements and valuation concepts. In an attempt to reflect the management's intent in deciding to allocate expenditures to intangible investment, we choose the first approach as a way to measure the intangible effort of the company and its consequences on performance. For reasons of comparability, reproducibility, and interpretability, we concentrate on monetary cost measurements based on the breakdown of accounting expenses.Footnote 9 Unlike authors of studies on large companies, we cannot use direct accounting expenses or assets for two main reasons. First, intangible expenses and assets recorded in financial statements are not considered completely reliable by researchers in accounting (for a review, see Wyatt, Reference Wyatt2008) because intangible resources are composed largely of items that do not appear in financial statements (Carmeli, Reference Carmeli2001). Second, data such as “R&D expenses,” “goodwill,” or “intangible assets other than goodwill” (patents, trademarks, copyrights, licenses, etc.), available in financial statements, are not significant for SMEs in the wine sector.
Even with this narrowly defined approach (accounting expenses), there is no generally accepted method available to measure intangibles and no standardized financial or accounting method to calculate them. Hence, the proposed distinction between intangible and tangible expenses is affected by data availability and depends on the particularities of the wine sector.Footnote 10 In the context of the French wine industry, where R&D expenses are low, intangible expenses consist mainly of promotion and marketing expenses. Because we want to measure the expenses aimed at maintaining or developing intangible capital, we also take into account tangible expenses with an intangible objective.
2. Company Financial Performance Measures
Because our sample is composed of non-listed SMEs, we use only book values to measure company performance. We use earnings before interest, taxes, depreciation, and amortization (EBITDA) as a measure of profit to compare companies with different legal structures and objectives (corporations and cooperatives) and remove the impact of various financial policies. This profit measure is divided by total sales (EBITDA margin) to provide a standardized measure of profit margin. In this ratio, EBITDA is adjusted according to the currency exchange rate to take into account the impact of foreign currency transactions on company profit and risk (EBITDA-CA). We investigate the impact of tangible and intangible expenditures in 2005 on the profit margin in 2006 because we assume that intangible investments, like all investments, have an impact on a company's future performance. Profit risk is measured by the standard deviation of the profit margin time series for each company in 2005 (the period 2004–2007).
B. Sample and Data Construction
Data were extracted from the database derived from “Enquête entreprises aval filière vin—agro. M—Viniflhor, CCVF, EGVF” (Survey of companies in the wine industry, 2006) carried out by the School of Agronomy of Montpellier (SupAgro) in 2006 and covering the period 2003–2005. Data were collected from a questionnaire completed by 101 cooperatives and 95 corporations whose activities included one or more stages of wine production and marketing. The questionnaire was divided into eight sections: description of the company and its human resources, relationship with suppliers, products, market and distribution channels, governance, strategy, financial decisions, and innovation.Footnote 11 There is no direct information on intangible efforts and expenses in the questionnaire, therefore, we selected and extracted information from available data. These declarative data were completed by financial statements extracted from the Diane databaseFootnote 12 available for only 189 of the 196 companies, including 95 corporations and 94 cooperatives.
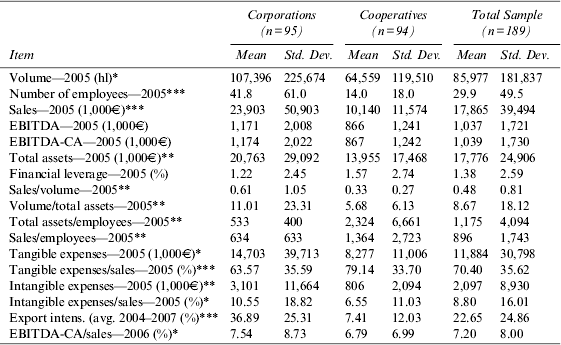
In our sample (Table 1), representative of the French wine industry, companies are relatively small, regardless of size measurement criterion (number of employees, sales, and total assets), but with a high dispersion. The sample consists mainly of SMEs with fewer than 50 employees (79% for corporations and 92% for cooperatives). Corporations are bigger than cooperatives if size is assessed by volume, number of employees, sales, or even total assets.
Sample Descriptive Statistics
Volume (hl) appears in the survey “Entreprises aval filière vin—Agro.M—Viniflhor, CCVF, EGVF.” Operational expense decomposition into tangible and intangible is described in Appendix 1. The other data were extracted from the Diane database. Regarding performance measure, EBITDA is adjusted with foreign exchange gain and loss to take into account the impact of foreign currency transactions on company profit and risk (EBITDA-CA). Financial leverage is financial debt to equity ratio. Mean significant differences between corporations and cooperatives: * significant at 10%; ** significant at 5%; *** significant at 1%.
Ratios calculated in Table 1 show that the apparent price of wine (sales/volume) is higher for corporations than for cooperatives. Corporations are also more labor intensive and less capital intensive than cooperatives (see volume/total assets, total assets/employees, and sales/employees). The production functions (capital and labor combination) of corporations and cooperatives seem to be quite different. Cooperatives do not produce grapes but sell the cheapest wine, requiring relatively a smaller workforce. In addition, corporations exhibit less financial leverage (financial debt/equity).
Regardless of the company's legal status, intangible expenses are smaller than tangible ones, illustrating the fact that French wine companies have not yet entered the “intangible economy.” Corporations in the sample have relatively more intangible expenses and less tangible ones than do cooperatives. Corporations also have a higher EBITDA margin ratio (EBITDA-CA/sales) than cooperatives. Standard deviations are systematically greater than the mean values of the various variables and ratios, indicating the heterogeneity of the two subsamples.
IV. Methodology and Results
A. Intangibles and Exports
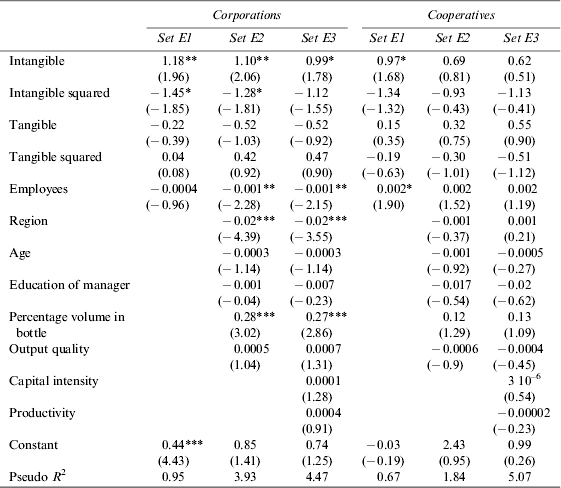
To assess the impact of intangible effort in French wine companies on their export intensity, we implement two different approaches that are suitable, given the nature of the dependent variable. In the first approach, the dependent variable is export intensity. The Tobit model is typically used in the literature to take into account the fact that the dependent variable has a left-censored distribution (with either zero or a positive value). In the second approach, we transform the dependent variable into a discrete variable: Expid3 refers to three classes: experimental exporters (Expid3=0 if export intensity is below 10%), active exporters (Expid3=1 if export intensity is between 10% and 40%), and committed exporters (Expid3=2 if export intensity is above 40%).Footnote 13 The ordered logistic regression is used in these cases with robust standard error to cope with heteroskedasticity. As the two approaches provide very similar results, we choose to present detailed results only for the Tobit model in Table 2a.
Impact of Tangible and Intangible Expenses on Export Intensity
Censored Model: Tobit Regression Dependent Variable: Expi (Export Intensity=Export Sales/Total Sales)
Significance at the 10%, 5%, and 1% level is indicated by *, **, and ***, respectively; robust z-statistics in parentheses.
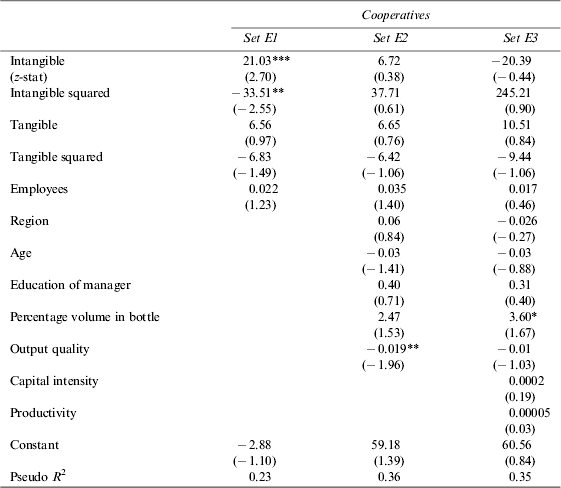
Impact of Tangible and Intangible Expenses on Export Intensity
Binary Model: Logistic Regression Dependent Variable: Expid2 (Expid2=0 if Expi <0, 1 if Expi ⩾0.1; Expi: Export Intensity)
Significance at the 10%, 5%, and 1% level is indicated by *, **, and ***, respectively; robust z-statistics in parentheses.
Three different sets of variables are tested using these two approaches:
- Set E1: only tangible and intangible expenses are introduced as independent variables and the number of employees to control for size,
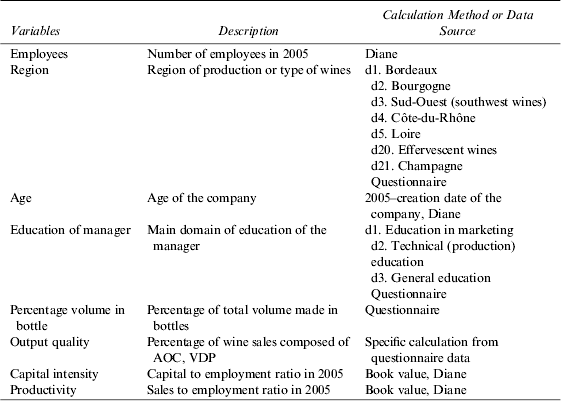
- Set E2: independent variables of set E1 plus variables that proxy for the level of intangible investment (region, age, education of manager, percentage volume in bottle, output quality),
- Set E3: independent variables of set E2 plus variables that control for capital intensity and productivity.
Appendix 1 describes the expense breakdown between tangible and intangible expenses (set E1), and Appendix 2 describes the calculation and data source of the other independent variables included in sets E2 and E3.
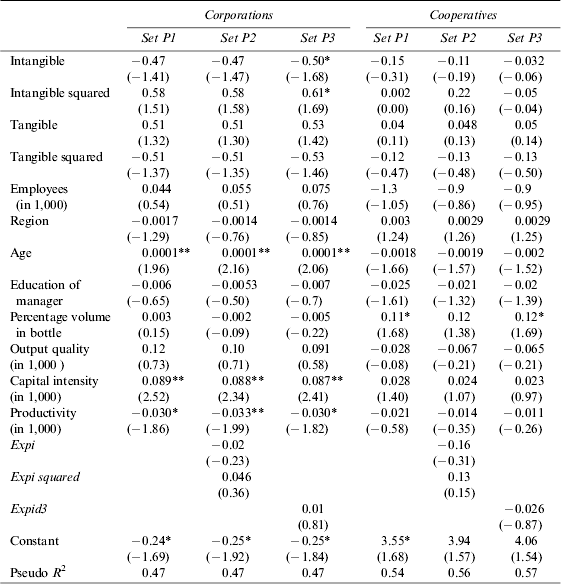
For corporations, intangible expenses have a positive and significant effect on export intensity, but the effect diminishes with the level of intangibles expressed by the negative coefficient of the squared intangible (Table 2a). This positive relationship confirms the results from previous empirical studies (Braunerhjelm, Reference Braunerhjelm1996; Kotha et al., Reference Kotha, Rindova and Rothaermel2001; López Rodríguez and García Rodríguez, Reference López Rodríguez and García Rodríguez2005; Rialp and Rialp, Reference Rialp and Rialp2006) and, thus, the resource-based view approach. By comparison, the analysis shows no significant impact of tangible expenses on exports. Regarding other variables, the results indicate a significant regional effect. It remains to be investigated because some producing regions are competing more successfully on the international market than others by virtue of reputation and strong exporting marketing effort. Compared to bulk sales, bottle sales require more intangible expenses toward exporter wine merchants. Finally, size (employees) has a negative and significant effect on export intensity. This result differs from the results in the U.S. wine industry (Castaldi et al., Reference Castaldi, Sengupta and Silverman2003), which reveals only a slightly positive and significant relationship in American wine firms. Output quality also seems to have a positive effect on export intensity. (This effect is significant at the level of 10% in the ordered logistic regression model). Therefore, for corporations, a positive relationship between intangible effort and export intensity (H1) seems to exist, but this link weakens when the effort is greater. However, other variables, including geographic location (region), selling in bottle, wine quality, and company size, also influence export intensity.
Most cooperatives have low export intensity. Therefore, we added a specific variable for these companies, Expid2, referring to two classes: experimental and active exporters (Expid2=0 if export intensity is below 10%, and Expid2=1 if export intensity is above 10%). Results of the logistic regression with Expid2 as the dependent variable are presented in Table 2b.
Cooperatives present very few significant coefficients (Tables 2a and 2b). We observe a positive but diminishing effect of intangible expenses (Set E1). However, this effect disappears or is even reversed when control variables are added (Sets E2 and E3). Along the same lines, we observe a positive relationship between company size (employees) and export intensity (Table 2a –Set E1), but this relationship is no longer significant when control variables are added (Sets E2 and E3). Quality seems to negatively affect export intensity when we perform a logistic regression model (Table 2b –Set E2). These two relationships are the opposite of those observed in corporations. We also notice a positive relationship between bottle sales and export intensity (Table 2b –Set E3), as in corporations, even if the relationship is less strong in cooperatives. In cooperatives, the relationship between intangible effort and export intensity (H1) is not clear, and no robust relationship seems to emerge from our analyses. This result may be related to the low level of export intensity in cooperatives (Table 1).
B. Intangibles, Exports, and Profit
To test H2, we investigate whether the impact of intangible expenses on company profit depends on export intensity (Table 3a). Profit is measured as the EBITDA margin ratio in 2006 (EBITDA-CA/sales). In this first approach, we test three sets of independent variables to analyze profit margin (Table 3a):
- The first set (P1) includes independent variables presented and used in section 4.1 (intangible, intangible squared, tangibles, tangibles squared, employees, region, age, education of manager, percentage volume in bottle, output quality, capital intensity, and productivity).
- In the second set (P2), we add the variable export intensity and squared export intensity.
- In the third set (P3), exports are represented through the discrete variable Expid3.
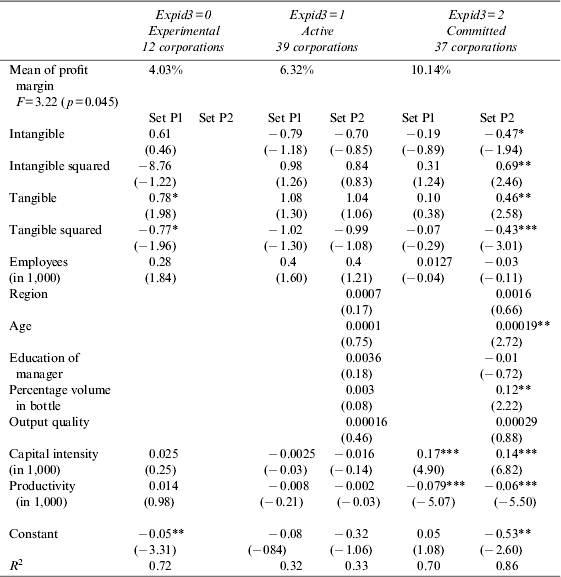
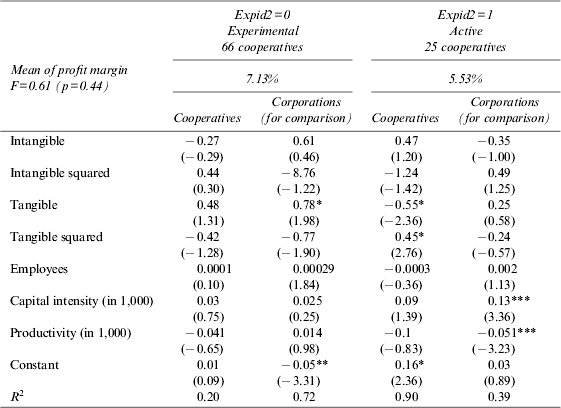
In addition, we examine whether profit margin was higher in companies with higher export intensity. This second approach is used to identify differences in the relationship between intangible effort and profit according to the degree of internationalization of sales. Results of this test are presented at the top of Tables 3b and 3c. In this case, corporations have been divided into three groups according to the level of export intensity: experimental exporters, active exporters, and committed exporters. As in Weasthead et al. (Reference Weasthead, Wright and Ucbasabaran2001), we note that profit margin mean is significantly higher in corporations with higher export intensity (mean of profit margin, top of Table 3b). However, this causal relationship has proven to be difficult to verify (Bernard and Jensen, Reference Bernard and Jensen1999). Cooperatives have been divided into two groups instead of three because very few cooperatives are committed exporters. We observe a reversed effect, that is, profit margin seems to be higher in experimental exporter cooperatives, but the difference is not significant (mean of profit margin, top of Table 3c).
Impact of Tangible, Intangible Expenses, and Exports on Profit Margin
Regression Model: OLS Dependent Variable: Profit Margin=EBITDA-CA/Sales in 2006 (EBITDA-CA is EBITDA Adjusted for Foreign Exchange Gain and Loss)
Expi: export intensity=Export sales/total sales. Expid3=0 if Expi <0.1, 1 if 0.1 < Expi <0.4, 2 if Expi >0.4.
Significance at the 10%, 5%, and 1% level is indicated by *, **, and ***, respectively; robust t-statistics in parentheses.
Impact of Tangible and Intangible Expenses on Profit Margin in Corporations
Regression Model: OLS Dependent Variable: Profit Margin=EBITDA-CA/Sales in 2006 (EBITDA-CA is EBITDA Adjusted with Foreign Exchange Gain and Loss) Sample: Corporations
Expid3: Expid3=0 if Expi <0.1, 1 if 0.1 < Expi <0.4, 2 if Expi >0.4; Expi: export intensity.
Set P2 has not been tested for experimental exporter corporations because this category is composed of only 12 corporations. Significance at the 10%, 5%, and 1% level is indicated by *, **, and ***, respectively; robust t-statistics in parentheses.
Impact of Tangible and Intangible Expenses on Profit Margin in Cooperatives
Regression Model: OLS Dependent Variable: Profit Margin=EBITDA-CA/Sales in 2006 (EBITDA-CA is EBITDA Adjusted with Foreign Exchange Gain and Loss) Sample: Cooperatives (and Corporation for comparison)
Expid2: Expid2=0 if Expi <0.1, 1 if Expi >0.1; Expi: export intensity. Significance at the 10%, 5%, and 1% level is indicated by *, **, and ***, respectively; robust t-statistics in parentheses.
For corporations, regressions carried out following the first approach (Table 3a) do not reveal export intensity variables (Expi, Expi squared, and Expid3) as significant explanatory variables with respect to profit margin (coefficients are not significant). Moreover, including export intensity (Expi) and squared export intensity does not modify intangible-related coefficients and their significance. However, including Expid3 modifies these coefficients and makes them significant. Therefore, it seems that taking into account the degree of internationalization (experimental, active, or committed exporter) validates the relationship between intangible effort and profit margin.
We focus on this element in the second approach (Table 3b). We observe that intangible expenses have different impacts depending on export intensity. For experimental exporter companies, a low level of intangible expenses has a positive effect on performance; this effect is reduced and becomes negative (nonsignificant) as intangible expenses increase. This phenomenon is reversed when export intensity increases (intangibles have a negative effect on profit margin; this effect decreases and becomes positive when intangibles expenses are high). Coefficients are nonsignificant for active exporter corporations and become significant for committed corporations. It seems that intangible expenses may play a role in profit margin determination when they are very high and when they are undertaken by committed exporter corporations.
On the contrary, tangible expenses seem to have the same influence whatever the export intensity: a positive impact, which decreases and then becomes negative (Tables 3a and 3b). These results seem to validate H2, showing that the relationship between intangible effort and profit is influenced by export intensity. Nevertheless, all our results do not confirm a strong validation of this hypothesis.
We also observe positive and significant effects of company age and capital intensity on profit margin and a negative and significant effect on productivity for corporations (Table 3a). These effects appear most significant for committed corporations (export intensity above 40%) when the percentage of wine sold in bottle also influences profit margins (Table 3b).
In our sample, committed exporter corporations are those with the highest profit margins. This margin is higher when the corporation is long established, sells its wine directly in bottle, is highly capitalist, and has a low productivity—features that correspond to corporations that produce high-quality wine.
As with corporations, regressions carried out for cooperatives according to the first approach (Table 3a) do not consider export intensity variables as determinants of profit margin (coefficients are not significant). Moreover, integrating these variables does not modify the sign and the significance of intangible variable coefficients (by comparing Sets P2 and P3 with Set P1). Regarding the second approach (Table 3c), in experimental exporter cooperatives, intangible effort negatively affects profit margin. This impact weakens and becomes positive when the effort is strong (Table 3c). The phenomenon is reversed for active exporter cooperatives; we observe a positive relationship between intangible effort and profit margin, but this relationship weakens and becomes negative when the effort is strong. As Table 3c illustrates, these relationships are the opposite of those observed in corporations and are not significant in cooperatives.
Tangible expenses seem to have a significant effect on profit margin, but this effect weakens and becomes positive when the weight of these expenses increases (Table 3c). We also notice that the ratio of bottle to bulk sales positively influences profit margin (Table 3a).
For corporations, intangible expenses have a negative impact on profit whatever the export level. However, for committed exporters only, high levels of intangible expenses have a positive effect on profitability. For cooperatives, results are not significant and do not enable us to validate H2.
C. Intangibles, Exports, and Risk
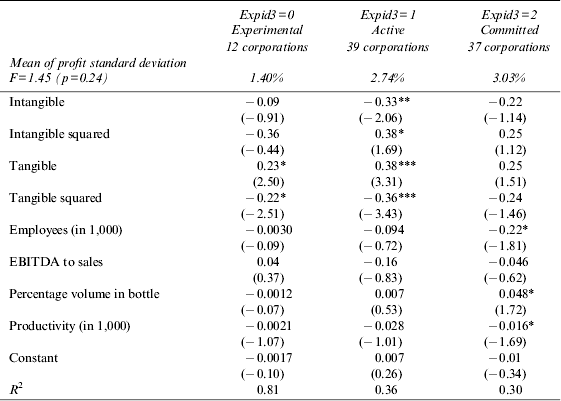
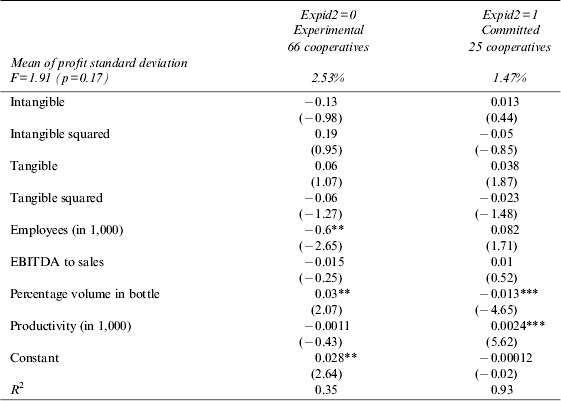
The last set of analyses tests the hypothesis regarding intangible expenses, exports, and company risk (H3). The methodology is similar to the previous one. The only difference is the choice of the variables. Risk is assessed through EBITDA margin ratio standard deviation during the period 2004–2007. In the first analysis, we assess whether risk differed according to export intensity. For corporations, and contrary to previous studies (Hirsch and Lev, Reference Hirsch and Lev1971; Shaver, Reference Shaver2006), the effect of exports on risk is positive and nonsignificant (mean of profit standard deviation, top of Table 4b). This implies that the diversification effect is dominated by the higher intrinsic risk of export activities on total risk. Indeed, export activity has long been considered a riskier activity because of the increased uncertainty characterizing its environment (Katz et al., Reference Katz, Rosenberg and Zilberfarb1985). In cooperatives, risk is lower in active exporter cooperatives but not significantly (mean of profit standard deviation, top of Table 4c). The effect of diversification may mitigate the intrinsic risk.
Impact of Tangible and Intangible Expenses on Company Risk
Regression Model: OLS Dependent Variable: Profit Risk=Standard Deviation of (EBITDA-CA/Sales 2006) during the Period 2004–2007 (EBITDA-CA is EBITDA Adjusted with Foreign Exchange Gain and Loss)
Expi: export intensity=Export sales/Total sales. Expid3=0 if Expi <0.1, 1 if 0.1 < Expi <0.4, 2 if Expi >0.4; significance at the 10%, 5%, and 1% level is indicated by *, **, and ***, respectively; robust t-statistics in parentheses.
Impact of Tangible and Intangible Expenses on Profit Risk in Corporations
Regression Model: OLS Dependent Variable: Profit Risk=Standard Deviation of (EBITDA-CA/Sales 2006) During the Period 2004–2007 (EBITDA-CA is EBITDA Adjusted with Foreign Exchange Gain and Loss) Sample: Corporations
Expid3: Expid3=0 if Expi <0.1, 1 if 0.1 < Expi <0.4, 2 if Expi >0.4 – Expi: export intensity; significance at the 10%, 5%, and 1% level is indicated by *, **, ***, respectively; robust t-statistics in parentheses.
Impact of Tangible and Intangible Expenses on Profit Risk in Cooperatives
Regression Model: OLS Dependent Variable: Profit Risk=Standard Deviation of (EBITDA-CA/Sales 2006) During the Period 2004–2007 (EBITDA-CA is EBITDA Adjusted with Foreign Exchange Gain and Loss) Sample: Cooperatives
Expid2: Expid2=0 if Expi <0.1, 1 if Expi >0.1; Expi: export intensity; significance at the 10%, 5%, and 1% level is indicated by *, **, and ***, respectively; robust t-statistics in parentheses.
We then apply two approaches based on regression models. The first approach consists of testing three sets of independent variables to analyze risk (Table 4a):
- The first set (R1) is composed of many of the independent variables introduced in paragraph 4.1 (intangible, intangible squared, tangibles, tangibles squared, employees, profit margin, percent volume in bottle, and productivity).
- In the second set (R2), we add export intensity and squared export intensity.
- In the third set (R3), exports are represented through a discrete variable called Expid3, which take the following values: 0 (experimental exporter), 1 (active exporter), and 2 (committed exporter).
This first approach aims to assess the impact of intangible effort and exports on risk. In the second approach, we study the relationship between intangible expenses and profit margin in the five categories defined above according to the export intensity of the company: three categories for corporations and two categories for cooperatives (Tables 4b and 4c).
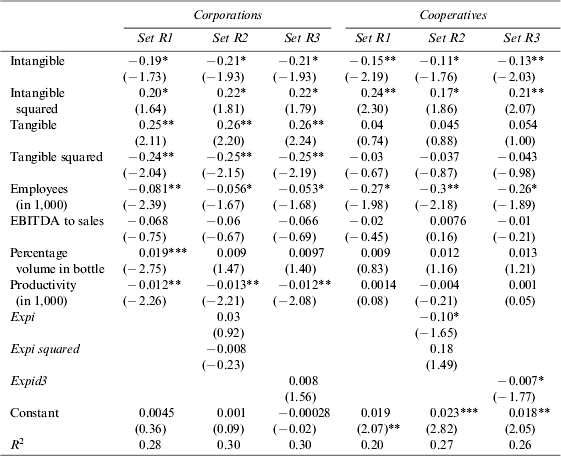
In corporations, intangible effort reduces risk except when it is high (positive coefficient of intangibles squared), in which case it increases risk (Table 4a). We observe a reversed relationship between tangible expenses and risk (tangible expenses increase risk at low level and reduce risk at high level). This relationship does not seem to be influenced by export intensity because coefficients related to tangible and intangible variables do not change when export-related variables (Expi, Expi squared, and Expid3) are introduced (sets R2 and R3). In this regression, coefficients related to export-related variables are not significant. The influence of exports on the intangibles–risk relationship is also analyzed through segmentation of corporations into three categories according to export intensity (Table 4b). However, we do not find clear differences among these categories. The link between tangible/intangible sharing out and company risk is significant only in corporations that export between 10% and 40% of their wine. Therefore, H3 (intangibles reduce the risk of French wine companies when export intensity is high) does not seem to be validated in corporations.
In terms of cooperatives, the results are quite similar. Intangible effort reduces risk, except when this effort is too high (positive coefficient of intangible squared). In this case, it increases risk (Table 4a). We also observe a reverse relationship for tangible expenses, but this relationship is not significant. As in the results for corporations, this relationship is not affected by export intensity because the introduction of export-related variables does not affect coefficients related to intangible and tangible expenses or their significance (sets R2 and R3). However, we do observe a different relationship between intangibles and risk for cooperatives according to their export status (experimental or committed exporter cooperatives, Table 4c). In experimental cooperatives, intangible effort reduces risk except when it is high; in this case, it increases risk. On the contrary, in committed exporter cooperatives, intangible effort increases risk if it is low. Then, when intangible effort increases, it reduces risk. Unfortunately, this relationship is never significant regardless of the export status. Therefore, as with corporations, H3 is not validated for cooperatives.
V. Conclusion
The aim of this paper is to investigate the relevance of the intangible investment strategy in the context of the French wine industry. Intangibles could have not only a direct impact on company performance but also an indirect one by promoting exports. For this reason, we found it relevant to gather data on intangible expenses, exports, and company performance in the same study and to test their relationships in corporations and cooperatives from the French wine industry.
We first concentrate on the relationship between intangible assets and exports before introducing company profit and risk, that is, company financial performance. Statistical analyses confirm that intangibles have a positive impact on export intensity. However, this positive impact decreases as export intensity increases, meaning that intangibles have a lower impact on exports in companies with high export intensity. This impact is nonsignificant for cooperatives.
By introducing company profit and company risk in the previous relationship, the objective is to learn whether intangibles have a positive impact on profit and a negative one on risk, that is, a positive impact on company financial performance depending on the level of export development.
First, we observe that exports have no significant effect on company profit in our sample. Regarding risk, we observe a significant negative effect only for cooperatives. However, exports do influence the intangibles–profit or risk relationship when internationalization stages are considered. In corporations, intangibles and company profit are positively related only when exports are highly developed and for a high level of intangible expenses. In these companies, intangibles seem to have a negative effect on risk (not always statistically significant). For cooperatives, we do not find any statistically significant effect of intangibles on profit and risk depending on internationalization stages probably due to the low number of exporters in this category.
According to our results, it seems that two distinct behaviors emerge from the two subsamples. These behaviors are reflected in the relationship between intangible expenses, exports, and performance. In light of these results, we infer that corporations may use a rather “offensive” approach in exporting. Indeed, it seems that they use exports to increase profit while accepting higher risk. This is partly due to the fact that export activity is a riskier activity than domestic activity. Intangible expenditures have a double function: they ensure a profitable geographical diversification strategy, and they are a risk management tool aimed at limiting risk generated by export activities. In contrast, cooperatives may use a more “defensive” approach in exporting. Even if exports enable risk diversification, we suppose that it may be carried out without making sufficient efforts in intangible assets, although they are necessary to make exports profitable. Another possibility is that efforts on export-oriented intangible assets are executed, but these investments are not mature enough to lead to yield performance improvements.
Our analysis is subject to several limitations, and our results should be regarded as preliminary. First, our sample is quite small, and subsamples (by export intensity) are even smaller. Second, our measure of intangible effort is rather imprecise because of the difficulty in measuring intangible expenses using accounting data. Third, our measure of profit is probably not well suited to quantify the financial performance of cooperatives. The governance and financial aims of cooperatives are different from those of corporations. Suppliers are also co-owners of the cooperatives. Therefore, we cannot apply traditional financial measures of performance to this specific category of organizations.
Our sample is composed only of SMEs that may face resource constraints. Because these constraints may affect the optimal level of investment in intangibles, our results may be biased. Future analyses should examine the impact of financial constraints on intangible investments.
In the French wine industry, intangible efforts are made at the company level and, significantly, at a collective level (by “interprofessions”). Future research should investigate the effect of intangible efforts on company exports and performance at the industry level.
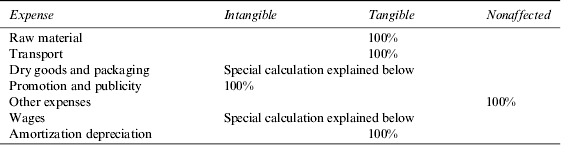
Expense Break-up Between Tangible and Intangible
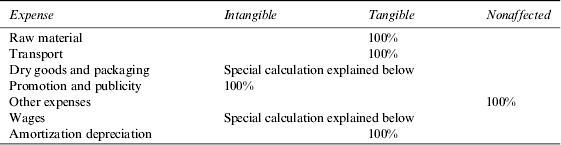
Intangible and tangible expenditures are calculated through book expenses breakdown. This breakdown is detailed in Table A1.1.
Expenses Breakdown
Dry Goods
We suppose that, beyond a minimum cost, packaging expenses can be considered a way to promote the product and so are intangible. For every company, we know the breakdown of the wine sold in bulk, bottle, and other containers (bag in box, etc.) for 2005. We first verify that conditioning expenses (CE) can be explained by the volume of wine in bottles (B). We run two OLS and obtain the following results:
 $$CE_i = \mathop{0.0671B_i} \limits_{({\rm 0}{\rm. 0027}^c )} \quad R^2 = 0.8126\hskip55 $$
 $$CE_i = \mathop{0.0675B_i} \limits_{({\rm 0}{\rm. 0037}^c )}- \mathop {0.0018OP_i} \limits_{({\rm 0}{\rm. 0105}^{ns} )} \quad R^2 = 0.8041$$
OP i: bag in box and other packaging expenses.
Considering the two coefficients of determination and the negative nonsignificant coefficient for bag in box, we achieve quite a good determination of conditioning expenses by volume of wine in bottle only (highly significant coefficient for bottles).
We then calculate the volume in bottles for 2003 and 2004, supposing a constant proportion with sales. For every company, we calculate the ratio of conditioning expenses to volume in bottles. Following the data in Bonnet et al. (Reference Bonnet, Caboulet and Guisset2007) , it appears that the minimum cost of dry goods and packaging is €0.4307/liter for a series of 10,000 bottles. If we take the first quartile of the ratio of conditioning expenses to volume as the basic conditioning expense, we obtain: €0.3425/l in 2005, €0.3406/l in 2004, and €0.3391/l in 2003. These values are slightly lower than those given in Bonnet et al. (Reference Bonnet, Caboulet and Guisset2007), but seem consistent because we suppose that these series are, in general, higher than the one in Bonnet et al. Conditioning expenses above this value are considered intangible.
Wages
Wages are divided into tangible and intangible expenses using the status of employees (given in the questionnaire) in seven different functions.
First, we try to estimate the wage mean by function using the following OLS model:
 $$W_j =\sum\limits_{i = 1}^7 {w_{_i} e_{ij}} + \varepsilon _j $
W j: total wages of company j,
e ij: number of persons of the company j employed in function i,
w i: estimated wage for function i,
ε j: residual for company j.
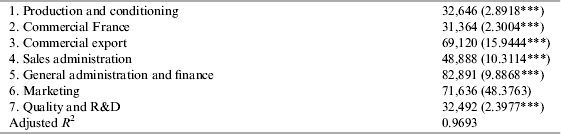
In a first step, we implement an OLS regression using all the data in the sample. By comparing results obtained with those in national statistics (INSEE, 2007), we observe that our estimated wages are not consistent with the national data, especially for the marketing function. We try various different models and find that the best model is the one presented below in which three outliers are removed. Even if the coefficient for marketing function is not significant, we obtain results in line with the national data. Results of this second OLS regression are in Table A1.2.
Estimated Wages for the Different Functions (€/year)
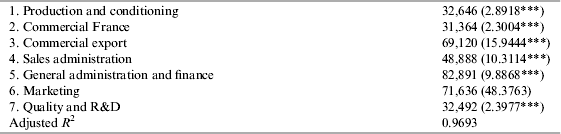
Only wages of functions 6 and 7 are considered intangible.
Description of Other Independent Variables