I. INTRODUCTION
Material response and microstructure evolution in deformation-based manufacturing processes are underpinned by the interplay of the geometric and tribological boundary conditions. Heterogeneity in the mechanics, process instability, and failures also result from this interplay. However, delineation of these linkages is complicated by the material response during fabrication that exhibits hitherto unknown phenomena in the presence of complex geometrical confinement. Reference Basu, Zhiyu and Saldana1 This is particularly an issue for the control of miniaturized deformation-based manufacturing processes. In this regard, direct measurement of the mechanics in the deformation zone, as a function of the process parameters, tribological conditions, microstructure, and material parameters, is useful for identifying the process–microstructure mappings. The thermomechanics of the deformation zone emerges as a function of aforementioned mappings and determines the process outcomes and properties. Empirical [e.g., using digital image correlation (DIC) Reference Basu and Shankar2 ], analytical [e.g., using slip line fields (SLFs) Reference Chakrabarty3 ], and numerical (e.g., using finite element methods Reference Yen, Jain and Altan4 ) techniques exist for characterizing deformation zone geometries, which are then used to rationalize the evolution of the microstructure and ultimately the product outcomes. However, additional complexities emerge when the scale of deformation becomes smaller, such as in microforming platforms. Reference Geiger, Kleiner, Eckstein, Tiesler and Engel5 For example, when the forming processes are miniaturized to the sub-mm scale, wherein the size of the deformation zone is comparable to the scale of the microstructure, unexpected process anomalies and failures are observed. Reference Fu and Chan6 Analogous microstructural response anomalies are observed in machining-based processes when material removal occurs at the micrometer-scales. Reference Basu and Shankar2,Reference Basu and Shankar7 Resolving these anomalies and enabling process and microstructure control in these configurations require a direct measurement of the deformation field and its role in determining the microstructure evolution. Here, we examine the influences of the process length-scale, process parameters, and initial microstructure on mechanical/microstructural response during indirect extrusion (IE) of two materials, Al and Pb. Our choice of the deformation framework is also motivated by the fact that miniaturized IE is utilized for manufacturing a variety of metallic machine components such as micropins, microscrews, microgears, microbolts, etc. Reference Vollertsen, Niehoff and Hu8,Reference Hosford and Caddell9 This allows the insights from this work to be utilized in characterizing individually utilized process schema.
II. EXPERIMENTAL METHODS
A. Materials and processing
IE experiments were performed on commercially pure Pb and commercially pure Al. Pb shows little work hardening and approximates the elastic-perfectly plastic behavior common in stress-saturated materials such as those featuring ultrafine grained or nanostructured microstructures. Within such a prototype, experiments with Pb offer a simplified baseline that focuses on the modification of the deformation zone parameters with shrinking scale of the process. Furthermore, Pb with face centered cubic crystal structure at room temperature can also encapsulate deformation behavior of this family of polycrystalline materials at its approximately 0.5 homologous temperatures where thermally activated processes inhibit dislocation accumulation and motivate dynamic recovery and recrystallization. Reference Rollett, Humphreys, Rohrer and Hatherly10,Reference Kumar, Schwartz and King11 The second suites of experiments are performed on commercially pure Al (AA1100) at room temperature, which is a prototypical work hardening material. Insights from this study are therefore relatable to an array of polycrystalline work hardening materials during manufacturing operations.
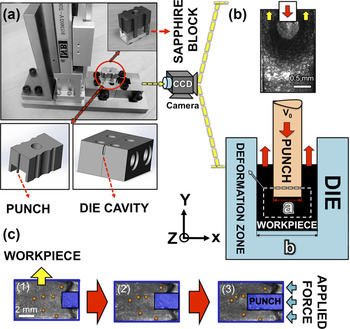
Two different setups, one suited for nonwork hardening response in Pb and the other for work hardening response in Al were fabricated. In both cases, in situ characterization of flow fields, depicted in Fig. 1(a), was performed using DIC, described subsequently. The setup for Pb was also designed to provide control over the deformation geometry that was varied to facilitate delineation of the effect of length scales. The second set of experiments on AA1100 was designed to study the effect of initial microstructure variables on the mechanics of deformation and hence used a fixed deformation geometry and speed during IE while altering initial grain sizes (GSs).
(a) IE setup showing die components including die cavity, punch and sapphire block. The sample is placed in the die cavity. IE is performed when the punch is advanced into the sample. Sapphire block provides constraint ensuing plane-strain conditions while allowing for imaging of the deformation. This setup allows in situ observation of deformation using a high-speed camera. (b) Schematic of IE process and its parameters, top inset shows the material flow observed through the transparent sapphire block, and (c) Sequence of images captures using charge-coupled device (CCD) camera, motion of asperities is observed during deformation of Pb.

Fig. 1(a) illustrates components of the assembled IE for Al. Here, the direction of punch was set antiparallel to Y [Fig. 1(b)]. A transparent sapphire window was installed facing the deformation zone to provide its unobstructed view during IE. Components of the IE die were fabricated with D2 tool steel that was heat treated and subsequently tempered before assembly. Sapphire is almost transparent to visible light and features adequate strength and wear resistance for such experiments as evidenced by its previous use in other severe plastic deformation (SPD)-based experimental frameworks. Reference Moradi, Basu and Shankar12 During IE, the plunger was actuated with a servo driven linear actuator: model BG 2602A 200H-A5C from Nippon Bearing (Ojiya, Japan), comprising a 5-phase stepper motor. A miniature load cell: model TR3D-B-4K from Michigan Scientific (Charlevoix, Michigan) was installed to characterize extrusion forces.
IE of Pb was performed in dies with different channel widths ranging from 1.5 mm through 5 mm and two punch widths: 1 and 2 mm. The experimental matrix is shown in Table I. The initial length of the samples was set at 10 mm and the depth of punch advance into the die was limited to 5 mm across all experimental conditions on Pb. The punch velocities (V 0) were set at 2, 5, 10, 15, and 20 mm/s in this suite of experiments. IE of Al was performed in a die featuring a width of 1.5 mm and length of 5 mm, using a punch with width 0.5 mm. The punch velocity was set at 5 mm/s, and travel was limited to 2.5 mm. Samples for IE were created from Pb and AA1100 sheets, these featuring thickness = 2 and 1 mm, respectively. Pb samples were tested in as-received states, whereas Al samples were tested in as-received (Alas-received) and two heat treated conditions. Heat treatment of Al was done at 823 K for 3 h (Al3h) and 20 h (Alfull-anneal) to create microstructures featuring various initial GSs. The average GSs were ∼30, 70, and 150 μm for Alas-received, Al3h, and Alfull-anneal, respectively. Pb samples were found to have the GS of ∼100 μm.
Deformation parameters measured for IE of Pb for a punch velocity of 2 mm/s. a is punch width and b is die width [Fig. 1(b)]. F
Y
is the measured force by load cell in Y direction [Fig. 1(b)]. k is extrusion constant [Eq. (4)]. h
SF and θSF are thickness and angle of deformation zone II [Fig. 2(b)] based on strain rate field measurements [Figs. 2(c) and 3]. h
RF and θRF are thickness and angles of deformation zone II based on rotation field measurements (Figs. 5 and 6).
 $\dot \gamma$
and εeff are average strain rate and effective strain in zone II measured by DIC.

Pre- and post deformation characterization of microstructure for Al samples was performed using electron backscattered diffraction (EBSD) based orientation imaging microscopy (OIM) using a Philips XL-30 scanning electron microscope (FEI Company, Hillsboro, Oregon) equipped with a Hikari EBSD detector (EDAX, Mahwah, New Jersey). Al samples were mounted in epoxy and mechanically polished down to 0.04 μm finish using colloidal silica for the final step. Accelerating voltage used to perform OIM was 20 kV and a step size ranging from 0.05 to 1 μm was used. This was supplemented with optical metallography, performed by etching postdeformation samples with 10% hydrofluoric acid (HF) solution for 20 s.
B. Characterization of the deformation field
In situ characterization of the deformation zone was performed using DIC on image acquired using a charged coupled device camera: model PCO1200 HS (PCO AG, Kelheim, Germany), operating in high-resolution mode. The region of interest was illuminated using a Cole Parmer fiber optic illuminator (Cole Palmer, Vernon Hills, Illinois): catalog 41723, directed obliquely with respect to the sapphire window whereby flooding of the CCD was avoided and adequate brightness and contrast were achieved. In this manner, a recording frame rate of ∼118 fps was obtained. Illumination resulted in a concentration of asperities or light/dark spots on the surface. Motion of these asperities was tracked through the sequence of consecutive image pairs, originally acquired using the PCO high-speed camera. This was done using cross correlation algorithms whereby velocity gradient tensor fields due to deformation imposed during IE were generated. The spatial resolution of the tracking system was ∼5 μm/pixel. Subsequently, mechanics of deformation comprising strain, strain rate, and rotation fields prevalent during IE were extracted from the velocity gradient tensor fields using postprocessing subroutines.
Fig. 1(c) shows a time-sequence of images of the material flow through the deformation zone captured by CCD camera during IE of Pb. Motion of some asperities is identified in this figure for illustration. DIC was performed on sets of images in which the flow of material had reached a steady state. Here, steady state refers to an approximate stationary flow of material during forming process, which is independent of time. Reference Zienkiewicz and Godbole13 In this regard, image sequences closely preceding the moment of quick stop were used.
Evolution of crystallographic textures in different regions of Al samples produced by IE was simulated using visco-plastic self consistent (VPSC) framework.
Reference Wang, Wu, Tomé and Huang14
The framework treats each grain as a visco-plastic inclusion in a homogeneous effective medium. The properties of this medium are updated self consistently during simulation of deformation and are constituted by the mean response of all grains combined.
Reference Wang, Wu, Tomé and Huang14
A FORTRAN implementation of this model was used which uses a discretized orientation distribution function (ODF) in the form of a collection of orientations as input. The model treats each orientation in this discretized ODF as a grain. Initial textures characterized by discrete orientation Euler angles and weights as well as active slip systems
 $\left( {111} \right)\left\langle {110} \right\rangle$
and their hardening parameters and macroscopic boundary conditions were input to the VPSC framework. Our discretized ODFs comprised 1000 random orientations signifying lack of preferred orientations in the pre-deformed samples. The deformation history of IE was obtained from DIC of Al samples. These histories were in the form of velocity gradient tensor fields imposed during IE along the respective pathlines followed by material points within the respective deformation zones. The Voce material model for Al was used. To calibrate the VPSC model, deformation histories of material processed by IE in different regions of deformation zone were obtained from empirical measurements using DIC. These were used to simulate evolution of crystallographic textures. Subsequently, simulated results were compared with empirical counterparts delineated from quantitative OIM data analysis, and parameters of the VPSC model were updated until a good match between simulated and experimental data was acquired.
III. RESULTS AND DISCUSSION
A. IE of Pb
Characterization of deformation zone geometry was performed in Pb by studying the key elements of deformation mechanics: strain, strain rate, and rotation fields. This was done with the overarching goal of modeling deformation behavior of materials with near lack of work hardening capacity, as a function of length scale and process parameters. In this regard, it is noted that material behavior in Pb conforms to assumptions made in SLF theory, viz. lack of work hardening, heat generation, and thermal gradients during deformation. Reference Hosford and Caddell9,Reference Rees15 In this section, we present results of the in situ measurements to describe scaling effects on the extension/spread of plastic deformation zone.
1. Strain rate fields
Strain rate fields were characterized by quantifying displacement fields on surface of the workpiece undergoing IE. The strain rate tensor field
 $\eubar \underline D^{\rm{P}}$
was thereafter calculated from this by numerical spatiotemporal differentiation using:
 $$\eubar \underline D^{\rm{P}} = \left[ {\matrix{ {{{{\partial ^2}u} \over {\partial x\partial t}}} & {{1 \mathord{\left/ {\vphantom {1 2}} \right. \kern-\nulldelimiterspace} 2}\left( {{{{\partial ^2}u} \over {\partial y\partial t}} + {{{\partial ^2}v} \over {\partial x\partial t}}} \right)} \cr {{1 \mathord{\left/ {\vphantom {1 2}} \right. \kern-\nulldelimiterspace} 2}\left( {{{{\partial ^2}u} \over {\partial y\partial t}} + {{{\partial ^2}v} \over {\partial x\partial t}}} \right)} & {{{{\partial ^2}v} \over {\partial y\partial t}}} \cr} } \right]\quad ,$$
where u and v are displacements in the X and Y directions (Fig. 1) respectively and t is time between consecutive images in the sequence. The effective strain rate field was calculated using:
 $${\dot \varepsilon ^{\rm{P}}} = \sqrt {{2 \over 3}{\eubar \underline D^{\rm{P}}}:{\eubar \underline D^{\rm{P}}}\quad ,}$$
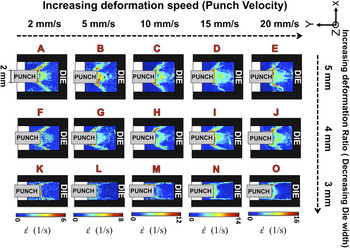
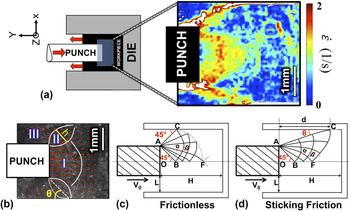
Here, “:” refers to the inner product. Fig. 2 shows the strain rate fields characterized using this method during IE of Pb in dies with 5, 4, and 3 mm specimen widths and a 2 mm punch width at different deformation speeds. A heterogeneous deformation zone ensures during IE, the morphology of which is shown in higher magnification in Fig. 3(a), this corresponding to the extrusion ratio Reference Hosford and Caddell16 :
 $$R = {{{A_0}} \mathord{\left/ {\vphantom {{{A_0}} {{A_{\rm{f}}}}}} \right. \kern-\nulldelimiterspace} {{A_{\rm{f}}}}} = 2\quad ,$$
Here, A 0 and A f are the initial and final cross sectional areas of the workpiece, respectively. A threshold strain rate 2 s−1 was imposed for clearer delineation of the details of primary deformation zone (PDZ) in the figure.
Strain rate fields revealed by DIC for IE of Pb for various deformation geometries and speeds (insets of A–O). Width of the punch is 2 mm in this set of experiments.

(a) Schematic of IE process, inset shows strain rate field under the punch for 50% area reduction or extrusion ratio 2 in Pb. Strain rate filed is represented below the cut-off 2 whereby regions with higher values appeared in white color. (b) Different regions of the deformation zone appeared in strain rate fields marked as zones I and II and III in displacement field developed under the punch during deformation. Additionally angle of zone II with extrusion die wall and also its thickness are marked as θ and h respectively. (c) and (d) SLFs in IE for perfectly elastic–plastic material in frictionless and sticking friction conditions respectively.

The geometry of PDZ is demarcated into three zones, I, II, and III, identified using white lines in Fig. 3(b). Herein, the angle θ and thickness h of zone II were identified as parameters with respect to which, the PDZ was characterized. These parameters are identified in Fig. 3(b) and were found to undergo significant changes due to variations in the IE process variables quantified using the extrusion ratio and spatial scaling of deformation geometry. In this regard, the morphology of PDZ is relatable to that predicted using SLF analysis for the backward extrusion-type problem with extrusion ratio R = 2 for elastic-perfectly plastic material in plane strain condition. These are illustrated in Figs. 3(c) and 3(d), corresponding to frictionless and sticking friction conditions, respectively. Reference Chakrabarty3,Reference Hosford and Caddell9 Flow patterns shown in these figures demarcate trajectories corresponding to the direction of material flow with maximum shear strain rates.
It is evident from Fig. 3(a) that the deformation zone of IE features narrow zones exhibiting high strain rates localized in two arms and extending from the corners of the punch to the walls of the die and impinging at an angle θ marked as zone II. Additionally, a ring shaped zone I featuring high strain rates develops below the punch and exhibits a diffused surficial distribution extending and decaying into the bulk of the workpiece as depicted in Fig. 3(b). From the SLF perspective, assumptions of sticking friction result in parallel/perpendicular α/β slip lines impinging onto walls of the die. In this regard, flow patterns illustrated in Fig. 2 exhibit this behavior, evidenced across different extrusion speeds and small extrusion ratios (see row K–O), suggesting sticking friction conditions there [Fig. 3(d)].
Across the IE process parameters, empirical observations confirm that the spatial confinement of the PDZ influences its shape while maintaining its general shape, even in the near absence of work hardening. This is evident from a comparison of insets A through O in Fig. 2. In this regard, it is evident that with increasing the punch velocity, the zones of I and II assumed more diffused and curvilinear morphologies compared with characteristics observed at lower punch velocities. Insets in the bottom row of Fig. 2: K through O corresponding to IE with 3 mm specimen width feature significantly shallower angled deformation zones with small θ values compared to the top rows: insets A through J, these corresponding to IE dies with 4 and 5 mm specimen widths. Additionally, the thickness of zone II: h in Fig. 3(b), changes with extrusion ratios. Based on Eq. (3), extrusion ratios are calculated as 1.66, 2, and 3 for dies with 5, 4, and 3 mm widths. Higher extrusion ratios signify higher nominal values for imposed strains: ε=log R.
The influence of scale and geometry of IE was quantified by parameterizing the shape of the deformation zone in terms of θSF and h SF. Here, subscript SF refers to strain rate field. These were quantified using DIC and are summarized in Tables I and II. For instance, it is seen that θSF changes from 37° to 20° and h SF from 0.3 to 0.18 with increasing extrusion ratio R, the latter implying decrease in the thickness of zone II. These correspond to measurements obtained for 2 mm/s punch velocity and 2 mm punch width. By normalizing the values of h SF with respect to the width of the die: b, identified in Fig. 1(b), it was found that this value is nearly constant in all three extrusion ratios ∼0.06. Therefore, it is inferred that the normalized thickness of the deformation zone does not change significantly by varying the extrusion ratio. Table II shows trends in these parameters with respect to changing deformation ratios for larger punch velocity = 20 mm/s. Results from this quantification revealed that the normalized thickness of deformation zone II is approximately 0.085, signifying an increase in this parameter with respect to increasing deformation speeds. It is also seen that the angle θSF increases with respect to decreasing extrusion ratios at all speeds.
Deformation parameters measured for IE of Pb for a punch velocity of 20 mm/s. a is punch width and b is die width [Fig. 1(b)]. F
Y
is the measured force by load cell in Y direction [Fig. 1(b)]. k is extrusion constant [Eq. (4)]. h
SF and θSF are thickness and angle of deformation zone II [Fig. 2(b)] based on strain rate field measurements [Figs. 2(c) and 3]. h
RF and θRF are thickness and angles of deformation zone II based on rotation field measurements (Figs. 5 and 6).
 $\dot \gamma$
and εeff are average strain rate and effective strain in zone II measured by DIC.

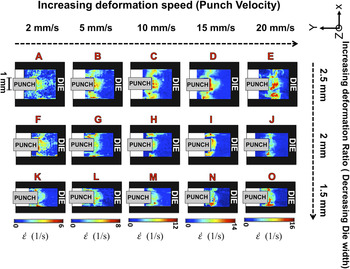
Figure 4 illustrates the strain rate fields for 1 mm punch width with 2.5, 2, and 1.5 mm die widths. Within this set, similar extrusion ratios elucidated in Fig. 2 were deployed. However, the process was scaled down in a geometrically similar manner to 1/2 its original size. In this regard, similar deformation zone morphologies were seen here, compared to strain rate fields shown in Fig. 2. However, it was seen that zone I is more localized and does not spread into the workpiece, when compared with results exhibited in Fig. 2.
Strain rate fields revealed by DIC for IE of Pb for various deformation geometries and speeds (insets of A–O). Width of the punch is 1 mm in this set of experiments.

Values of parameter θSF for 1 mm punch widths, those depicted in Fig. 3, were consistently larger than those prevalent during IE with 2 mm punch width, manifesting through a more diffuse zone II and often merging into zone III (Tables I and II). Note that θSF corresponding to 50% area reduction: rows 2 and 5 in Tables I and II, is significantly larger than θ suggested by scale free slip line model. Measurements show that this value is larger than 30° for both scales and velocities, almost twice as what is suggested by SLF theory (∼17°).
Reference Chakrabarty3
Larger θ angles in deformation zone II also result in a reduction in distance d in Fig. 3(d) from ∼3.31L to a range between ∼1.3L and 1.7L depending on the scale and velocity. Therefore, this implies that although the overall geometry of deformation zone remains almost similar during scale down the process, characteristics of its corresponding deformation field parameters do not follow the values predicted for scale free deformation fields suggested by analytical SLF models. Another quantification of deformation zone is obtained from normalized values of h
SF for punch width 1 mm as shown in Tables I and II: h
SF/b ≈ 0.15 and 0.20 for 2 and 20 mm/s punch velocities, respectively. However, values of this parameter for punch a punch width of 2 mm were: h
SF/b ≈ 0.06 and 0.085 for punch widths of 2 mm, respectively, indicating that there is an increase in the thickness of zone II in PDZ, instigated by process scale down. Consequently, the normalized thickness of zone II increases by the factor ∼2.3–2.5 times with scale down of the process. From observations of strain rate fields in Figs. 2 and 4 and quantified results in Tables I and II, it was observed that the geometry of deformation is not significantly influenced by varying the punch velocity. Average strain rate
 $\left( {\dot \gamma } \right)$
in zone II, exhibited during IE with conditions shown in Figs. 2 and 4 for 2 and 20 mm/s punch velocities, respectively, are illustrated in Tables I and II These values significantly increase upon process scale down. This effect can be attributed to a coupled effect of greater interaction of workpiece with die through friction, viz. a surface area effect, and more importantly from localization of strain fields. These will result in non-uniformities in microstructures within parts created by IE, likely manifesting instabilities in mechanical response of the fabricated machine element. For instance, reduction in the scale of severe plastic deformation processes, such as machining, is often accompanied by shear banding events,
Reference Turkovich and Black17
in addition to instabilities in microstructure response trajectories, wherein the rate of continuous dynamic recrystallization constituting formation of new grains during imposition of plastic deformation is subdued.
Reference Basu and Shankar7
To probe the mechanics of deformation further, values of force along the directions X, Y, and Z (see Fig. 1) were measured. Results along the extrusion direction: Y, are reported in Tables I and II In extrusion process, force along the Y direction: F Y can be expressed as Reference Hosford and Caddell16 :
 $${F_Y} = k\,{A_0}\,\ln R\quad ,$$
where k is extrusion constant, an overall factor which accounts for the flow stress of material, friction, and inhomogeneity of deformation. Reference Lee, Mallett and Yang18 That is because inhomogeneity in deformation and hence inhomogeneous distribution of plastic strains results in increasing internal stresses that affects the external forces. Reference Teoh and Lee19,Reference Prime and Hill20 The k values were found close to the shear strength of Pb. Reference Handbook21 From Table I, it can be seen that k increases with increasing extrusion ratio as well as scale down of the process. This effect is magnified with increasing the velocity, as shown in Table II. Effectively, the shear strength of elastic perfectly plastic material with almost no work hardening capacity, such as Pb, does not increase significantly with the imposition of strain during the process. Consequently, this variation represented in Tables I and II for the values of k with scaling down the process and increasing the velocity can be related to frictional effect and deformation gradients as mentioned previously. It can be seen that the value of k is increased in a range of ∼14–25% with scale down of the process by 1/2 and ∼40–55% with velocity, as extracted from Tables I and II.
2. Strain fields
For calculating the effective strain εeff accumulated by a material point, numerical time integration of the effective strain rate field was performed over its pathline as:
 $${\varepsilon _{{\rm{eff}}}} = \oint_\Gamma {{{\dot \varepsilon }_{\rm{p}}}{\rm{d}}t} \quad ,$$
where dt is the time between the image pairs in the sequence obtained by in situ characterization, Γ is the pathline, and
 ${\dot \varepsilon _{\rm{p}}}$
refers to the effective plastic strain rate that the material point experiences at time t in the pathline.
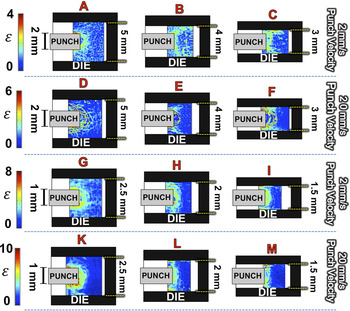
Figure 5 illustrates the strain fields ensuing upon IE on Pb and reveals that the deformation zone is more diffuse and spreads into the workpiece at larger extrusion ratios and smaller length scales. Additionally, it is evident that for a punch width of 2 mm, increasing punch velocities from 2 mm/s to 20 mm/s localizes the strain field within bands in zone I, shown in insets A to F of Fig. 5. However, this effect declined with scale down of the process at 1 mm punch widths: insets G to M of Fig. 4, exhibiting more unified and continuous strain field in the vicinity of the punch. The anticipated increase in value varies from ∼0.5 to ∼0.7 and then to ∼1.1 for ratios 1.66, 2, and 3, respectively, using analytically formulated ε = ln R. However, empirically calculated mean strains in zone II exhibited comparatively larger values. This effect originates from friction coupled with constriction of deformation within a smaller volume of material.
Strain field revealed by DIC for IE of Pb for various deformation geometries and speeds (A–M) in dies with 1 and 2 mm punch widths.

3. Rotation fields
The rotational component of deformation imposed during IE of Pb was determined from empirically measured and quantified pathlines using DIC. The rotation field was obtained by first calculating the displacement gradient tensor: ∇u and deformation gradient tensor: F fields. This was done using:
 $$\nabla u = \left( {\matrix{ {{{\partial u} \over {\partial x}}} & {{{\partial u} \over {\partial y}}} \cr {{{\partial v} \over {\partial x}}} & {{{\partial v} \over {\partial y}}} \cr} } \right),\quad \quad F = I + \nabla u\quad ,$$
where u and v are displacements in X and Y directions, respectively. Thereafter, polar decomposition was performed whereby rotation tensor R could be obtained from F. This was done by reducing the deformation gradient tensor to the right Cauchy–Green tensor by performing the operation:
 $$C = {F^{\rm{T}}}F\quad .$$
From the eigenvalues of the Cauchy–Green tensor C and (=λ i 2) eigenvectors of C (=W i ), the stretch tensor is obtained as:
 $$U = \sum\nolimits_i {{\lambda _i}{W_i} \otimes {W_i}\quad ,}$$
where
 $\otimes$
is the tensor product. Eventually the rotation tensor R(ω) is obtained by performing:
 $$R\left( \omega \right) = F * {U^{ - 1}}\quad .$$
Subsequently, the rotation tensor R is related to the finite rotation angle, (ω), by the relation:
 $$R\left( \omega \right) = \left( {\matrix{ {\cos \,\omega } & { - \sin \,\omega } \cr {\sin \,\omega } & {\cos \,\omega } \cr} } \right)\quad .$$
Doing this for every point on the grid, a rotation field was obtained for the material undergoing deformation during IE.
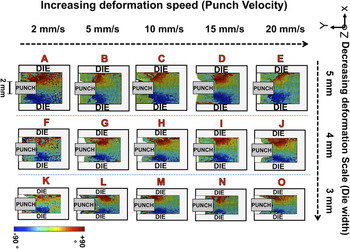
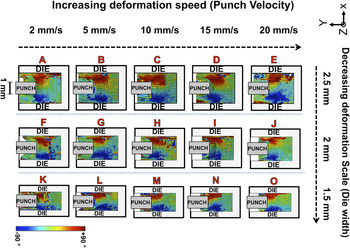
Figures 6 and 7 illustrate the result from this calculation for punch widths of 2 mm and 1 mm for different scales and deformation speeds. It is seen that the rotation of material elements is more concentrated in zone II of PDZ for all conditions, compared with zones III and I. It is also seen that with increasing extrusion ratios, magnitude of rotation (ω) increases in zone III and almost merges with zone II. A somewhat similar but more intense phenomenon is seen when the deformation zone was further constricted by reducing the width of the die while keeping the extrusion ratio same, this is depicted in Fig. 7.
Rotation fields revealed by DIC for IE of Pb for various deformation geometries and speeds (insets of A–O). Width of the punch is 2 mm in this set of experiments.

Rotation fields revealed by DIC for IE of Pb for various deformation geometries and speeds (insets of A–O). Width of the punch is 1 mm in this set of experiments.

Another manifestation of spatial constriction of the deformation geometry on ensuing plastic flow is observed in the rotation fields. Angles and thickness: θRF and h RF, respectively, measured for zone II of rotation fields are shown in Tables I and II for 2 and 20 mm/s deformation speeds. Here, subscript RF refers to rotation field. It was seen that the normalized thickness of zone II was less sensitive to process parameters here than witnessed from the strain rate fields: h SF. For instance, it was found that the normalized thickness of zone II increases by ∼1.5 times when the scale of the process was decreased to 1/2.
B. IE of Al
Spatial heterogeneity in deformation is known to exist during IE and has been related to the plastic anisotropy in addition to the geometry of deformation. The former plays a role in small length scales when the size of the deformation zone becomes comparable to the scale of the microstructure and results in poor part qualities. This effect is naturally subdued in the presence of high concentrations of grain boundaries, wherein the intrinsic anisotropic nature of material is averaged out and isotropy in material flow results in better part qualities Reference Rosochowski, Presz, Olejnik and Richert22–Reference Chan, Fu and Yang25 . While prior efforts have delineated the consequences of GS effect on the flow behavior and part quality of miniaturized fabricated components, a systematic study of describing how the deformation zone geometry scales with the initial microstructure and its manifestations on process outcomes has not been studied. In this section, we seek to parameterize deformation zone geometry of IE of AA1100 as a function of the starting GS δ.
1. Mechanics of deformation (stain-rate, strain, and rotation fields)
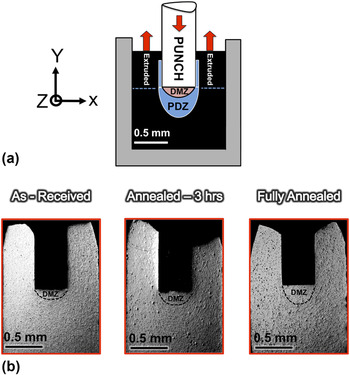
Figure 8 shows the results of metallography on deformed AA1100 produced using as-received and heat treated microstructures by IE. The as-received Al featured a GS of ∼30 μm, whereas the annealed Al featured a mean GS of ∼70 μm (3 h at 823 K) and ∼150 μm (20 h at 823 K). From in situ observations using CCD camera [Fig. 1(b)] as well as postmortem optical metallography, it is seen that a larger dead metal zone (DMZ) as opposed to Pb was formed during IE of Al. The DMZ and PDZ are identified in Fig. 8(a). Mechanics of material deformation in the DMZ are governed by work hardening capability of the workpiece material Reference Cardarelli26 as well as tribological conditions prevailing in the interface between the punch and the specimen Al Reference Basu, Zhiyu and Saldana1 . In turn, the dimensions of the resulting DMZ are governed by compounded effects of both factors put together. However, owing to similarities between coefficients of frictions between Pb-steel and Al-steel interfaces, both exhibiting μ ∼ 0.45, it is hypothesized that mechanics of material deformation during IE follows different trajectories in Pb and Al, resulting in disparities in their dimensions. In this regard, a larger DMZ was formed in the sample with largest initial GS (Alfull-anneal) as compared with the other samples (Alas-received and Al3h). From the measurement using results shown in Fig. 8(b), it was found that the depth of DMZ in workpiece below the punch at centerline is ∼130, 170, and 270 μm for Alas-received, Al3h, and Alfull-anneal conditions, respectively. Mechanics of microstructure evolution in the DMZ produced during IE of AA1100 are discussed in the ensuing sections.
(a) Schematic of IE showing different regions of deformation zone. Here, DMZ refers to the area of DMZ and PDZ to the area of plastic deformation zone. (b) Optical images of polished and etched surfaces of the extruded Al with different initial GSs.

Quality of specimens produced by IE was characterized by imaging the cross section of the sample (8a). We note that the process outcomes of IE are governed by the prior microstructural state. Poor part qualities were consistently produced in Al3h specimens, shown in Fig. 8(b), which features a GS that is ∼70 μm with respect to Alas-received and Alfull-anneal specimens, contrary to the generally relatable poorest qualities resulting in specimens featuring the largest GSs in meso- /microscale forming processes. Reference Tiesler and Engel27 However, more detailed analysis is needed to clarify simultaneous effects of initial microstructure parameters such as GS/and crystallographic texture on processing outcomes and their interaction with geometry of the process and macroscopic boundary conditions.
PDZ appeared as layers of deformed material having a ring-shaped morphology, shown in Fig. 8(b). It is seen that PDZ extends further into the workpiece below the punch in Alfull-anneal compared to other conditions. Empirical measurements using optical microscopy revealed that the thickness of PDZ is ∼180, 360, and 520 μm for Alas-received, Al3h, and Alfull-anneal conditions, respectively along the centerline. Although the depth of PDZ below the punch is smaller in as-received condition, it has a more localized morphology as opposed to heat-treated conditions.
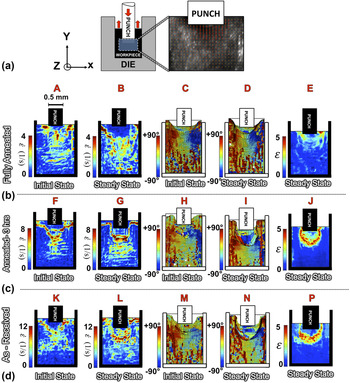
Figure 9 illustrates the in situ characterization of mechanics of deformation during IE in Al. Strain rate and rotation fields are shown at initial and steady states of the process demonstrating the mechanics of the formation of DMZ and PDZ during IE. In this regard, it is evident that different locations within the deformation zone of IE are subjected to different deformation conditions. The material at initial state of deformation showed a PDZ with morphology somewhat similar to what is formed during simple compression obtained by slip line solutions Reference Hosford and Caddell16 [insets A, F, and K in Figs. 9(b)–9(d)]. This is because the material initially deforms in compression mode between the punch and the die before it starts shearing and flowing upward along the die walls. In addition, deformation zone has a branched morphology originating from the interface of DMZ and PDZ in as-received condition. However, these features were absent in the annealed counterparts. In addition, we find that the deformation zone in work hardening material Al differs morphologically from that in nonwork hardening Pb. It is observed that the evolution of DMZ below the punch during the deformation governs geometry of deformation zone. Furthermore, the deformation zone marked as zone II in Fig. 3(b) was not as apparent as in Al, compared to that in Pb.
(a) Schematic of IE with a transparent window, inset shows displacement field in Al obtained by DIC through in situ observations. (b), (c), and (d) Strain rate, rotation and strain fields obtained by DIC in initial and steady states of deformation during IE of Al with different initial GSs (insets A to P).

Grain boundaries are known to act as sites within polycrystalline microstructures where the onset of plastic deformation takes place during imposition of a global strain field. Reference Fu and Chan28 This is because of the ease of activation of dislocation slip on more systems close to grain boundaries to maintain compatibility. Therefore, the higher concentration of grain boundaries presumably manifests in the narrower branching deformation zone along stress concentrations imposed by global boundary conditions in the as-received material as opposed to annealed ones. Irrespective of this fact, the deformation zone during IE of Al is significantly more diffuse than that in Pb. Reasons for this can be traced back to rate of work hardening which is known to remain positive before saturating at large strains as opposed to that in Pb which features a nearly elastic perfect plastic behavior during plastic deformation. This results in strain localization behavior that manifests in well-defined zones undergoing severe deformation at small spatial scales. Another reason can be related to the low homologous temperature of Pb, which makes activation of several slip systems, for accommodation of global strains, easier. Therefore, the final strain rate field looks similar to that predicted by SLF, which is essentially a kinematically admissible solution. But for the presence of a large DMZ, qualitatively similar rotation fields as that observed in Pb were seen in Al. This is illustrated in Fig. 9. The heterogeneity of deformation in Al during IE is also evident in its DIC characterized strain fields as seen in insets E, J, and P of Figs. 9(b)–9(d).
Table III shows the influence of the starting microstructural state of Al on its mechanical response during IE. It can be seen that force values and so the resulting factor k strongly depends on the GS δ of Al samples and increases significantly with decreasing δ. Flow stress of Al during IE can be predicted using Hall–Petch relation, σy(ε,δ) = σ0(ε) + k
0(ε)δ−1/2, that relates the same to the GS δ, where σ0(ε) and k
0(ε) are material constant and function of imposed strain.
Reference Hall29–Reference Armstrong, Codd, Douthwaite and Petch31
Hall–Petch relation for AA1100 was found to have material constants, σ0 and k
0, 14.3 MNm−2 and 0.065 MNm−3/2, respectively, for a range of GS from 20 μm to 400 μm and strains under 0.5.
Reference Thompson, Baskes and Flanagan32
The nominal strain in the geometry used here is 0.4. The expected values for flow stress using this equation and empirically characterized microstructures were found to be ∼19.5, 22, and 26.2 MNm−2 for GS δ = 150, 70, and 30 μm, respectively. This shows that the expected flow stress increases ∼12.5 and 33.7% for GSs 70 and 30 μm, respectively, with respect to large GS 150 μm. However, the real increase in the flow stress based on the results shown in Table III for values of k, as an indicator for flow stress of material in sub-mm scale, are ∼47 and 106% for GSs 70 and 30 μm, respectively, with respect to large GS 150 μm. The increase in flow stress during IE with decreasing GS despite the same specimen dimensions is a coupled manifestation of the thickness of the shear zone that indicates heterogeneity in deformation and friction. This claim is supported by the empirical measurements of εeff and
 $\dot \gamma$
using DIC (see
Table III) showing a large difference in these values for Alas-received, Al3h, and Alfull-anneal. Consequently, these differences indicate that Hall–Petch material constants may not be uniformly valid across the different specimen conditions tested by microforming here. Work is underway to resolve these effects.
Deformation parameters measured for IE of pure Al with different initial GSs (δ). a is punch width and b is die width [Fig. 1(b)], punch velocity is 5 mm/s. F
Y
is the measured force by load cell in Y direction [Fig. 1(b)]. k is extrusion constant [Eq. (4)]. h
RF/b and θRF are normalized thickness and angles of deformation zone II based on rotation field measurements (Fig. 9, insets D, I, and N).
 $\dot \gamma$
and εeff are average strain rate and effective strain in PDZ I, below the punch measured by DIC (Fig. 9, insets B,G, L, and E, J, P, respectively).

2. Microstructure and texture evolutions in PDZ
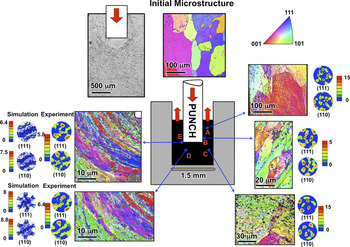
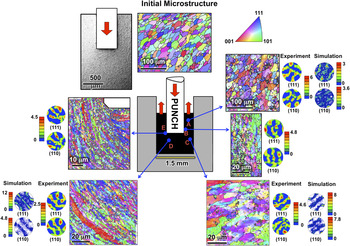
Consequences of heterogeneity of deformation are clear from a comparison of microstructures close to the punch corner and PDZ: regions E and D, with that in the extruded arms: region A, across all starting specimen states: Alfull-anneal, Al3h, and Alas-received, respectively (Figs. 10 and 11). These feature differences with respect to their GSs, morphologies as well as the geometric orientation of its pancake shaped sheared grains. Here, microstructure in the extruded arms close to the walls of the punch in region B was found to be deformed and elongated in the direction of material flow Y. However, a larger grain structure was seen close to the center of the extruded arm in fully annealed sample in region A.
IPF maps obtained from OIM of Al in fully annealed condition before and after IE showing initial and final microstructures in different regions (marked as A–E). Empirical and simulated (111) and (110) pole figures show texture evolution across the deformed sample. Inset in top left of the image shows deformed microstructure throughout the sample captured by optical microscopy.

IPF maps obtained from OIM of Al in as-received condition before and after IE showing initial and final microstructures in different regions (marked as A–E). Empirical and simulated (111) and (110) pole figures show texture evolution across the deformed sample. Inset in top left of the image shows deformed microstructure throughout the sample captured by optical microscopy.

Figures 10 and 11 also show the crystallographic textures extracted from OIM. With respect to the starting microstructure that featured a random crystallographic texture signifying lack of preferred orientations, postdeformation samples feature a significantly evolved crystallographic texture in PDZ. However, this evolution was somewhat subdued during extrusion in Alfull-anneal. Heterogeneity in evolution of textures during IE is evident in Figs. 10 and 11, this arises due to different deformation modes prevalent in different parts of the specimen. In this regard, it was seen that texture evolves more significantly in zones undergoing localized straining in regions E and D.
Crystallographic textures were simulated by coupling deformation histories characterized using DIC with the VPSC framework. This was done in a manner similar to the technique described in Refs. Reference Basu, Zhiyu and Saldana1 and Reference Basu and Shankar33. Results of texture simulations using VPSC are also shown in Figs. 10 and 11 for regions D and E in fully annealed and A, D, and E for as-received samples. Qualitatively, these observations suggest dominance of simple shear deformation modes Reference Kalidindi, Bronkhorst and Anand34 in material during IE, which has highest density below the punch in region D. We see that VPSC model performs very well for predicting textures evolved in material during IE even for annealed condition regardless of the assumption made in VPSC simulation of contribution of thousands of grains and all possible orientations during texture evolution. Reference Lebensohn and Tomé35 Reasons for this lie in the rate of microstructure evolution during IE that constitutes generation of dislocation structures quickly with respect to imposition of strains, whereby effects arising from the oligocrystalline state of the specimens prior to deformation are subdued.
These observations make it evident that in spite of the large variation in the initial GS δ of Al samples, the microstructure undergoes a significant transformation during IE in PDZ. In both cases, the evolved microstructure shows features that are predominantly present at medium to high strain levels in deformed Al. Reference Hughes and Hansen36 This is supported by high strains imposed locally in PDZ, as characterized using DIC and depicted in Fig. 9, despite smaller nominal strains predicted using ε = ln R (=0.4). Additionally, similar textures evolved in PDZ, regardless of the starting GS. All these suggest a minor role of the initial GS δ in the mechanics of microstructure evolution, especially in regions that exhibit high local straining: regions E and D. However, it must be noted the major role played by the GS δ is in the gradient/scattering of microstructure characteristics, which determines the geometry of PDZ. Details associated with this effect will be discussed in Sec. III. B. 3.
3. Characterization of dislocation structure
Orientation imaging data was utilized to characterize the geometrically necessary dislocation density (GND) field, ρGND, in PDZ in regions marked as E and D in Figs. 10 and 11. This was done using the procedure described in Ref. Reference Demir, Raabe, Zaafarani and Zaefferer37. ρGND was approximated as the norm of Nye's dislocation tensor α ij which was calculated using:
 $$\underline \alpha = \underline \nabla \times \underline \beta \quad ,$$
where β kl is the elastic part in the distortion tensor, decomposed additively from the total distortion tensor. β kl can be further decomposed additively into the stretch ε kl and the rotation g kl components in which, the stretch is neglected. Reference Demir, Raabe, Zaafarani and Zaefferer37 Herein, it is assumed that fluctuations in the elastic stress field are negligible. Reference Acharya and Knops38 This results in:
 $$\underline \alpha \approx \underline \nabla \times \underline g\quad ,$$
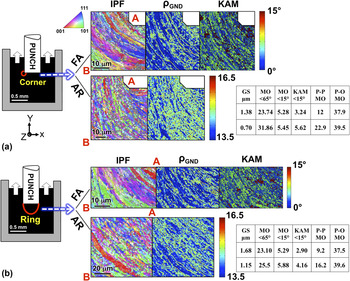
Here, g kl is processed from empirically acquired OIM data. In our experiments, the Bunge components (φ1, Φ, φ2) obtained from EBSD (Figs. 10 and 11, regions E and D) were converted to the rotation tensor which was taken as g. Finally, Eq. (12) was implemented numerically. Results of this exercise are shown in Fig. 12. Additionally, in this figure, inverse pole figure (IPF) and kernel average misorientation (KAM) maps are also shown for samples in fully annealed and as-received conditions. Results are shown for regions E and D that are spatially identified as the “corner” and “ring” in Figs. 12(a) and 12(b), respectively. KAM is essentially similar to the GND density field in which, zones featuring high local misorientation gradients are highlighted. Herein, a threshold misorientation <15° was chosen during calculation of GND as well as KAM fields to eliminate contributions from high angle grain boundaries.
IPF, GND density and KAM maps for regions labeled as (a) corner and (b) ring in PDZ for fully annealed and as-received Al samples. Color scale for GND is at log10 scale. Tables show average of GS, misorientation (MO), KAM, point-to-point (P–P) and point-to-origin (P–O) misorientations for aforementioned regions. (P–P) and (P–O) were measured from points A to B marked in IPF images.

It is seen that GNDs form within zones that feature largest orientation gradients, these being close to pre-existing as well as newly formed low/high angle grain boundaries. In this regard, the average KAM post IE is higher for as-received condition in both corner and ring zones: 5.62° and 4.16°, respectively, as compared with fully annealed condition: 3.2° and 2.9°. These results show that a high volume of grain boundaries in as-received sample results in the formation of larger local misorientations during deformation. These differences in KAM are relatable to geometry of the PDZ during IE. For instance, it was seen by characterization of flow fields using DIC that the PDZ adopts a diffuse morphology during extrusion of Alfull-anneal samples. A diffuse PDZ will result in smaller strain gradients and resultantly smaller KAM and ρGND in comparison to a highly localized PDZ in Alas-received. In this regard, investigations using DIC in Sec. III. B. 1 show that the dimensions associated with the PDZ and therefore KAM as well as ρGND scale with the GS. This is likely related to the concentration of grain boundaries, which are known to be hot spots for dislocation activity to maintain compatibility during plastic deformation.
The average GNDs: ρGND in the area over which ρGND maps were generated is ∼1.6 × 10¹⁵, 6.3 × 10¹⁵ for corner [see Fig. 10(a)] and 7.9 × 10¹⁴, 3.4 × 10¹⁵/m2 for ring [see Fig. 12(b)] in fully annealed and as-received samples, respectively. Additionally, the overall ρGND can be roughly estimated by measuring the thickness of the deformation zone h, this in turn made possible by setting a threshold strain rate of 0.05/s in strain rate fields and finding the average of effective strain over this thickness (see Table III). This can be done by using strain Eqs. (13)–(15), described subsequently, whereby ρGND is related directly to strain gradient: ε/h. Using this argument, values of ρGND for Alas-received and Alfull-anneal was estimated as ∼5.6 × 10¹⁴ and 8.2 × 10¹³/m2, respectively. Although these values do not match perfectly with the local ρGND measured using OIM micrographs, they can be suggested as a close approximation of overall ρGND produced in PDZ during deformation.
The inset tables in Fig. 12 show the average of point to point (P–P) and point to origin (P–O) misorientations along the line connected the corners of IPF maps from A to B, marked in Fig. 12. Point-to-point indicates the orientation changes between abutting points whereas point-to-origin refers to the orientation changes between all points and a reference point which is A in these measurements. It is seen that there is a difference in the average of P–P misorientation between the samples in fully annealed and as-received conditions, these showing lower values for fully annealed condition. This shows that the local misorientations as well as orientation gradient from B to A is larger in as-received condition. To rationalize these observations we relate the dependence of the thickness of the deformation zone on the GS via the GND associated with the underlying mechanics.
In strain gradient plasticity theory, strain gradient is defined as:
 $$\eta = {{{\rm{d}}\varepsilon } \mathord{\left/ {\vphantom {{{\rm{d}}\varepsilon } {{\rm{d}}x}}} \right. \kern-\nulldelimiterspace} {{\rm{d}}x}}\quad ,$$
where ε is strain and x is distance along the X axis. Reference Fleck and Hutchinson39 Integration of this equation along each axis gives the length of the zone over which the strain is changing in the deformation zone that can be related to the thickness of the deformation zone along the mentioned axis as:
 $$h = c\int {{\rm{d}}x} = {C_0}{\varepsilon \mathord{\left/ {\vphantom {\varepsilon {\eta \quad ,}}} \right. \kern-\nulldelimiterspace} {\eta \quad ,}}$$
where C 0 is constant. The gradients of strain that can create either because of the geometry of deformation or material itself result in GNDs according to Reference Fleck, Muller, Ashby and Hutchinson40 :
 $$\eta = b{\rho _{{\rm{GND}}}}\quad ,$$
where b is the Burgers vector. Therefore, thickness of the deformation zone can be related to ρGND by following expression:
 $$h = c\int {{\rm{d}}x} = {C_0}{\varepsilon \mathord{\left/ {\vphantom {\varepsilon b}} \right. \kern-\nulldelimiterspace} b}{\rho _{{\rm{GND}}}}\quad .$$
Thus, it can be argued that the thickness of deformation zone is a function of strain and GND density, h = f(ε,ρGND) having a direct relationship with strain and inverse relationship with density of GNDs.
Both extrinsic and intrinsic material length scales result in generating high density of GNDs.
Reference Engel and Eckstein41
Therefore,
 ${\rho _{{\rm{GND}}}}_{_{({\rm{Total}})}}$
for Al with different GS (δ) deformed by IE studied here can be expressed as:
 $${\rho _{{\rm{GN}}{{\rm{D}}_{\left( {{\rm{Total}}} \right)}}}} = {\rho _{{\rm{GN}}{{\rm{D}}_{\left( {{\rm{Geometry}}} \right)}}}} + {\rho _{{\rm{GN}}{{\rm{D}}_{\left( {{\rm{Grain}}\,{\rm{size}}} \right)}}}}\quad .$$
In IE of pure aluminum, density of GNDs caused geometrically is related to the initial and final width of the sample as:
 $${\rho _{{\rm{GN}}{{\rm{D}}_{\left( {{\rm{Geometry}}} \right)}}}} = {1 \over b}\left( {{1 \over {{w_i}}} + {1 \over {{w_f}}}} \right)\quad ,$$
where, w i and w f are initial and final width of the sample (1.5 and 1 mm, respectively) and b is Burgers vector (0.286 nm for aluminum). Simple calculation using this equation reveals that ρGND caused by geometry constrictions for the dimensions used in present work is estimated as ∼5.83 × 10¹²/m2. This value is constant in all experiments with Al studied here. Here, the representative strain value was extracted from the strain fields characterized using DIC.
Intrinsic source of generating GNDs for the single phase materials studied here is typically the grain boundaries. Reference Thompson, Baskes and Flanagan32 Grain boundaries act as constraints that impose long-range stresses in the microstructure accommodated by GNDs. The density of such GNDs and its dependence to GS was firstly suggested by Ashby. Reference Poole, Ashby and Fleck42 In this model, it was assumed that in grain boundary regions GNDs are dominant and their density is related to the slip distance λG and since GS is an upper bound for slip distance, then it is related to GS as Reference Thompson, Baskes and Flanagan32 :
 $${\rho _{{\rm{GN}}{{\rm{D}}_{\left( {{\rm{Grain}}\,{\rm{size}}} \right)}}}} = {{{C_1}} \mathord{\left/ {\vphantom {{{C_1}} {\delta b}}} \right. \kern-\nulldelimiterspace} {\delta b}}\quad ,$$
where δ is GS and C
1 is a constant. In Ashby's model, ρGND is also related to strain but is only applicable in the small strain limit and then becomes independent as strain goes up since increasing strain should not require a proportionate increase in grain boundary accommodation.
Reference Fleck, Muller, Ashby and Hutchinson40
Neglecting the effect of
 ${\rho _{{\rm{GN}}{{\rm{D}}_{\left( {{\rm{Geometry}}} \right)}}}}$
in
 ${\rho _{{\rm{GN}}{{\rm{D}}_{\left( {{\rm{Total}}} \right)}}}}$
and substituting Eq. (19) as a measure for
 ${\rho _{{\rm{GN}}{{\rm{D}}_{\left( {{\rm{Total}}} \right)}}}}$
in Eq. (16), we obtain:
 $$h = c\int {{\rm{d}}x} = C\varepsilon \delta \quad ,$$
where C is a constant which is equal to C
0/C
1 and ε is average of strain over the thickness of deformation zone, this characterized using DIC. This simply shows that dimension of deformation zone is related directly to strain ε and GS δ. Thus, since
 ${\rho _{{\rm{GN}}{{\rm{D}}_{\left( {{\rm{Total}}} \right)}}}}$
in Eq. (16) varies locally throughout the deformation zone, we can use GS parameter δ to predict thickness of deformation zone. This is possible by plotting the thickness of the deformation zone h versus εδ using accurate imposed strains obtained empirically by DIC for materials with various initial GSs to find the constant value C of Eq. (20) for each material. For the three data points, we have for Al, constant C was found to have the value ∼0.36 with R
2 = 0.9. Verification of this value needs more data points. It must be noted that when the scale of deformation is reduced to the order of micron and becomes close to the intrinsic martial length scales e.g., subgrain size, etc. the effect of
 ${\rho _{{\rm{GN}}{{\rm{D}}_{\left( {{\rm{Geometry}}} \right)}}}}$
cannot be ignored in determining the thickness of deformation zone.
Reference Basu and Shankar7
IV. SUMMARY AND CONCLUSIONS
IE was performed on Pb and Al at microforming-relevant length scales to measure the deformation and microstructure evolution. The effect of geometric scaling and deformation rate on ensuing deformation zone and its mechanics, such as strain, strain rate, and rotation fields, was studied using in situ imaging of material flow during IE and subsequent image analysis using DIC. It was found that the normalized thickness of the deformation zone increases with scaling down of the process. However, with increasing deformation rate, the morphology of PDZ and its spread does not change significantly. But, increasing deformation rate leads to enhanced strain localization and rotation of material elements, which is further pronounced in smaller scales. These can result in non-uniformities in microstructures in parts created by IE and manifesting in instabilities in mechanical response. Complementing this, effect of GS on mechanical responses in Al and its microstructure evolution was studied during IE. It is shown that with a larger initial GS and larger work hardening capacity, the deformation zone is more extended and a large DMZ forms below the punch manifesting more heterogeneity in deformation. A VPSC model was used to simulate the texture evolutions in different parts of the deformed Al samples and the results were compared to the empirical observations. It was found that there is a significant variation in evolved crystallographic textures across the deformed samples and observations suggest a preponderance of a simple shear crystallographic type of texture resulting from the deformation. Finally, strain gradient theory and its relation to the scale of the microstructure was used to rationalize the thickness of the deformation zone. These characterizations are expected to offer a framework for identifying the underlying process–structure mappings and subsequently offer control strategies for mitigating process anomalies and tailoring product functionalities.
ACKNOWLEDGMENTS
Support from the National Science Foundation (CMMI Grant No. 1030265) and the II–VI foundation block gift program is acknowledged. We are also grateful for the comments of the reviewer, which helped significantly improve the manuscript.