





Evidence increasingly suggests that non-diet approaches that can be sustained over the long term and integrated into daily life are more effective for body weight management(Reference Gast, Campbell Nielson and Hunt1–Reference Özkan, Aktaş and Atık3). Intuitive eating, one of these non-diet approaches, is defined as an approach in which individuals rely on physiological hunger and satiety cues rather than environmental or emotional cues to regulate their eating behaviour(Reference Augustus-Horvath and Tylka4–Reference Tribole and Resch7). Emerging as a long-term and holistic behavioural approach that promotes healthy eating and lifestyle habits(Reference Tribole and Resch7–Reference Cole and Horacek9), intuitive eating is distinguished from traditional dietary approaches by these characteristics.
Intuitive eating has been associated with greater psychological well-being, self-esteem and life satisfaction; lower levels of depression, anxiety and eating disorder symptoms; a more positive body image and more favourable metabolic health indicators(Reference Hawley, Horwath and Gray10–Reference Hawks, Madanat and Hawks13). However, only a limited number of studies have investigated the relationship between intuitive eating and dietary intake, and the available evidence remains inconsistent(Reference Barad, Cartledge and Gemmill14–Reference Jackson, Sano and Parker19). These findings highlight the need for a more comprehensive and multidimensional examination of the relationship between intuitive eating and dietary intake.
However, beyond these individual-level associations, environmental and structural factors such as food security may also play a critical role in shaping eating behaviours. Food security refers to a condition in which all individuals have sustainable and dignified physical and economic access to sufficient, safe and nutritious food necessary for an active and healthy life(20). In addition to food availability and utilisation, factors such as stress related to food access and the acceptability of food are also considered within the scope of food security(21). Food insecurity has a negative impact on overall health and nutritional status and remains a significant global issue with increasing prevalence(Reference Wolfson and Leung22). It is strongly associated with numerous adverse health outcomes, including inadequate nutrition, psychological problems and chronic diseases(Reference Becker, Middlemass and Taylor23–Reference Reeder, Tapanee and Persell27).
Food insecurity may manifest as skipping meals or reducing the amount of food consumed during meals. Paradoxically, obesity rates have also been reported to be higher among individuals experiencing food insecurity than among those who are food secure(Reference Kranz and McCabe28). In this context, it is important to consider how food insecurity may affect the ability to eat in response to internal physiological cues. Intuitive eating promotes reliance on hunger and satiety cues(Reference Jackson, Sano and Parker19,Reference Burnette, Hazzard and Larson29) . However, in contexts characterised by limited food access, individuals may not have the opportunity to respond to these internal signals, and food choices may instead be shaped by accessibility and economic factors(Reference Gomez and Perez30). This raises a critical question regarding whether intuitive eating can function as intended in such constrained environments.
Moreover, intuitive eating is a multidimensional construct comprising distinct subdimensions, including reliance on hunger and satiety cues, eating for physical rather than emotional reasons, unconditional permission to eat without restrictive rules and choosing foods that support bodily needs and health. These subdimensions may operate differently under conditions of limited food access. Accordingly, understanding how food insecurity shapes the relationship between intuitive eating and dietary intake requires a more nuanced, subdimension-level examination. The developers of the Intuitive Eating Scale-2 (IES-2) highlighted the importance of examining the associations of food insecurity or limited access to adequate food with intuitive eating(Reference Tylka and Kroon Van Diest5). Yet, few studies to date have examined the relationship between intuitive eating and dietary intake while accounting for food insecurity. Although sex-related differences have been reported in both eating behaviours and dietary patterns, few studies have examined these differences in the context of intuitive eating and dietary intake(Reference Camilleri, Méjean and Bellisle15,Reference Horwath, Hagmann and Hartmann17,Reference Jackson, Sano and Parker19) .
Examining these relationships specifically among university students is of particular importance. The transition to university represents a critical period for the development of future weight-related and dietary behaviours. During this period, students typically begin making independent dietary decisions for the first time, and the behavioural patterns established during this transition may persist into later adulthood(Reference Lanoye, Brown and LaRose31). Moreover, university students constitute a particularly vulnerable group with respect to food insecurity. Studies conducted in Türkiye have shown that food insecurity is prevalent among university students(Reference Celik, Ozyildirim and Karacil Ermumcu32,Reference Niyaz33) . Accordingly, examining the interplay between intuitive eating, food insecurity and dietary intake among university students may inform the development of early intervention strategies for this at-risk population while addressing an important gap in the existing literature. For these reasons, this study aimed to examine the associations between intuitive eating subdimensions and food group-specific consumption scores according to food insecurity status and sex among university students aged 19–24 years in Türkiye.
Methods
Study design
This study employed a cross-sectional correlational design. The STROBE reporting guideline and checklist were used in the preparation and reporting of this manuscript(Reference von Elm, Altman, Egger, Harwood, Albury and de Beyer34). Sample size was determined using an a priori power analysis conducted with G*Power version 3.1 based on an independent-samples t test. An effect size of Cohen’s d = 0·28 was assumed, consistent with the small sex differences in IES-2 subdimension scores previously reported among college students(Reference Tylka and Kroon Van Diest5). Assuming a two-sided significance level of 0·05 and a statistical power of 90 %, the minimum required sample size was calculated to be 540 participants.
Participants were recruited through university student class groups across Türkiye and social media platforms. Information about the study objectives, eligibility criteria and the voluntary nature of participation was provided before access to the questionnaire. Eligible individuals who provided electronic informed consent were invited to participate in the study.
Accordingly, 561 university students aged 19–24 years were initially recruited. The mean questionnaire completion time was 9·65 ± 2·05 min. Following the recommendations of Peer et al., participants who completed the questionnaire in less than three standard deviations below the mean completion time were considered likely to have responded inattentively and were therefore excluded prior to analysis(Reference Peer, Brandimarte and Samat35). Consequently, the final analytical sample comprised 545 participants after excluding sixteen participants based on this predefined data quality criterion.
This study was conducted in accordance with the guidelines laid down in the Declaration of Helsinki, and all procedures involving human participants were approved by the Selçuk University Faculty of Health Sciences Ethics Committee for Non-Interventional Clinical Investigations (Decision No. 2022/1179). Written informed consent was obtained from all participants.
Measures
Data were collected via an online survey using the General Information Form prepared by the researcher, along with the IES-2, the Food Insecurity Experience Scale (FIES) and an FFQ.
Participant characteristics
Participants’ demographic characteristics, including age, sex and living arrangement, and self-reported body weight and height were recorded. Self-reported body weight and height were used to calculate BMI (kg/m2). BMI categories were defined according to the WHO classification for adults as underweight (<18·5 kg/m²), normal weight (18·5–24·9 kg/m²), overweight (25·0–29·9 kg/m²) and obese (≥30·0 kg/m²)(36).
Intuitive eating
Intuitive eating was assessed using the IES-2, for which the validity and reliability of the Turkish version have been established(Reference Baş, Karaca and Sağlam37). In the Turkish validation study, factor analysis supported the original four-factor structure, which explained 77·53 % of the total variance. The KMO value was 0·87, and Bartlett’s test of sphericity was significant (χ² = 9043·49, p < 0·001). Test-retest reliability, assessed using the intraclass correlation coefficient, was 0·88, and Cronbach’s alpha for the total score was 0·82.
The IES-2 consists of twenty-three items across four subdimensions: (1) Unconditional permission to eat (UPE, six items) reflects eating desired foods without restrictive food rules; (2) eating for physical rather than emotional reasons (EPR, eight items) reflects eating in response to physical hunger rather than emotions; (3) reliance on hunger and satiety cues (RHSC, six items) reflects trusting hunger and satiety cues to guide eating and (4) body–food choice congruence (B-FCC, three items) reflects choosing foods that support bodily needs and health. Items are scored on a five-point Likert scale ranging from 1 (‘strongly disagree’) to 5 (‘strongly agree’). Negatively worded items are reverse-scored. Total and subdimension scores are calculated by averaging the relevant item scores and range from 1 to 5. Higher scores indicate higher levels of overall intuitive eating or the corresponding subdimension.
Food insecurity
Food insecurity was assessed using the Turkish version of the FIES, developed by the FAO and adapted into Turkish within the Turkey Nutrition and Health Survey 2019(38). In addition to determining the presence of food insecurity, the FIES also measures its severity, focusing on the difficulties and experiences individuals face in accessing food due to insufficient food or resources(Reference Cafiero, Viviani and Nord39). The FIES provides a quantitative food insecurity score and also enables individuals to be classified according to the severity of food insecurity. Higher scores indicate greater severity of food insecurity. The scale consists of eight items covering the previous 12 months. Each item refers to a distinct dimension of food security and assesses individuals’ or households’ ability to obtain food under varying conditions, diet quality and the extent to which food quantity is compromised. Items 1, 2 and 3 indicate mild food insecurity; items 4, 5 and 6 indicate moderate food insecurity and items 7 and 8 indicate severe food insecurity(40).
Dietary intake
Dietary intake was assessed using an FFQ. The FFQ used in this study was pilot-tested by the Turkish Ministry of Health. It was subsequently administered as part of the Turkey Nutrition and Health Survey 2019, which was conducted using a nationally representative sample(38). Participants were asked to report how frequently they had consumed each food item over the previous 12 months. The questionnaire included fifty-one food items and seven frequency categories: ‘never,’ ‘less than once per month,’ ‘1–3 times per month,’ ‘once per week,’ ‘2–3 times per week,’ ‘4–5 times per week’ and ‘every day.’ The food items were classified into eight groups: milk and dairy products; meat, eggs and legumes; vegetables and fruits; grains and grain products; fats and oils; sugars and sweets; beverages and fast foods. Participants reported the consumption frequency of each food item based on predefined standard portions. Coefficients were assigned to the frequency categories in ascending order, ranging from 0 for ‘never’ to 6 for ‘every day.’ An item-specific consumption score was calculated by multiplying the frequency coefficient by the reported number of standard portions. Food group-specific consumption scores were then calculated by summing the scores of all food items within the corresponding group. These scores provided a relative measure of consumption, with higher scores indicating greater consumption of the corresponding food item or food group, thereby allowing comparisons among participants.
Analysis
Data were analysed using IBM SPSS Statistics, version 26.0. The normality of numerical variables was assessed using the Shapiro–Wilk test together with visual inspection of Q–Q plots. Based on the combined assessment, parametric tests were considered appropriate. Independent-samples t-tests were used to compare IES-2 total and subdimension scores and FIES scores between female and male participants. ANOVA was used to compare IES-2 total and subdimension scores and FIES scores across BMI categories. When ANOVA indicated a significant difference, Bonferroni-adjusted post hoc comparisons were performed. Pearson correlation analysis was used to examine the relationships between FIES scores and IES-2 total and subdimension scores. The level of statistical significance was set at p < 0·05.
In accordance with the FAO methodology for the use and analysis of the FIES, the psychometric properties of the scale were evaluated in the study sample using Rasch analysis in R software(Reference Cafiero, Viviani and Nord39). Item fit was assessed using infit and outfit statistics, local independence was evaluated through residual correlations between items and the Rasch reliability coefficient was calculated to determine the overall reliability of the scale within the sample. Based on the Rasch analysis, participants were classified into two groups: food secure or mild food insecurity and moderate or severe food insecurity. These groups were used as a grouping variable in the structural equation model.
The associations between intuitive eating subdimensions and dietary intake and whether these associations differed according to food insecurity status and sex were examined using structural equation modelling. Structural equation modelling was preferred because it enables multiple associations among variables to be estimated simultaneously and provides several statistical indices for evaluating how well the hypothesised model represents the observed data(Reference Karaman41). Given the cross-sectional design, the modeled paths were interpreted as associations consistent with the hypothesised theoretical framework rather than as evidence of causal relationships(Reference MacCallum and Austin42). Maximum likelihood estimation, which assumes multivariate normality of the observed variables, was used. Although the treatment of ordinal data in structural equation modelling remains debated, methodological evidence suggests that variables with five or more response categories may be treated as approximately continuous under many conditions(Reference Rhemtulla, Brosseau-Liard and Savalei43). In the present study, the IES-2 subdimension scores were composite scores calculated by averaging multiple items rather than individual ordinal item responses; such composite scores are considered more suitable for continuous-variable methods(Reference Carifio and Perla44). On this basis, the use of maximum likelihood estimation was considered reasonable for the present analysis. Model fit was evaluated using χ 2 to degrees of freedom ratio (χ 2/df), root mean square error of approximation, standardized root mean square residual, incremental fit index, comparative fit index and goodness-of-fit index, and analyses were conducted using Lisrel 8.8 software.
Results
Participants
A total of 545 university students were included in the study. The mean age was 21·59 ± 1·51 years, and 73·95 % of the participants were female. The mean BMI was 22·82 ± 3·99 kg/m², with 63·49 % classified as having normal weight. Overall, 38·54 % of the participants were classified as having moderate or severe food insecurity (Table 1).
Participant characteristics (n 545)

Table 1. Long description
A table summarizing characteristics of 545 university students. The table has 15 rows and 5 columns. Column headers are Characteristic, Mean, SD, n, and %. Row labels include Age (years), Sex (Female, Male), BMI (kg/m^2), BMI classification (Underweight, Normal weight, Overweight, Obese), Living arrangement (Living with family, Living with relatives, Shared student housing, Living alone, Student dormitory), FIES, Food insecurity status (Food secure, Mild food insecurity, Moderate food insecurity, Severe food insecurity), IES-2 total, UPE, EPR, RHSC, and B-FCC. Each row provides specific data points for the characteristics listed.
FIES, Food Insecurity Experience Scale; IES-2, Intuitive Eating Scale-2; UPE, unconditional permission to eat; EPR, eating for physical rather than emotional reasons; RHSC, reliance on hunger and satiety cues; B-FCC, body–food choice congruence.
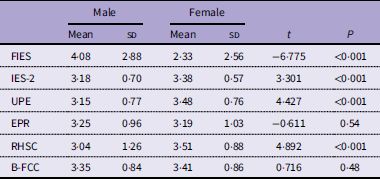
The total IES-2 score was significantly higher in females compared with males (p < 0·001). Similarly, females had higher scores in the UPE and RHSC subdimensions (p < 0·001) (Table 2).
FIES, IES-2 and subdimension scores according to sex

Table 2. Long description
A table comparing scores of FIES, IES-2, and subdimensions between males and females. The table has 7 rows and 7 columns. Column headers are Male Mean, Male SD, Female Mean, Female SD, t, and P. Row labels are FIES, IES-2, UPE, EPR, RHSC, and B-FCC. Row 1: FIES, Male Mean 4.08, Male SD 2.88, Female Mean 2.33, Female SD 2.56, t -6.775, P <0.001. Row 2: IES-2, Male Mean 3.18, Male SD 0.70, Female Mean 3.38, Female SD 0.57, t 3.301, P <0.001. Row 3: UPE, Male Mean 3.15, Male SD 0.77, Female Mean 3.48, Female SD 0.76, t 4.427, P <0.001. Row 4: EPR, Male Mean 3.25, Male SD 0.96, Female Mean 3.19, Female SD 1.03, t -0.611, P 0.54. Row 5: RHSC, Male Mean 3.04, Male SD 1.26, Female Mean 3.51, Female SD 0.88, t 4.892, P <0.001. Row 6: B-FCC, Male Mean 3.35, Male SD 0.84, Female Mean 3.41, Female SD 0.86, t 0.716, P 0.48.
FIES, Food Insecurity Experience Scale; IES-2, Intuitive Eating Scale-2; UPE, unconditional permission to eat; EPR, eating for physical rather than emotional reasons; RHSC, reliance on hunger and satiety cues; B-FCC, body–food choice congruence.
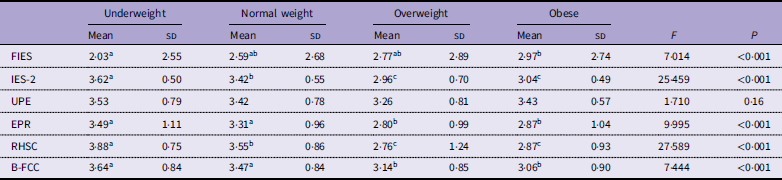
According to BMI classification, IES-2 scores differed significantly (p < 0·001), with participants in the underweight and normal BMI groups having higher scores compared with those in the overweight and obese groups (Table 3).
FIES, IES-2 and subdimension scores according to BMI classification

Table 3. Long description
A table with five rows and eight columns comparing scores across different BMI classifications: Underweight, Normal weight, Overweight, and Obese. The columns are labeled FIES, IES-2, UPE, EPR, RHSC, and B-FCC, with Mean and SD values for each. Row 1: FIES, Underweight Mean 2.03, SD 2.55; Normal weight Mean 2.59, SD 2.68; Overweight Mean 2.77, SD 2.89; Obese Mean 2.97, SD 2.74. Row 2: IES-2, Underweight Mean 3.62, SD 0.50; Normal weight Mean 3.42, SD 0.55; Overweight Mean 2.96, SD 0.70; Obese Mean 3.04, SD 0.49. Row 3: UPE, Underweight Mean 3.53, SD 0.79; Normal weight Mean 3.42, SD 0.78; Overweight Mean 3.26, SD 0.81; Obese Mean 3.43, SD 0.57. Row 4: EPR, Underweight Mean 3.49, SD 1.11; Normal weight Mean 3.31, SD 0.96; Overweight Mean 2.80, SD 0.99; Obese Mean 2.87, SD 1.04. Row 5: RHSC, Underweight Mean 3.88, SD 0.75; Normal weight Mean 3.55, SD 0.86; Overweight Mean 2.76, SD 1.24; Obese Mean 2.87, SD 0.93. Row 6: B-FCC, Underweight Mean 3.64, SD 0.84; Normal weight Mean 3.47, SD 0.84; Overweight Mean 3.14, SD 0.85; Obese Mean 3.06, SD 0.90. The table includes F and P values at the bottom, with F values 7.014, 25.459, 1.710, 9.995, 27.589, and 7.444, and P values all less than 0.001.
FIES, Food Insecurity Experience Scale; IES-2, Intuitive Eating Scale-2; UPE, unconditional permission to eat; EPR, eating for physical rather than emotional reasons; RHSC, reliance on hunger and satiety cues; B-FCC, body–food choice congruence.
a,b,c Mean values within a row with unlike superscript letters were significantly different (P < 0.05; Tukey post hoc test).
The mean total FIES score of the participants was 2·79 ± 2·76. In this study, 31·2 % of participants reported experiencing hunger, and 14·5 % reported going without eating for an entire day during the past 12 months due to insufficient financial or other resources. FIES scores differed significantly by sex (p < 0·001), with males having higher scores than females. Similarly, a significant difference was observed according to BMI classification (p < 0·001), with obese individuals having higher FIES scores compared with underweight individuals (Table 3).
Intuitive eating and food insecurity correlations
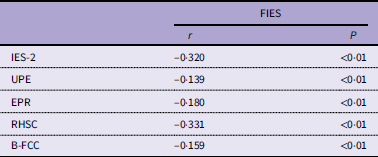
FIES scores were negatively correlated with the IES-2 total score and all its subdimensions (all p < 0·01; Table 4).
Correlations of FIES scores with IES-2 and subdimension scores

Table 4. Long description
A table with six rows and three columns. The columns are labeled ‘r’ and ‘P’. The rows are labeled with different subdimension scores: IES-2, UPE, EPR, RHSC, and B-FCC. The values in the ‘r’ column are -0.320, -0.139, -0.180, -0.331, and -0.159 respectively. The values in the ‘P’ column are all <0.001.
FIES, Food Insecurity Experience Scale; IES-2, Intuitive Eating Scale-2; UPE, unconditional permission to eat; EPR, eating for physical rather than emotional reasons; RHSC, reliance on hunger and satiety cues; B-FCC, body–food choice congruence; r, Pearson correlation coefficient.
Dietary intake
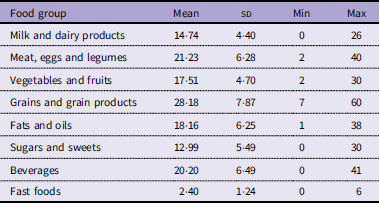
Descriptive statistics for the food group-specific consumption scores are presented in Table 5. Among the food groups examined, the mean consumption scores for sugars and sweets and fast foods were 12·99 ± 5·49 and 2·40 ± 1·24, respectively.
Food group-specific consumption scores

Table 5. Long description
A table with six columns and nine rows. The columns are labeled Food group, Mean, SD, Min, and Max. The rows list different food groups and their corresponding consumption scores. Row 1: Milk and dairy products, Mean: 14.74, SD: 4.40, Min: 0, Max: 26. Row 2: Meat, eggs and legumes, Mean: 21.23, SD: 6.28, Min: 2, Max: 40. Row 3: Vegetables and fruits, Mean: 17.51, SD: 4.70, Min: 2, Max: 30. Row 4: Grains and grain products, Mean: 28.18, SD: 7.87, Min: 7, Max: 60. Row 5: Fats and oils, Mean: 18.16, SD: 6.25, Min: 1, Max: 38. Row 6: Sugars and sweets, Mean: 12.99, SD: 5.49, Min: 0, Max: 30. Row 7: Beverages, Mean: 20.20, SD: 6.49, Min: 0, Max: 41. Row 8: Fast foods, Mean: 2.40, SD: 1.24, Min: 0, Max: 6.
Structural equation modelling
Sex-specific models
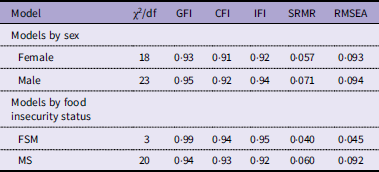
The models estimated separately for female and male participants demonstrated acceptable overall fit (Table 6). The standardised path coefficients between intuitive eating subdimensions and dietary intake scores by sex are presented in Figure 1. In males, significant paths were observed for the intake of milk and dairy products; meat, eggs and legumes; vegetables and fruits and fats and oils (p < 0·05). B-FCC showed positive paths with these food groups (p < 0·05). The dietary intake of sugars and sweets was positively predicted by UPE and RHSC and negatively predicted by EPR (p < 0·05).
Model fit indices of the structural equation models

Table 6. Long description
A table with model fit indices of structural equation models, divided into two main categories: models by sex and models by food insecurity status. The table has 7 rows and 7 columns. The columns are labeled Model, Chi-squared/df, GFI, CFI, IFI, SRMR, and RMSEA. The rows are grouped into two sections: Models by sex and Models by food insecurity status. Under Models by sex, there are rows for Female and Male. Under Models by food insecurity status, there are rows for FSM and MS. Each row contains values for Chi-squared/df, GFI, CFI, IFI, SRMR, and RMSEA. For example, the Female row shows Chi-squared/df as 18, GFI as 0.93, CFI as 0.91, IFI as 0.92, SRMR as 0.057, and RMSEA as 0.093. The Male row shows Chi-squared/df as 23, GFI as 0.95, CFI as 0.92, IFI as 0.94, SRMR as 0.071, and RMSEA as 0.094. The FSM row shows Chi-squared/df as 3, GFI as 0.99, CFI as 0.94, IFI as 0.95, SRMR as 0.040, and RMSEA as 0.045. The MS row shows Chi-squared/df as 20, GFI as 0.94, CFI as 0.93, IFI as 0.92, SRMR as 0.060, and RMSEA as 0.092.
χ²/df, χ 2 to degrees of freedom ratio; GFI, goodness-of-fit index; CFI, comparative fit index; IFI, incremental fit index; SRMR, standardised root mean square residual; RMSEA, root mean square error of approximation, FSM, food secure or mild food insecurity; MS, moderate or severe food insecurity.
Standardised path coefficients between intuitive eating subdimensions and food consumption frequency scores by sex. UPE, unconditional permission to eat; EPR, eating for physical rather than emotional reasons; RHSC, reliance on hunger and satiety cues; B-FCC, body–food choice congruence; F, female; M, male. *p < 0.05.

In females, significant paths were observed for the intake of meat, eggs and legumes; vegetables and fruits; grains and grain products; sugars and sweets and fast foods (p < 0·05). The intake of meat, eggs and legumes was positively predicted by B-FCC (p < 0·05). UPE negatively predicted vegetables and fruits intake and positively predicted the intake of grains and grain products; sugars and sweets and fast foods (p < 0·05). EPR negatively predicted the intake of sugars and sweets and fast foods (p < 0·05).
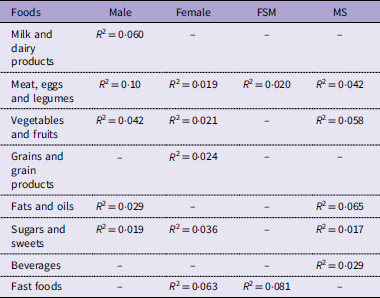
When models were examined across sex, in males, milk and dairy products accounted for 6·0 % of the variance; meat, eggs and legumes for 10·0 %; vegetables and fruits for 4·2 %; fats and oils for 2·9 % and sugars and sweets for 1·9 %. In females, meat, eggs and legumes accounted for 1·9 % of the variance; vegetables and fruits for 2·1 %; grains and grain products for 2·4 %; sugars and sweets for 3·6 % and fast foods for 6·3 % (Table 7).
Explained variance in food consumption scores by intuitive eating according to sex and food insecurity status

Table 7. Long description
A table comparing explained variance in food consumption scores by intuitive eating according to sex and food insecurity status. The table has 7 rows and 4 columns. The columns are labeled Male, Female, FSM, and MS. The rows are labeled with different food categories: Milk and dairy products, Meat, eggs and legumes, Vegetables and fruits, Grains and grain products, Fats and oils, Sugars and sweets, Beverages, and Fast foods. Each cell contains an R-squared value indicating the explained variance for that food category and group. For example, in males, milk and dairy products have an R-squared value of 0.060, while in females, fast foods have an R-squared value of 0.063.
FSM, food secure or mild food insecurity; MS, moderate or severe food insecurity; R 2, coefficient of determination.
Food insecurity-specific models
The models estimated for participants with food security or mild food insecurity and those with moderate or severe food insecurity demonstrated acceptable overall fit (Table 6). The standardised path coefficients between intuitive eating subdimensions and dietary intake scores according to food insecurity status are presented in Figure 2. In the food secure or mildly food-insecure group, significant paths were identified for the intake of meat, eggs and legumes and fast foods (p < 0·05). For fast food consumption, UPE positively predicted intake, whereas EPR and B-FCC negatively predicted intake (p < 0·05). B-FCC positively predicted the intake of meat, eggs and legumes (p < 0·05).
Standardised path coefficients between intuitive eating subdimensions and food consumption frequency scores by food insecurity status. UPE, unconditional permission to eat; EPR, eating for physical rather than emotional reasons; RHSC, reliance on hunger and satiety cues; B-FCC, body–food choice congruence; FSM, food secure or mild food insecurity; MS, moderate or severe food insecurity. *p < 0.05.

In the moderate or severe food insecurity group, significant paths were observed for all food groups except milk and dairy products, grains and grain products, and fast foods (p < 0·05). The intake of meat, eggs, and legumes was negatively predicted by RHSC and positively predicted by B-FCC (p < 0·05). The intake of vegetables and fruits was negatively predicted by EPR and positively predicted by B-FCC (p < 0·05). The intake of fats and oils was positively predicted by UPE and B-FCC (p < 0·05). The intake of sugars and sweets was positively predicted by UPE and RHSC and negatively predicted by EPR (p < 0·05). Beverage consumption was negatively predicted by EPR (p < 0·05).
In the food-secure or mildly food-insecure group, meat, eggs and legumes accounted for 2·0 % of the variance and fast foods for 8·1 %. In the moderate or severe food-insecurity group, meat, eggs and legumes accounted for 4·2 % of the variance; vegetables and fruits for 5·8 %; fats and oils for 6·5 %; sugars and sweets for 1·7 % and beverage intake for 2·9 % (Table 7).
Discussion
This study examined the associations between intuitive eating and dietary intake and found that these associations varied according to sex and food insecurity status. These findings suggest that the relationship between intuitive eating and dietary intake is not uniform but depends on context (Figures 1 and 2). Overall, the B-FCC subdimension was associated with healthier dietary intake, whereas UPE was associated with less healthy dietary intake.
Regarding the primary findings by sex, the associations between intuitive eating subdimensions and dietary intake differed by sex. Interpreting these findings requires consideration of the specific eating attitudes and behaviours represented by each subdimension: UPE reflects eating desired foods without restrictive rules; EPR reflects eating for physical rather than emotional reasons; RHSC reflects reliance on internal hunger and satiety cues and B-FCC reflects selecting foods that support bodily needs and health(Reference Tylka, Calogero and Daníelsdóttir6). In males, the fact that dietary intake is largely associated with the B-FCC subdimension suggests that this subdimension may play a central role in food choice. The finding that B-FCC predicts different food groups in a similar direction indicates that this construct may be associated not with a single food group, but with a broader dietary pattern. Previous studies have also reported that the B-FCC subdimension is positively associated with the intake of dairy products and meat(Reference Horwath, Hagmann and Hartmann17). In contrast, the intake of sugars and sweets is predicted in opposite directions by different intuitive eating subdimensions. The positive prediction of this intake by the UPE and RHSC subdimensions suggests that these dimensions may, in some cases, contribute to increased intake. Similarly, Jackson et al. reported that higher UPE scores are associated with sugar intake(Reference Jackson, Sano and Parker19). On the other hand, the negative prediction of sugars and sweets intake by the EPR subdimension indicates that this subdimension may play a more consistent role in limiting intake. This finding is consistent with studies suggesting that eating based on physical hunger may reduce the intake of sweet and fatty foods(Reference Camilleri, Mejean and Bellisle45). Barad et al. reported a negative relationship between the RHSC subdimension and the intake of vegetables and fruits among male students(Reference Barad, Cartledge and Gemmill14). In contrast, in the present study, the intake of vegetables and fruits among male students was positively predicted by the B-FCC subdimension.
Among female participants, intuitive eating subdimensions were associated with dietary intake in different directions. The B-FCC subdimension positively predicts the dietary intake of meat, eggs and legumes, in line with previous literature(Reference Horwath, Hagmann and Hartmann17,Reference Jackson, Sano and Parker19) . In contrast, the UPE subdimension negatively predicts the dietary intake of vegetables and fruits, while positively predicting the intake of grains and grain products, sugars and sweets and fast foods. The presence of opposing associations across different food groups is noteworthy. This finding is consistent with studies reporting that UPE is positively associated with energy intake and added sugar intake(Reference Jackson, Sano and Parker19,Reference Camilleri, Mejean and Bellisle45) .
This suggests that the UPE subdimension may not always be associated with healthy eating. Particularly in environments where energy-dense and low-nutrient foods are more accessible, this subdimension may contribute to increased intake. The EPR subdimension negatively predicts the dietary intake of sugars and sweets and fast foods. In the literature, EPR has also been reported to be associated with lower energy intake and lower intake of sweet and fatty foods(Reference Jackson, Sano and Parker19,Reference Camilleri, Mejean and Bellisle45) . However, some studies have reported a positive association between EPR and the dietary intake of vegetables and fruits(Reference Barad, Cartledge and Gemmill14). When these findings are considered together, the EPR subdimension may play a regulatory role in eating behaviour. Overall, the associations of intuitive eating subdimensions on dietary intake among female participants appear to be inconsistent.
With regard to food insecurity-specific findings, in situations where food insecurity is present, these relationships may become more complex. The findings of the present study are partially consistent with the literature. In individuals with moderate or severe food insecurity, the fact that some food groups are predicted in opposite directions by different subdimensions may suggest that intuitive eating processes might exhibit a more heterogeneous structure in this context.
In the study by Jackson et al., UPE scores were reported to be positively associated with added sugar consumption among individuals experiencing food insecurity; in contrast, the B-FCC subdimension was negatively associated with added sugar consumption and positively associated with fruit consumption(Reference Jackson, Sano and Parker19). It has also been reported that individuals with food insecurity tend to consume more added sugar, less fruit and vegetables and less lean protein, while showing an increased tendency towards energy-dense and nutrient-poor foods(Reference Larson, Laska and Neumark-Sztainer46–Reference Graham, Haskell-Ramsay and Fothergill48).
More broadly, food insecurity has been shown to negatively affect not only the quantity of food but also dietary quality and diversity(Reference El Bilbeisi, Al-Jawaldeh and Albelbeisi49). In a study conducted among university students, individuals experiencing food insecurity were found to have lower consumption of fruits and vegetables and higher intake of added sugar and sugar-sweetened beverages(Reference Mei, Fulay and Wolfson50). The tendency of food-insecure individuals to prefer cheaper, energy-dense and nutrient-poor foods due to economic constraints has been explained by a substitution effect in dietary patterns(Reference Morales and Berkowitz51). Therefore, the ability of individuals to make food choices based on internal cues is constrained under conditions of food insecurity(Reference Graham, Haskell-Ramsay and Fothergill48). Based on this conceptual framework, the fact that intuitive eating subdimensions do not always predict dietary intake in the expected direction may be explained by individuals being forced to make choices based on environmental constraints despite their internal signals. The feast-or-famine cycle described in food-insecure individuals further supports this interpretation. Fluctuations in food access may weaken hunger and satiety cues and lead to more irregular eating behaviours, thereby limiting the functionality of intuitive eating processes(Reference Hazzard, Loth and Hooper52). Taken together, the associations between intuitive eating subdimensions and dietary intake under conditions of food insecurity may not be fully understood without considering the environmental context in which the individual lives.
Despite these significant findings, the low R² values indicate that intuitive eating subdimensions explained only a small proportion of the variance in dietary intake (Table 7). Dietary intake is a multifactorial behaviour that may also be influenced by food availability, socio-economic conditions, individual preferences, living arrangements and other contextual factors not included in the models. Therefore, the statistically significant paths should be interpreted as modest and context-specific associations rather than as strong predictors of dietary intake.
Turning to the secondary findings, the BMI distribution and intuitive eating scores in the present sample showed both similarities and differences compared with previous university-based studies. A previous study reported that 72·0 % of university students were within the normal BMI range, while 12·8 %, 14·1 % and 1·1 % were classified as underweight, overweight and obese, respectively(Reference Özkan and Bilici53). In the present study, the mean BMI was 22·82 (sd 3·99), and most participants were within the normal BMI range (63·49 %). However, the proportions classified as overweight (20·18 %) and obese (5·50 %) were higher than those reported in the previous study, whereas the proportion classified as underweight was slightly lower (10·83 %). Previous university-based studies have reported mean total IES-2 scores ranging from 3·08 (sd 0·49) to 3·20 (sd 0·33)(Reference Baş, Karaca and Sağlam37,Reference Özkan and Bilici53) . The mean total IES-2 score in the present study was 3·33 (sd 0·62), while the mean subdimension scores ranged from 3·20 to 3·40. Although the total score was slightly higher than previously reported values, it was broadly comparable with those observed in other university samples. Overall, these findings suggest that participants demonstrated a tendency towards intuitive eating and are generally consistent with the existing literature(Reference Barad, Cartledge and Gemmill14,Reference Baş, Karaca and Sağlam37,Reference Özkan and Bilici53–Reference Tabatabai, Holland and Curtis55) .
Regarding food insecurity frequency, studies conducted among university students indicate that the prevalence of food insecurity is generally high, although it varies across studies. These differences across studies may be related to variations across countries, study populations, measurement instruments and contextual factors. In a study by Theodoridis et al., only 17·8 % of students were reported to be food secure, while the majority experienced food insecurity at different levels(Reference Theodoridis, Grammatikopoulou and Gkiouras56). Mei et al. reported that 14 % of students experienced food insecurity(Reference Mei, Fulay and Wolfson50), whereas Stocker and Seher found that 70 % of participants experienced food insecurity(Reference Stocker and Seher54), with 42 % classified as having low and 28 % as very low food security. In this sample, 38·5 % of participants experienced moderate or severe food insecurity (Table 1). These differences across studies may be related to variations in study populations and contextual factors.
Additionally, a considerable proportion of participants in the present study were living away from their family homes, which may have implications for food access and security. According to the Turkey Nutrition and Health Survey 2019, the proportions of individuals who experienced hunger and all-day hunger during the past 12 months due to insufficient financial or other resources were 8·4 % and 2·6 %, respectively(38). Compared with national data, the higher prevalence of hunger observed in the present study may highlight the vulnerability of university students as a specific population group.
Furthermore, food insecurity may have implications beyond restricted access to food, potentially affecting eating behaviours and the capacity to eat intuitively. In a study conducted by Stocker and Seher, students with and without food security were reported to have similar scores across the IES-2 subdimensions(Reference Stocker and Seher54). The same study also indicated that students with very low food security may exhibit impaired intuitive eating abilities. Some studies have reported a negative association between food insecurity and intuitive eating scores(Reference Burnette, Hazzard and Larson29,Reference Ünal and Esgin57) . Individuals with food security have been shown to have higher total IES-2 scores and higher scores on the EPR subdimension(Reference Jackson, Sano and Parker19). Consistent with these findings, food insecurity was negatively associated with intuitive eating scores in this sample (Table 4). These results suggest that food insecurity may play an important role in intuitive eating behaviour, particularly in contexts where access to food is constrained.
This study has several strengths. One of the main strengths of this study is that the associations between intuitive eating, food insecurity and dietary intake were examined within a comprehensive framework using sem. Additionally, the estimation of separate models according to sex and food insecurity status allowed a more detailed evaluation of these associations at the subgroup level. This multidimensional approach allows for a more nuanced examination of intuitive eating subdimensions and improves the interpretability of the model. It also provides a deeper understanding of how intuitive eating subdimensions operate across different contexts.
However, the study also has some limitations. The cross-sectional design limits the ability to draw causal inferences regarding the relationships between variables. Data were collected through an online survey, and body weight and height were self-reported rather than objectively measured. In addition, although certain precautions were taken, such as excluding participants based on implausibly short survey completion times, the use of self-reported data may still introduce biases such as recall bias and social desirability bias. The fact that the sample consisted only of university students limits the generalisability of the findings. Furthermore, the structural models were not adjusted for potential confounding factors such as age, BMI and living arrangements; therefore, residual confounding cannot be excluded. Future studies with larger samples should examine whether these associations remain after adjustment for relevant covariates. Nevertheless, the consistent patterns observed across different subgroups suggest that the identified associations are robust.
Despite these limitations, this study contributes to the literature by examining the associations between intuitive eating and dietary intake using an sem approach. The findings provide insight into how these associations differ by sex and food insecurity status.
Conclusions
In conclusion, this study demonstrates that intuitive eating subdimensions are associated with dietary intake in distinct and sometimes opposing directions, and that these associations vary according to sex and food insecurity status. The findings suggest that intuitive eating may not operate as a unidimensional or fully uniform construct, as its subdimensions appeared to function differently across food groups and contextual conditions. These results highlight the importance of evaluating intuitive eating at the subdimension level rather than relying solely on total intuitive eating scores and may support further conceptual consideration of the construct across different settings. Among the subdimensions, body–food choice congruence was generally associated with healthier dietary intake patterns, whereas unconditional permission to eat was more frequently linked to less healthy dietary patterns. In contrast, reliance on hunger and satiety cues appeared to be more context-dependent, with its associations differing across food groups and conditions. These findings suggest that dietary intake may be shaped not only by internal cues but also by food access and environmental constraints. Overall, the findings indicate that intuitive eating may not consistently be associated with healthier dietary patterns, particularly under conditions of food insecurity. Therefore, approaches based solely on intuitive eating principles may not fully account for the broader contextual factors influencing dietary behaviours. Particularly in the context of food insecurity, improving dietary behaviours may require not only individual-level approaches but also strategies aimed at improving food access. Future studies using longitudinal and intervention-based designs are needed to provide a clearer understanding of how intuitive eating subdimensions function across different socioeconomic contexts. Further research may also help clarify whether the conceptual structure and functioning of intuitive eating subdimensions should be reconsidered across different contextual conditions.
Data availability statement
The data that support the findings of this study are available from the corresponding author upon reasonable request. The data are not publicly available due to privacy and ethical considerations.
Acknowledgements
This study was based on the first author’s master’s thesis. The first author was supported by the TÜBİTAK 2210/A National MSc/MA Scholarship Program during her master’s studies. The authors would like to thank Dr. Haydar Karaman for his valuable guidance in the statistical analysis of this study. The first author dedicates this work to the memory of her grandmother, Hanife Tosun, who supported her throughout her life.
Author contributions
AÖ: Conceptualisation, Data collection, Data analysis, Writing – Original draft, Writing – Review & Editing. NA: Conceptualisation, Supervision, Writing – Review & Editing.
Financial support
This research did not receive any specific grant from funding agencies in the public, commercial or not-for-profit sectors.
Competing interests
No conflict of interest was declared by the authors.
Consent to participate
All participants provided written informed consent for participation and anonymised publication.




 Open access

