Introduction
Steppe and farmland birds are currently experiencing significant declines throughout the world, mainly due to land-use change and agriculture intensification (Onrubia and Andrés Reference Onrubia, Andrés, Bota, Morales, Mañosa and Camprodon2005, Donald et al. Reference Donald, Sanderson, Burfield and van Bommel2006, Vorisek et al. Reference Vorisek, Jiguet, van Strien, Skorpilova, Klvanova and Gregory2010). Farmland birds are considered a group of high conservation concern (BirdLife International 2018), since agricultural habitats host a large proportion of birds with a threatened conservation status in Europe (BirdLife International 2004, Burfield Reference Burfield, Bota, Morales, Mañosa and Capmrodon2005) and farmland birds have declined the most rapidly (Inger et al. Reference Inger, Gregory, Duffy, Stott, Voříšek and Gaston2015, Rosenberg et al. Reference Rosenberg, Dokter, Blancher, Sauer, Smith, Smith, Stanton, Panjabi, Helft, Parr and Marra2019). Birds relying on extensive agriculture are indeed threatened worldwide: bustards (Otididae) are a prime example, as a family of birds living in open, farmed, or grazed landscapes in Asia, Africa, Europe, and Australia. Bustards are well adapted to open lands, but the ecological traits that lend to this adaptation also make them highly susceptible to land-use changes (Collar Reference Collar, Del Hoyo, Elliot and Sargatal1996, Collar et al. Reference Collar, Baral, Batbayar, Bhardwaj, Brahma, Burnside, Choudhury, Combreau, Dolman, Donald, Dutta, Gadhavi, Gore, Goroshko, Hong, Jathar, Jha, Jhala, Koshkin, Lahkar, Liu, Mahood, Morales, Narwade, Natsagdorj, Nefedov, Silva, Thakuri, Wang, Zhang and Kessler2017). Indeed, eight of the 26 recognized species (31%) are threatened, while seven (27%) more are ‘Near Threatened’, which is about three times higher than other bird rates (Collar et al. Reference Collar, Baral, Batbayar, Bhardwaj, Brahma, Burnside, Choudhury, Combreau, Dolman, Donald, Dutta, Gadhavi, Gore, Goroshko, Hong, Jathar, Jha, Jhala, Koshkin, Lahkar, Liu, Mahood, Morales, Narwade, Natsagdorj, Nefedov, Silva, Thakuri, Wang, Zhang and Kessler2017, BirdLife International 2018). There are very few recent complete accounts of the global population status (size or trends) or distribution range changes for a bustard species (see, for example, Palacín and Alonso Reference Palacín and Alonso2008 and Alonso and Palacín Reference Alonso and Palacín2010 for the Great Bustard Otis tarda).
The Little Bustard Tetrax tetrax is a Palearctic bustard inhabiting natural grasslands and agricultural landscapes. It is an iconic species of Palearctic farmland and grassland ecosystems and is considered a good indicator of healthy grassland and farmland bird communities (Bretagnolle et al. Reference Bretagnolle, Denonfoux and Villers2018, Traba and Morales Reference Traba and Morales2019). It disappeared from large areas of its original distribution during the 20th century (Cramp and Simmons Reference Cramp and Simmons1980, Schulz Reference Schulz1985, Collar Reference Collar, Del Hoyo, Elliot and Sargatal1996), and has steeply declined in many others (Jolivet and Bretagnolle Reference Jolivet and Bretagnolle2002, García de la Morena et al. Reference García de la Morena, Bota, Mañosa and Morales2018). The species’ world distribution extends from Portugal to north-western China (BirdLife International 2020). Although Little Bustards’ preferred habitats, i.e. steppes, grasslands, and cereal farmland, are widespread throughout this range, two markedly disjoint sub-ranges formed c.40 years ago: a western breeding range, whose core is located in the Iberian Peninsula, and the eastern breeding range, which harbours the populations of south Russia, Ukraine, Kazakhstan, Kyrgyzstan, north-west China, northern Iran, and Turkey. These two subpopulations are now separated by a gap of c.2,900 km, and indeed these two nuclei were assigned to different subspecies (T. t. tetrax and T. t. orientalis, respectively), although the species is now considered monotypic (Collar Reference Collar, Del Hoyo, Elliot and Sargatal1996). In both nuclei, migratory as well as resident populations occur, the latter encompassing breeding populations in the wintering areas used by its corresponding migratory populations (Cramp and Simmons Reference Cramp and Simmons1980, Villers et al. Reference Villers, Millon, Jiguet, Lett, Attié, Morales and Bretagnolle2010, Gauger Reference Gauger2007, Sehhatisabet et al. Reference Sehhatisabet, Abdi, Ashoori, Khaleghizadeh, Khani, Rabiei and Shakiba2012).
Using available information, our aim here is to provide a thorough and up-to-date description of the changes that occurred across the species’ distribution range during the previous and current centuries and review the population status and trends throughout that range. We provide the most accurate global estimate of the world population currently available, as well as estimates of the two nuclei, assessing the main threats affecting the species in different parts of its range. Finally, we discuss the implications of these estimates and trends in relation to the species’ world conservation status. The Little Bustard has been classified as ‘Vulnerable’ in Europe in 1994, 2004 and 2015 (BirdLife International 2015), but may be upgraded in future reassessments. It is listed in Annex I of the EU’s Birds Directive as well as in Annex II of the Bern Convention, and it has recently been included in Annexes I and II of the Bonn Convention on Migratory Species (https://www.cms.int/en/species/appendix-i-ii-cms). Its current global conservation status on the IUCN Red List is ‘Near Threatened’ (BirdLife International 2020). The Little Bustard is a challenging case study, in which two isolated and ecologically distinct populations of roughly equivalent size show opposite trends. Based on our review results, we draw attention on the fact that a common overall conservation status for these two nuclei may not be an efficient global conservation strategy, and thus advocate for their treatment as separate conservation units.
Methods
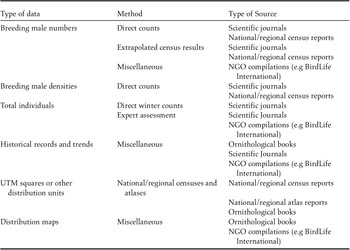
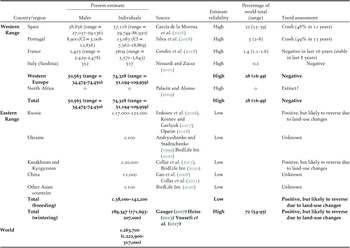
We systematically reviewed all recent published results of Little Bustard censuses, surveys, trends, and distribution assessments throughout the species’ entire range. We focused mainly on the breeding season, although information on winter numbers and distribution was also used to complete our assessments. We used a variety of data sources, including papers published in scientific journals and books (including field guides), as well technical reports, bird atlases and other documents supported by local or international conservation authorities and/or organizations (e.g. BirdLife International, EBCC, local BirdLife partners, and public administrations). Our search was not limited to per-country figures, and we also compiled data from different regions within countries when available. The different types of data and data sources used are summarized in Table 1. We assessed the quality of estimates under three categories: “High quality” estimates are based on standardized and repeatable survey methods; “Medium quality” estimates are based on repeatable survey methods available only for a part of the territory considered, and expert guesses for the remaining part; while “Low quality” estimates are based only on expert guesses. In addition, when available in the literature, we compiled error measures as either ranges or 95% confidence intervals. In some cases. we estimated the range of population estimates from values obtained from different literature sources. To avoid overestimation of accuracy, medium and low-quality estimates were rounded to the thousands and given as approximate (see Table 3).
Different types of data used in this revision. The general method used to produce the data and the type of source providing them are also presented.

Population estimates for the western range are based on breeding surveys, and thus provided as number of males, while those from the eastern range are mainly based on post-breeding surveys and given as total number of individuals. In order to derive an estimate of total individuals from males in western countries, we used a sex ratio value provided in a recent study of adult sex ratio in Little Bustard populations across most of Western Europe (France, Spain, and Portugal). This value, the median proportion of adult females plus female-like individuals in the populations studied across those countries, was estimated at 0.47 (Serrano-Davies et al. Reference Serrano-Davies, Traba, Arroyo, Mougeot, Cuscó, Mañosa, Bota, Faria, Villers, Casas, Devoucoux, Bretagnolle and Moralesin review). The world estimate was calculated as the sum of total individuals in the western range and the winter estimate of total individuals in the eastern range. Percentages in relation to the total world population were obtained for countries and regions with high quality estimates. Finally, a qualitative trend assessment was made for each country/region based on the sources reviewed.
Results
Historical (pre-1980) changes in distribution range, population status and trends
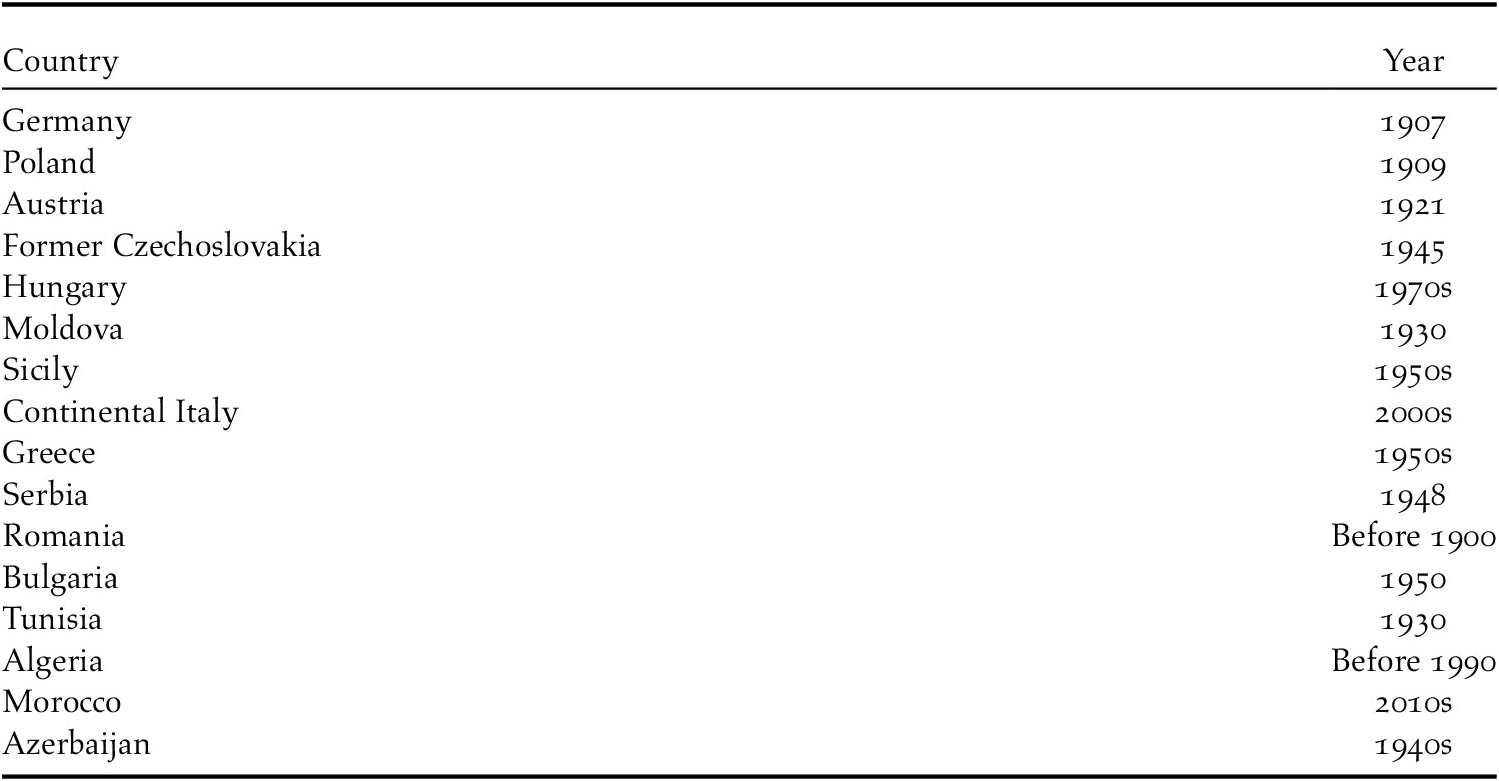
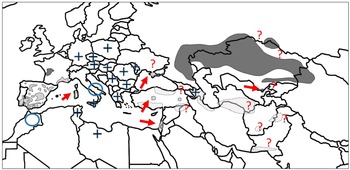
Until the early 20th century, the Little Bustard was probably distributed throughout a Palearctic longitudinal belt between 30ºN and 50ºN, breeding in most countries of southern and central Europe, northern Africa, the Middle East, and central Asia (Cramp and Simmons Reference Cramp and Simmons1980). In the Western Palearctic, until 1940, the species still bred in large areas of the Iberian Peninsula, France, the Pannonian region and the Danube valley, Ukraine, and southern Russia. It was also present, though more patchily, in north-eastern Germany, Italy (on both the continent and the two large islands of Sicily and Sardinia) and northern Greece, as well in north-western Morocco, northern Algeria, Tunisia, western Anatolia, Syria, and the Caucasus (Schulz Reference Schulz1985). However, by mid-century, the Little Bustard breeding range had dramatically shrunk. Apart from the Iberian and Russian strongholds, the Little Bustard had disappeared from most of its former European range (see Table 2 for extinction dates across a range of countries). By 1980, two relict nuclei remained in Hungary and Crimea, but the small breeding range of northern Greece had already disappeared, and the French population was scattered over the central-western plains and the Mediterranean arch (Schulz Reference Schulz1985), while Italian birds were restricted to a relict population with a few tens of individuals in Apulia (south-eastern Italy), and a larger one in Sardinia (Schulz Reference Schulz1985, Petretti Reference Petretti, Gafta and Akeroyd2006). This was basically the European distribution reported in the first European Atlas of Breeding Birds, which compiled data from the early 1970s to the mid-1990s (Hagemeyer and Blair Reference Hagemeijer and Blair1997). Likewise, by 1980 only three relict African populations remained in northern Morocco (Palacín and Alonso Reference Palacín and Alonso2009), while the presence of the species in Syria and Turkey was already in doubt (Schulz Reference Schulz1985). Thus, in less than 100 years, the geographical range of the Little Bustard experienced dramatic fragmentation and contraction, which led to the markedly disjunct distribution formed by the current eastern and western breeding sub-ranges. In the process of range fragmentation, the species has gone extinct in at least nine countries or regions of the western Palearctic (Table 2). Figure 1 summarizes the 2020 distribution range of the Little Bustard. Above we review trends since 1980 in those countries or regions where data were sufficient to assess population size and trends. Population size estimates are compiled in Table 3, which also presents an estimate of the world population size.
Estimated year or decade of extinction of the Little Bustard as a breeder over the 20th and early 21st centuries in different countries and regions of the western Palearctic. Based on Schulz (Reference Schulz1985), Snow and Perrins (Reference Snow and Perrins1998), and G. Palumbo (pers. comm.), Cherkaoui et al. (Reference Cherkaoui, El Yaacoubi, Aghzar, El Yousfi and Qninba2020) and Patrikeev (Reference Patrikeev2004) for continental Italy, Morocco, and Azerbaijan, respectively.

Synthesis of national and regional Little Bustard populations for the Western and Eastern distribution ranges. Western range: the total number of individuals is derived from the number of males using the regional sex ratio estimated in Serrano-Davies et al. (Reference Serrano-Davies, Traba, Arroyo, Mougeot, Cuscó, Mañosa, Bota, Faria, Villers, Casas, Devoucoux, Bretagnolle and Moralesin review; see Methods). Eastern range: only the total number of individuals is available in the literature. Error measures are provided when available in literature, either as range, or as 95% confidence intervals (CI). The quality of estimates is assessed as follows: High= based on standardized and repeatable survey methods; medium= repeatable method-based surveys available only for a part of the territory and based on expert guesses for the remaining; low= based only on expert guesses. To avoid optimistic bias in accuracy, medium and low-quality estimates are rounded to the thousands and given as approximate (circa, c.). The world estimate is the sum of the Western range (extrapolated to individuals) and the winter Eastern range figures (rounded to the hundreds), while percentages in relation to the total world population are given only for high quality estimates. A qualitative trend assessment is provided for each country/region.

Updated world distribution of the Little Bustard. Pointed patches represent areas where the species is mainly resident or partial migrant and grey ones correspond to areas where it is basically a breeding visitor. Light grey patches with dashed limits indicate wintering areas. Based on Birdlife International (2020) and updated with results from different sources used in this revision. Spain: Spanish national census (García de la Morena et al. Reference García de la Morena, Bota, Mañosa and Morales2018); Portugal: Silva and Pinto (Reference Silva and Pinto2006) and 2nd European Atlas of Breeding Birds (Keller et al. Reference Keller, Herrando, Voříšek, Franch, Kipson, Milanesi, Martí, Anton, Klvaňová, Kalyakin, Bauer and Foppen2020); France: French national count (Gendre et al. Reference Gendre, Éraud, Bretagnolle and Dalloyau2018) and 2nd European Atlas of Breeding Birds (Keller et al. Reference Keller, Herrando, Voříšek, Franch, Kipson, Milanesi, Martí, Anton, Klvaňová, Kalyakin, Bauer and Foppen2020); Sardinia: 2nd European Atlas of Breeding Birds (Keller et al. Reference Keller, Herrando, Voříšek, Franch, Kipson, Milanesi, Martí, Anton, Klvaňová, Kalyakin, Bauer and Foppen2020); eastern Europe: 2nd European Atlas of Breeding Birds (Keller et al. Reference Keller, Herrando, Voříšek, Franch, Kipson, Milanesi, Martí, Anton, Klvaňová, Kalyakin, Bauer and Foppen2020); Turkey: 2nd European Atlas of Breeding Birds (Keller et al. Reference Keller, Herrando, Voříšek, Franch, Kipson, Milanesi, Martí, Anton, Klvaňová, Kalyakin, Bauer and Foppen2020) and Kirwan et al. (Reference Kirwan, Byla, Castell, Demirci, Özen, Welch and Marlow2008); Kazakhstan: Wassink and Orel (Reference Wassink and Oreel2007), Ayé et al. (Reference Ayé, Schwizer and Roth2014) and Wassink (Reference Wassink2016). Circles: recent extinctions reported in this revision; crosses: documented historical extinctions; question marks: doubtful reports. Arrows highlight small relict populations, either breeding or wintering.

Western range
At present, Little Bustard populations are found in Spain, Portugal, France, and Italy. The former populations of northern Africa can be considered on the very brink of extinction (see below).
Spain
Schulz (Reference Schulz1985) tentatively estimated the Spanish Little Bustard population at 50,000–70,000 individuals and considered the species widespread in the country’s main agricultural plains, i.e. the Northern and Southern Plateaus, Extremadura, the Ebro and Guadalquivir valleys. Based on censuses carried out in 1993–1994 in known Little Bustard sites, De Juana and Martínez (Reference De Juana and Martínez1996) provided a much higher estimate of 100,000–200,000 males and extended the species’ range to the south and east, which was confirmed by the Spanish Atlas of Breeding Birds (García de la Morena et al. Reference García de La Morena, De Juana, Suárez, Morales, Martínez, Martí and del Moral2003). Although no trend estimate was available at the time, De Juana and Martínez (Reference De Juana and Martínez1996) detected a pattern of population fragmentation as well as isolation in peripheral areas traditionally regarded as important for the species (e.g. Northern Plateau, Andalucía, and the Ebro Valley). García de la Morena et al. (Reference García de La Morena, De Juana, Suárez, Morales, Martínez, Madroño and Martí2004) reviewed regional population sizes and trends available for the 1990s and early 2000s, confirming fragmentation and negative trends in most Spanish populations, both central and peripheral. For example, in the traditional stronghold of Extremadura, the species declined by 40% in nine years, while in the peripheral populations of Navarra and Catalonia the decrease was 27% in four years and 25–54% in six years, respectively. However, no reliable trend was available for the entire country, partly due to the lack of data from the Southern Plateau, which harboured the bulk of the Spanish population. In 2005, a first Spanish national breeding survey was carried out, resulting in a new but still broad estimate of 43,000–71,700 individuals (García de la Morena et al. Reference García de la Morena, Bota, Ponjoan and Morales2006). Although this figure cannot be directly compared to that provided by De Juana and Martínez (Reference De Juana and Martínez1996) due to methodological differences, its much lower values clearly suggested an overall decline in the species in Spain between the mid-1990s and the mid-2000s, consistent with the regional decreases reported in that period (García de la Morena et al. Reference García de la Morena, Bota, Ponjoan and Morales2006). This national census confirmed the fragmentation and isolation of populations in peripheral areas and suggested an increasing rarity in traditional core regions (García de la Morena et al. Reference García de la Morena, Bota, Ponjoan and Morales2006).
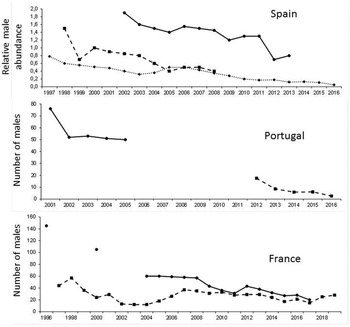
Since 2005, evidence for decline has been confirmed in male counts: 65% decline in key Little Bustard areas of Extremadura over 1993–2008 (De Juana Reference De Juana2009, Figure 3a), an average 61% decline (range 30–100%) in eight populations of the Madrid region over 2000–2007 (Morales et al. Reference Morales, García de la Morena, Delgado, Traba, la Puente, Pérez-Tris, Juan and Bermejo2007), 56% and 55% declines in male and female densities respectively in a SPA of the Southern Plateau over 2002–2014 (Casas et al. Reference Casas, Mougeot, Arroyo, Morales, Hervás, García de La Morena, Fagan and Viñuela2019, Figure 3), and 50% and 75% declines in the number of males and females respectively over the same period in Catalonia (Mañosa et al. Reference Mañosa, Bota, Estrada and Cuscó2015). In addition, the analysis of the data from the Spanish Common Breeding Bird Monitoring Program (SACRE) yielded an overall population trend of -76.19%, and a mean yearly population trend of -5.4 (CI: -6.3 to -4.5) over 1998–2018 (SEO/BirdLife 2018), indicating an alarming population decrease. Winter surveys fully confirm these trends: Morales et al. (Reference Morales, Arroyo and Traba2015) reported an overall reduction of 76% of total numbers wintering in some key areas of central Spain between the winters of 2003–2004 and 2013–2014. Finally, a second national breeding survey carried out in 2016 using the same methodology as the first, yielded a new estimate of 38,856 breeding males (range 27,037–59,136), which would imply a total population of 51,808 individuals (see Garcia de la Morena et al. Reference García de la Morena, Bota, Mañosa and Morales2018 for calculations based on sex-ratio estimates). Eighty-seven percent of the population was concentrated in the southern half of the country, with the Southern Plateau harbouring c.65% of the total. The population of the northern half is considerably smaller, with most of the birds concentrated in the Ebro valley and some areas in the Northern Plateau. The estimated reduction of the total number of breeding males in Spain is 48% in just 11 years (Table 3), which corresponds to an average yearly decrease of 5.7%. On average, male densities (number of birds/km2 per 10 x 10 UTM cell) decreased by 38% (range 25–67%). National winter surveys carried out in the same years (2005–2006 and 2016–2017), though yielding much smaller total estimates since counts are incomplete, suggest exactly the same trend: from 16,429–35,929 to 6,668–29,848 individuals, i.e. a 38-50% decline despite substantial methodological differences (García de la Morena et al. Reference García de la Morena, Bota, Ponjoan and Morales2006, Reference García de la Morena, Bota, Mañosa and Morales2018). The Spanish population of Little Bustard, although probably still the largest population worldwide, is currently crashing at a 5-6% annual decline rate.
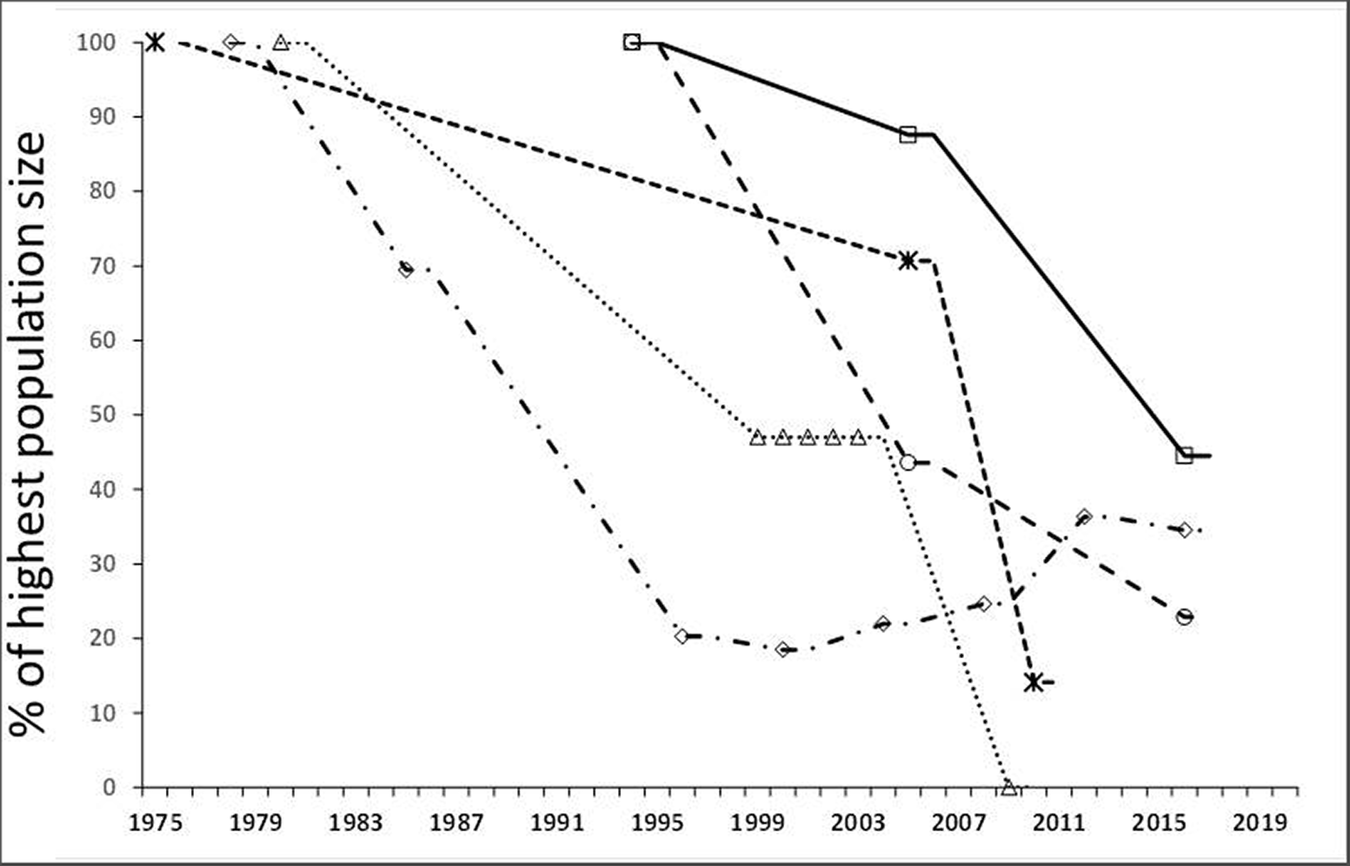
Trends of Little Bustard populations in different countries of the Western Palearctic. Data are presented as a percentage of highest population size (symbols) to allow easy comparison between countries. Although for some countries (Spain, Portugal) the comparison between early and recent estimates must be made with caution (see text), the trajectories (shown as mobile-mean trend lines) illustrate the different times in which significant population declines occurred. Solid line and open squares: Portugal; long-dashed line and open circle: Spain; short-dashed line and asterisks: Italy; dotted line and open triangles: Morocco; dashed-and-dotted line and open diamonds: France.

Portugal
Portugal holds the second largest Little Bustard population in the species’ western range, largely connected with the Spanish population of Extremadura (Silva Reference Silva2010). The first published population size estimates were 10,000–20,000 individuals (Goriup Reference Goriup, Tucker and Heath1994). A national census conducted in spring 2005 yielded 17,515 males, i.e. c.35,030 individuals under a 1:1 adult sex ratio (Silva and Pinto Reference Silva and Pinto2006), a figure to be treated with caution given the biased sex ratios detected in other Iberian populations (Silva Reference Silva2010, García de la Morena et al. Reference García de la Morena, Bota, Mañosa and Morales2018). Between 90% and 95% of this population occurs in the Alentejo region, south of the Tagus River. The result of this first Portuguese national census cannot be directly compared with previous estimates due to methodological differences, and thus population trends could not be well assessed (Silva Reference Silva2010). A second national census conducted in 2016 yielded an estimate of 8,900 breeding males (95% CI: 5,008–12,836), i.e. a 49% reduction between 2003 and 2016 (Silva et al. Reference Silva, Correia, Alonso, Martins, D’Amico, Delgado, Sampaio, Godinho and Moreira2018). The Portuguese population of Little Bustard is therefore currently declining at the same overall rate as the Spanish one. Figure 3 illustrates this trend in two localities of Alentejo.
France
The Little Bustard trends in France have been most continuously monitored, with censuses carried out in 1980, 1995, 2000, 2004, 2008, 2012 and 2016, and distribution updates published in the French Bird Atlas in 1976, 1994 and 2015. Published records even date back to the late 19th century (Ternier Reference Ternier1892): the species was common, although irregularly distributed and fluctuating until the 1930s–1950s (Yeatman Reference Yeatman1976). At that time, the Little Bustard was still distributed over all the main agricultural plains, including Poitou-Charentes, Beauce and Champagne (respectively, western, and northern regions of the country), the pastures of Limagne and les Causses (close to the Massif Central), and the lower valleys of Rhône and Durance, in the Mediterranean arch ranging from Narbonne to Camargue (Yeatman Reference Yeatman1976, Issa and Muller Reference Issa and Muller2015). A national census carried out in spring 1978–1979 provided the first quantitative estimate of the Little Bustard population in France: 7,200 males (André Reference André1985), with a clear split in the distribution between the two main nuclei, whose populations differed in ecology and migration behaviour. The migratory population (6,800 males) inhabited intensive cereal farmland from central-western to eastern France (hereafter, the ‘western population’), while the southern sedentary one (400 males) was located from the Languedoc to the Provence regions and occupied dry Mediterranean grasslands (hereafter, the ‘Mediterranean population’). In 1985, the national population was estimated at 5,000 males (with 400 in the Mediterranean population: Jolivet and Bretagnolle Reference Jolivet and Bretagnolle2002), but only at 1,460 males in 1995–1996 (Jolivet and Bretagnolle Reference Jolivet and Bretagnolle2002, revised in Gendre et al. Reference Gendre, Éraud, Bretagnolle and Dalloyau2018), of which 648 belonged to the western and 812 to the Mediterranean population. A third national census performed in 1999–2000 yielded a total of 1,300 males (460 in western and 840 in Mediterranean populations: Jolivet and Bretagnolle Reference Jolivet and Bretagnolle2002). In summary, the Little Bustard population of western France had experienced a 94% decline in 22 years, while at the national scale the decrease was 82%, the steepest ever documented for a bird species in France (Jolivet and Bretagnolle Reference Jolivet and Bretagnolle2002). Conversely, the Mediterranean population remained stable over that period and even slightly increased. After 2000, the western population seems to have stabilized at around 300–340 males (thanks to a combination of conservation measures, including agri-environmental contracts and population reinforcement, Bretagnolle et al. Reference Bretagnolle, Villers, Denonfoux, Cornulier, Inchausti and Badenhausser2011, Bretagnolle et al. Reference Bretagnolle, Denonfoux and Villers2018), as shown by the national censuses carried out in 2004, 2008 and 2012 (Gendre et al. Reference Gendre, Éraud, Bretagnolle and Dalloyau2018; see Figure 3c for trends in two areas of Poitou-Charentes). The Mediterranean population has steadily increased from 1,114–1,283 males in 2004 to 1,329–1,483 and 2,021–2,331 males estimated in 2008 and 2012, respectively, due to crop abandonment over the last decade favoured by EU’s agricultural policy, as well as to land expropriation for construction of a high-speed railway (Devoucoux Reference Devoucoux2014). The latest national spring census, carried out in 2016, yielded a total of 2,455 males (range: 2,429–2,478), 313 of which belong to the western population and 2,142 to the Mediterranean one (Gendre et al. Reference Gendre, Éraud, Bretagnolle and Dalloyau2018), thus supporting the previous trends but showing a slight decrease in both the Mediterranean and western populations. The species is now strictly confined to small areas of France (detailed map in Gendre et al. Reference Gendre, Éraud, Bretagnolle and Dalloyau2018; Fig. 1).
Italy
Historically, Little Bustards were locally common in flat areas of central and southern continental Italy, as well as in Sardinia and Sicily. On the mainland, the bulk of the population was found in Apulia, as well as in Abruzzo and Molise, where it nested locally until the end of the 1960s. It was also irregularly reported further north, in the eastern Padanian plains (Petretti Reference Petretti, Leitão, Jolivet, Rodríguez and Tavares2007). The species occupied c.50,000 ha in 1950, but only 1,200 ha by the 1980s (Petretti Reference Petretti1985). The Apulian population was estimated at 10,000–100,000 individuals in the early 20th century, although it began to decline when extensive livestock management was replaced by arable crops in the 1940s (Petretti Reference Petretti, Gafta and Akeroyd2006). By the 1960s, the population had fallen to around 1,000 individuals distributed over the plateau area known as Tavoliere of Gargano (in Gargano National Park). That was the last population on the mainland, which continued to decrease to 500–1,000 birds during the 1970s, and late 20th century to 15–20 birds in 2005 (Petretti Reference Petretti, Gafta and Akeroyd2006). This relict population is completely isolated from the rest of the species’ range and can be considered today as functionally extinct, with no sightings of birds since 2010 (G. Palumbo pers. comm.). The Little Bustard became extinct in Sicily in the late 1960s (Snow and Perrins Reference Snow and Perrins1998, Massa and La Mantia Reference Massa and La Mantia2007). Thus, Sardinia hosts the only remaining Little Bustard population in Italy, estimated at 1,500–2,000 individuals in the mid-1980s (Schenk and Aresu Reference Schenk and Aresu1985), over coastal lowlands and inner plateaus of central and western Sardinia dominated by extensive pastoral and arable landscapes (Santangeli and Dolman Reference Santangeli and Dolman2011). It has declined severely during the last decades, to only 352 males in 2010–2011 (Nissardi and Zucca Reference Nissardi and Zucca2011).
North Africa
Historical reports indicate that the Little Bustard was a common breeder until the 20th century in cultivated plains from Tunisia to north-western Morocco (Cramp and Simmons Reference Cramp and Simmons1980, Schulz Reference Schulz1985). However, during the 20th century, it sharply declined in the region (Schulz Reference Schulz1985). It was also a common winter visitor throughout the same range, at least until the 1970s (Cramp and Simmons Reference Cramp and Simmons1980, Palacín and Alonso Reference Palacín and Alonso2009) and Thévenot et al. (Reference Thévenot, Vernon and Bergier2003) noted the presence of 1,000 wintering birds near Larache (Morocco) in 1964. However, during the last three decades of the 20th century Little Bustards became rapidly scarce, both as breeders and winter visitors, presumably due to land use transformations (agricultural intensification, irrigation, and infrastructure) and hunting pressure (Palacín and Alonso Reference Palacín and Alonso2009, Cherkaoui et al. Reference Cherkaoui, El Yaacoubi, Aghzar, El Yousfi and Qninba2020). The Little Bustard’s historical range in Morocco encompassed two disjunct areas, one in the north-west between Tangier and El Jadida, and another in the north-east close to the Algerian border (Palacín and Alonso Reference Palacín and Alonso2009). There are no recent records of the species in the latter area, suggesting it is probably extinct there. However, Little Bustards were still present until 2005 in five localities of the north-west (in the Hachef and Loukos river valleys) for which Palacín and Alonso (Reference Palacín and Alonso2009) reported a total of 47 birds observed in the pre-breeding season (early March–early April) in four consecutive years (1999–2003). Later records are extremely scarce, and no observations have been reported after 2009. A tiny nucleus rediscovered in 2017, the southernmost African population of Little Bustard, was extinct by 2020 (Cherkaoui et al. Reference Cherkaoui, El Yaacoubi, Aghzar, El Yousfi and Qninba2020). The current entire Moroccan population is restricted to the area of Tangier, where only two birds were seen in the last few years (Cherkaoui et al. Reference Cherkaoui, El Yaacoubi, Aghzar, El Yousfi and Qninba2020). The population in Morocco may thus be considered functionally extinct. Wintering birds near Larache over the last 60 years dropped from 1,000 (1960s) to 100 (1980s), remained at c.100 until the 1990s and finally went extinct in the 2000s. The species vanished from Algeria during the 1990s, both as a breeder and wintering visitor (Isenmann and Moali Reference Isenmann and Moali2000), and it can be currently considered extinct in Tunisia as well (Isenmann et al. Reference Isenmann, Gaultier, El Hili, Azafzaf, Dlensi and Smart2005). In summary, the Little Bustard is probably extinct in North Africa (and thus from the entire African continent), but further fieldwork may be required to confirm this assertion.
Eastern range
Information on Little Bustard numbers and trends in its oriental range is scarce and available only for a few regions: southern Russia, Ukraine, central Asian countries, and Turkey. Breeding and wintering estimates differ, with winter estimates relying on counts of birds migrating across the main flyway or staying at winter quarters, while breeding estimates are local or incomplete.
Breeding populations
The Little Bustard in Russia was historically distributed throughout the country’s steppe belt, even penetrating the forest-steppe biome (Spangenberg Reference Spangenberg1951). However, over the 20th century, it has disappeared from many regions, and the current range is limited to the Volga–Don interfluve, the Volga–Ural interfluve and eastern Cis-Caucasia (review in Oparin et al. Reference Oparin, Kondratenkov, Oparina and Mamayev2018). The current size of the Russian population is difficult to assess due to the marked disparity of estimates in the different regions. According to BirdLife International (2018), the Russian population may comprise 14,000–17,000 individuals. The main population is within Orenburg oblast, at the south-eastern limit of European Russia (Antonchikov Reference Antonchikov2011), which, with the Saratov oblast situated further west in the Volga Valley (5,900 birds; Shlyakhtin et al. Reference Shlyakhtin, Tabachishin, Khrustov and Zav’yalov2004), holds the bulk of the population in Russia. Shlyakhtin et al. (Reference Shlyakhtin, Tabachishin, Khrustov and Zav’yalov2004) also provided ranges of breeding densities in the Saratov oblast, from 0.01 ± 1.1 individuals/km2 in cereal fields, perennial grass prairies and northern steppe to 0.8 ± 0.3 individuals/km2 in southern steppes. There are however other estimates for the Russian population. For instance, Fedosov et al. (Reference Fedosov, Fedosov and Antonchikvo2016) suggested that 75,000 individuals were possibly present in the eastern part of the Orenburg oblast in 2016, although this figure is an extrapolation of local densities to the total area of habitat, and thus should be viewed cautiously. Conversely, the Orenburg Red Data Book suggests that 2,000–3,000 individuals are present (Kornev and Gavlyuk Reference Kornev, Gavlyuk and Davygora2017). The Orenburg oblast population seems to have increased since the early 1980s, which is consistent with reports from elsewhere in Russia over the same period, leading to the recolonisation of large areas (Collar et al. Reference Collar, Baral, Batbayar, Bhardwaj, Brahma, Burnside, Choudhury, Combreau, Dolman, Donald, Dutta, Gadhavi, Gore, Goroshko, Hong, Jathar, Jha, Jhala, Koshkin, Lahkar, Liu, Mahood, Morales, Narwade, Natsagdorj, Nefedov, Silva, Thakuri, Wang, Zhang and Kessler2017). Korovin (Reference Korovin2014) also refers to significant increases in breeding male densities from 0 to 5 individuals/km2 between 1990 and 2010 further east, in the trans-Ural region of Chelyabinsk. The abandonment of intensive agriculture after the fall of the Soviet Union may have contributed to bustard recovery (Kamp et al. Reference Kamp, Urazaliev, Donald and Hölzel2011). A recent survey conducted in fall (October) in Saratov oblast, reported about 30,000 birds (95% CI: 15,015–46 225; Oparin et al. Reference Oparin, Kondratenkov, Oparina and Mamayev2018). Counts were repeated (although irregularly) between 1997 and 2016 and maximum numbers at the level of the the entire region peaked at c.50,000 individuals in 2014 (Oparin et al. Reference Oparin, Kondratenkov, Oparina and Mamayev2018). Therefore, a significant population increase seems to have occurred there in the first decade of the current century, which Oparin et al. (Reference Oparin, Kondratenkov, Oparina and Mamayev2018) attributed to a 20% increase in the area of habitat suitable for nesting (secondary virgin steppe) in the 1990s–2000s, as well as to a significant decrease in grazing pressure. As a provisional and conservative assessment of the Little Bustard population size in the core of the Russian species’ range, we have summed Saratov’s and Orenburg’s minimum and maximum values to obtain a population size range c.17,000–121,000 individuals (see Table 3).
The situation in Ukraine is also unclear. Andryushenko and Stadnichenko (Reference Andryushchenko and Stadnichenko1999) estimated only 100–110 individuals restricted to Crimea (BirdLife International 2020). This estimate is most probably outdated, and no trend figure is currently available for the country. For Kazakhstan and Kyrgyzstan, BirdLife International (2020) provided an educated guess (and as such it must be taken cautiously) of 20,000 individuals, mainly in Kazakhstan, where the species is distributed across the country’s steppe belt and breeds in most provinces (Wassink and Oreel Reference Wassink and Oreel2007, Wassink Reference Wassink2016; see revision in Collar et al. Reference Collar, Baral, Batbayar, Bhardwaj, Brahma, Burnside, Choudhury, Combreau, Dolman, Donald, Dutta, Gadhavi, Gore, Goroshko, Hong, Jathar, Jha, Jhala, Koshkin, Lahkar, Liu, Mahood, Morales, Narwade, Natsagdorj, Nefedov, Silva, Thakuri, Wang, Zhang and Kessler2017). There seems to be consensus among authors about the overall recovery of the Little Bustard in this vast region (Collar et al. Reference Collar, Baral, Batbayar, Bhardwaj, Brahma, Burnside, Choudhury, Combreau, Dolman, Donald, Dutta, Gadhavi, Gore, Goroshko, Hong, Jathar, Jha, Jhala, Koshkin, Lahkar, Liu, Mahood, Morales, Narwade, Natsagdorj, Nefedov, Silva, Thakuri, Wang, Zhang and Kessler2017).
In Turkey, the Little Bustard was breeding in Inner Anatolia near Tuz Lake during the late 20th and early 21st centuries (Goriup and Parr Reference Goriup and Parr1985, Eken and Magnin Reference Eken and Magnin2000, Kirwan et al. Reference Kirwan, Byla, Castell, Demirci, Özen, Welch and Marlow2008), with a few males and some females reported (Kirwan et al. Reference Kirwan, Byla, Castell, Demirci, Özen, Welch and Marlow2008). Some individuals have been recorded in the post-breeding period in eastern Anatolia, but breeding there was not confirmed, and a few isolated and sporadic observations have been reported in the early 2000s along the Black Sea coast and in the Mediterranean district, all in the non-breeding season (Kirwan et al. Reference Kirwan, Byla, Castell, Demirci, Özen, Welch and Marlow2008). Overall, only 5–50 males may remain in Turkey. In Iran, there was historically a small breeding population, spread across the lowlands south-east of the Caspian Sea (Evans Reference Evans1994, Scott Reference Scott1995). Although the presence of breeding Little Bustards in Iran has not been confirmed in recent times, a careful investigation is required before their extinction can be ascertained (Sehhatisabet et al. Reference Sehhatisabet, Abdi, Ashoori, Khaleghizadeh, Khani, Rabiei and Shakiba2012). Finally, in north-west China, Collar et al. (Reference Collar, Baral, Batbayar, Bhardwaj, Brahma, Burnside, Choudhury, Combreau, Dolman, Donald, Dutta, Gadhavi, Gore, Goroshko, Hong, Jathar, Jha, Jhala, Koshkin, Lahkar, Liu, Mahood, Morales, Narwade, Natsagdorj, Nefedov, Silva, Thakuri, Wang, Zhang and Kessler2017) reviewed recent reports (Gao et al. Reference Gao, Yang, Qiao, Yao and Xu2008) and concluded that probably fewer than 1,000 birds remained, confined to Xinjiang province and Ningxia Hui autonomous region in the north-west and north of the country, respectively.
Wintering populations
The most reliable information for the eastern population probably comes from winter censuses. Azerbaijan hosts the bulk of the wintering population of the eastern range. Some historical records prior to 1930 reported a total wintering population of 200,000–300,000 individuals, as well as some breeding birds persisting up to the early 20th century (Patrikeev Reference Patrikeev2004). More recently, 150,000 birds were wintering in natural steppes and fallows, from the Caspian coastal plains to the Greater Caucasus foothills (Gauger Reference Gauger2007). Little Bustard densities in these areas can be very high, averaging 55 birds/km2, but increasing to 100 birds/km2 in smaller flocking sites, and flock size may range from <100 birds (most frequently) to several tens of thousands of individuals (Gauger Reference Gauger2007). The latter study reported an increase in the number of Little Bustards wintering in Azerbaijan during the early 2000s, which could reflect the population increase documented in breeding areas after the abandonment of intensive agriculture following the Soviet Union’s breakdown. The area of Besh Barmag Mountain, close to the Caspian coast, is a main bottleneck for migratory eastern Little Bustards. Heiss (Reference Heiss2013, Reference Heiss2016) estimated that 105,895–123,491 Little Bustards crossed this bottleneck in the autumn migration in the winter of 2011–2012, i.e. 41–48% of the species’ world population and 71–82% of the eastern contingent is using this flyway, though only a few thousand Little Bustards cross this bottleneck on the spring migration (Heiss Reference Heiss2013). Other winter quarters occur in northern Iran, along the Caspian coast, but also in the north-west, near the Azerbaijani border and the north-east, bordering Turkmenistan and Afghanistan (Yousefi et al. Reference Yousefi, Kafash, Malakoutikhah, Ashoori, Khani, Mehdizade, Ataei, Ilanloo, Rezaie and Silva2017), although there are historical observations from more central parts of the country (Sehhatisabet et al. Reference Sehhatisabet, Abdi, Ashoori, Khaleghizadeh, Khani, Rabiei and Shakiba2012). The wintering population in Iran appears to reach c.57,000 individuals (Yousefi et al. Reference Yousefi, Kafash, Malakoutikhah, Ashoori, Khani, Mehdizade, Ataei, Ilanloo, Rezaie and Silva2017), and occupies a variety of habitats, including farmland, pastures, and halophytic shrub-steppes (Sehhatisabet et al. Reference Sehhatisabet, Abdi, Ashoori, Khaleghizadeh, Khani, Rabiei and Shakiba2012). As in Azerbaijan, this wintering population seems to have increased steadily in numbers and geographical range in recent times (Yousefi et al. Reference Yousefi, Kafash, Malakoutikhah, Ashoori, Khani, Mehdizade, Ataei, Ilanloo, Rezaie and Silva2017), in part presumably due to a hunting ban enforced in 2006–2009 to prevent an avian influenza outbreak (Sehhatisabet et al. Reference Sehhatisabet, Abdi, Ashoori, Khaleghizadeh, Khani, Rabiei and Shakiba2012), although the habitat changes that occurred in Russian and central Asian breeding grounds may have also contributed. Nevertheless, the area surveyed has increased in Iran (Yousefi et al. Reference Yousefi, Kafash, Malakoutikhah, Ashoori, Khani, Mehdizade, Ataei, Ilanloo, Rezaie and Silva2017) and shifts of wintering areas might have occurred due to habitat modification. Therefore, we recommend caution when treating these figures. Considering estimates by Gauger (Reference Gauger2007), Heiss (Reference Heiss2013) and Yousefi (Reference Yousefi, Kafash, Malakoutikhah, Ashoori, Khani, Mehdizade, Ataei, Ilanloo, Rezaie and Silva2017), the Iranian and Azerbaijani contingents add up to 171,693–207,000 Little Bustards overwintering south of the Caspian Sea, which provides a minimum estimated size of the eastern Little Bustard population. Therefore, either the Russian or Kazakh breeding populations (or both) are currently underestimated. The Little Bustard has been reported in winter in other sites beyond the core areas described above, from Lebanon to Afghanistan and Pakistan (Figure 1), but either in very small numbers or as erratic visitor (Grimmet et al. Reference Grimmett, Roberts and Inskipp2009, Morales et al. Reference Morales, Mañosa, Villers, García de la Morena, Bretagnolle, Bretagnolle, Traba and Morales2021). Adequate research based on telemetry is required to assess and validate these reports.
Discussion
Distribution range and population trends
The present markedly disjunct global distribution range of the Little Bustard is largely the result of the historical extinction process that occurred in Central and Eastern Europe as well as North Africa over the 20th century. Both the western (20th and early 21st centuries) and the eastern ranges (20th century) have contracted, with regressions in core areas and extinctions of more peripheral populations (North Africa, continental Italy, Middle East, Turkey, and trans-Caucasian regions). Our review highlights the concerning, if not alarming, distribution patterns and population trends exhibited by the Little Bustard’s western population during the late 20th century and the first two decades of the 21st. Conversely, estimates in the eastern branch population would suggest an overall increase over the last 20-30 years in that region, although their low quality advises caution when interpreting, and much information is lacking at local scale.
The results compiled from the latest Little Bustard local estimates for the western range plus the winter numbers for the eastern range yield a grand total for the world population of c. 222,900–317,000 individuals (Table 3). This figure must be viewed with caution since the accuracy of the data used to calculate the global sum is highly variable. Moreover, the calculation of total individuals in west European countries is derived from an estimated proportion of females (Serrano-Davies et al. Reference Serrano-Davies, Traba, Arroyo, Mougeot, Cuscó, Mañosa, Bota, Faria, Villers, Casas, Devoucoux, Bretagnolle and Moralesin review). Nevertheless, these partial population and sex ratio estimates are based on standardized and repeatable survey and calculation methods, and thus can be considered reliable (Table 3). Despite limitations, this updated evaluation of the species’ world population size clearly reduces the broad range of 100,000–500,000 individuals tentatively considered by BirdLife International (2020). At the European Union level, the total number of males breeding in the entire western range (50,563; Table 3) now falls below the interval provided by BirdLife for the IUCN European Bird Red List (56,800–111,000 males; BirdLife International 2015). This result indicates that the species’ population status in the western range is worse than believed until recently.
Our results emphasize the divergent recent histories and present situations of western and eastern ranges. South-western Europe still harboured 60% of the world population in 2010 (Íñigo and Barov Reference Iñigo and Barov2010), mostly concentrated in the Iberian Peninsula. While the Iberian population was thought to be in decline (Íñigo and Barov Reference Iñigo and Barov2010), our review indicates it is actually collapsing: the Iberian population has lost c.50% of its effectives in just a single decade, with a current yearly decline of c.5–6%, and it is now under 50% of the world total (Table 3). In contrast, the eastern population seems to enjoy a better conservation status than previously thought, based on increasing winter counts in Azerbaijan and Iran, which are more reliable than breeding data, and it now outnumbers the western one, both for winter counts and breeding censuses, if we rely on the last estimates provided for Russia by Oparin et al. (Reference Oparin, Kondratenkov, Oparina and Mamayev2018) (Table 3). Nevertheless, more precise breeding population estimates based on standard and comparable census methods are critically required for eastern countries, particularly Russia and Kazakhstan.
Ongoing threats for the Little Bustard worldwide
Intensification of farmland management
The Little Bustard’s optimal habitat is pseudo-steppe and extensive farmland (Brotons et al. Reference Brotons, Mañosa and Estrada2004, Morales et al. Reference Morales, Traba, Delgado and García de la Morena2013, Bretagnolle et al. Reference Bretagnolle, Denonfoux and Villers2018). Therefore, modern agriculture and land-use transformation are the main threat Little Bustards have faced in recent decades (Bretagnolle et al. Reference Bretagnolle, Denonfoux and Villers2018, Traba and Morales Reference Traba and Morales2019). Indeed, the transformation of traditional extensively, managed grasslands (either grazed or hayed) and cereal farmland into intensive agrarian landscapes has occurred in most of Europe over the second half of the 20th century (Collar et al. Reference Collar, Garcia, De Juana, del Hoyo, Elliot, Sargatal, Christie and Juana2016). This transformation has not occurred simultaneously everywhere; for instance, it occurred in France in the 1980s and 90s, earlier in Italy, and over a decade later in Spain and Portugal, which produced different population collapse times over the western range as depicted in Figure 2. In addition, agriculture intensification and land-use transformation have altered Little Bustard population dynamics through different pathways. Agriculture and livestock management intensification have reduced habitat diversity at the landscape scale (loss of natural grasslands and fallows, spread of irrigation and woody crops) and field scale (homogenization of vegetation structure, disappearance of wild plants and arthropods through increased herbicide and pesticide application), decreasing the availability of key resources such as insect food and adequate nesting sites, and thus habitat suitability (Brotons et al. Reference Brotons, Mañosa and Estrada2004, Faria et al. Reference Faria, Rabaça and Morales2012, Faria Reference Faria2015, Morales et al. Reference Morales, Traba, Delgado and García de la Morena2013, Bretagnolle et al. Reference Bretagnolle, Denonfoux and Villers2018, Traba and Morales Reference Traba and Morales2019). Food reduction, particularly of insects, has a direct negative impact on juvenile survival and thus population recruitment, which is a key parameter for population growth in this species (Morales et al. Reference Morales, Bretagnolle and Arroyo2005, Inchausti and Bretagnolle Reference Inchausti and Bretagnolle2005). Another pathway is the use of modern harvesting machinery, a potentially important though overlooked source of female and juvenile mortality, as well as nest failure (Inchausti and Bretagnolle Reference Inchausti and Bretagnolle2005, Faria et al. Reference Faria, Morales and Rabaca2016, Bretagnolle et al. Reference Bretagnolle, Denonfoux and Villers2018). This could account for, at least partially, the markedly male-biased sex ratios found in many populations (Serrano-Davies et al. Reference Serrano-Davies, Traba, Arroyo, Mougeot, Cuscó, Mañosa, Bota, Faria, Villers, Casas, Devoucoux, Bretagnolle and Moralesin review), another important limitation to Little Bustard population viability (Morales et al. Reference Morales, Bretagnolle and Arroyo2005).
Examples of long-term local population trends in the three countries hosting the largest Little Bustard populations of the species’ western range. Black dots indicate annual values. Spain, 3 localities. Solid line and black dots: mean relative abundance of 91–118 point-counts in Campo de Calatrava (central Spain, based on Casas et al. Reference Casas, Mougeot, Arroyo, Morales, Hervás, García de La Morena, Fagan and Viñuela2019); dashed line and black squares: mean relative abundance of 6 survey sites in Extremadura (south-western Spain, based on De Juana Reference De Juana2009); dotted line and black diamonds: mean number of males/km2 in Navarra (northern Spain, based on García de la Morena and Morales unpubl. report). Portugal, 2 localities. Solid line and black dots: total number of males in Cabrela (Alentejo, N. Faria unpublished data); dashed line and black squares: mean number of males in 28 survey stations in Evora (Alentejo, N. Faria unpubl. data). France, 2 localities. Solid line and black dots: total number of males in Charentes (western France, NGO Charente Nature, unpublished data); dashed line and black squares: total number of males in ZA Deux Sèvres (western France, V. Bretagnolle, unpubl. data).

The agricultural management factors that negatively affect Little Bustards, however, can positively influence their population dynamics. This is clearly what has occurred in the eastern range, where land abandonment after the Soviet Union collapsed allowed a spectacular population growth (Kamp et al. Reference Kamp, Urazaliev, Donald and Hölzel2011). Such exponential increases have also occurred locally in the western range. For instance, the transformation to extensive farming of the grazed steppe of La Crau, known as coussoul, along with the abandonment of traditional vineyards and other cultivated areas in Costière Nimoise (Department of Gard), seem to have boosted the Little Bustard population growth in southern France (Wolff et al. Reference Wolff, Paul, Martin and Bretagnolle2001, Devoucoux Reference Devoucoux2014). In Gard, Devoucoux (Reference Devoucoux2014) documented a process of exponential growth from a marginal population of less than 100 males to over 700 males in just 14 years in a 120 km² area.
Agriculture abandonment can however be reversed, and land-use changes may now again threaten the species in central Asia, as well as in southern France. After a period of agricultural abandonment following the fall of the Soviet Union, which has probably benefited many steppe birds in Russia and Kazakhstan (Shlyakhtin et al. Reference Shlyakhtin, Tabachishin, Khrustov and Zav’yalov2004, Kamp et al. Reference Kamp, Urazaliev, Donald and Hölzel2011), the return to intensive agriculture in recent years may negatively affect eastern populations of Little Bustard (Kamp et al. Reference Kamp, Urazaliev, Donald and Hölzel2011, Collar et al. Reference Collar, Baral, Batbayar, Bhardwaj, Brahma, Burnside, Choudhury, Combreau, Dolman, Donald, Dutta, Gadhavi, Gore, Goroshko, Hong, Jathar, Jha, Jhala, Koshkin, Lahkar, Liu, Mahood, Morales, Narwade, Natsagdorj, Nefedov, Silva, Thakuri, Wang, Zhang and Kessler2017). Ploughing was the main threat to the maintenance of steppe habitats in Russia and central Asia before the fall of the Soviet Union. Almost one million km2 of Russian steppe were converted to arable land, in 1990 alone (Smelansky and Tishkov Reference Smelansky, Tishkov, Werger and van Staalduinen2012). However, the breakdown of socialist economies halted land conversion and favoured the abandonment of agriculture in natural steppe regions in the former Soviet republics (Kamp et al. Reference Kamp, Urazaliev, Donald and Hölzel2011), particularly in the less productive areas, so that between 1991 and 2007 more than 26 million hectares of cultivated steppe were abandoned in Russia (Smelansky and Tishkov Reference Smelansky, Tishkov, Werger and van Staalduinen2012). After 2007 that tendency reversed again and nearly one million hectares were put back into cultivation, at least until 2012, affecting some regions considered key for the Little Bustard, such as Orenburg province (Smelansky and Tishkov Reference Smelansky, Tishkov, Werger and van Staalduinen2012). Kamp et al. (Reference Kamp, Urazaliev, Donald and Hölzel2011) projected the proportion of land affected by different land-use changes and their direction (increase or decrease) up to 2020 in Kazakhstan. They forecast a 74% decrease in abandoned agricultural land (former cereal and fodder grass cultures), and these predicted changes are expected to affect the Little Bustard negatively. Other forecasted changes may potentially be beneficial for the species, like a 33% decrease in overgrazed steppe or a 2.7% increase in low to moderately grazed steppe. Even the potentially negative impact of the enormous increase in cereal and fodder grass culture projected (53% and 66% respectively; Kamp et al. Reference Kamp, Urazaliev, Donald and Hölzel2011) could be moderated by means of adequate agricultural management.
Such rapid, iterative, and reversed changes, occurring both in the west and the east, suggests the possibility that preferred breeding habitats in agricultural landscapes act as ecological traps for Little Bustards because of agricultural practices. Ecological traps are expected to occur in rapidly changing habitats under strong anthropogenic influence (Suvorov and Svobodová Reference Suvorov and Svobodová2012), such as farmland, as shown for several bird species (Donald et al. Reference Donald, Evans, Muirhead, Buckingham, Kirby and Schmitt2002, Gruebler et al. Reference Grüebler, Schuler, Horch and Spaar2012). Breeding female Little Bustards in agricultural landscapes are attracted to temporary grasslands. When this habitat becomes scarce (as in western France, where they represent less than 15% of the surface area; Bretagnolle et al. Reference Bretagnolle, Denonfoux and Villers2018), females select them regardless of other traits that may influence breeding success such as vegetation height (which predicts mowing date) or distance to border (a proxy of predation risk). In western France, half of the nests in such grasslands, despite being in preferred habitat, are destroyed during mowing. Additionally, since the females do not show any other preference, the application of agri-environmental schemes (AESs) on temporary grasslands does not improve nest fate because, although nest destruction is reduced by AES (no mowing), the proportion of grasslands in AES remains low (Bretagnolle et al. Reference Bretagnolle, Denonfoux and Villers2018). The quantity and quality of those scarce but selected habitats is further decreasing in the western range (Morales et al. Reference Morales, Traba, Delgado and García de la Morena2013, Silva et al. Reference Silva, Correia, Alonso, Martins, D’Amico, Delgado, Sampaio, Godinho and Moreira2018, Traba and Morales Reference Traba and Morales2019), and thus the risk of them becoming ecological traps increases. Therefore, the western range would require a conservation strategy in which extensively managed agricultural landscapes with a large enough proportion (>15%) of good quality grasslands are spared from more intensively managed ones. This would require a stronger stakeholder commitment with the conservation of farmland biodiversity (Gaba and Bretagnolle Reference Gaba and Bretagnolle2020), as well more conservation-focused and easier to apply agri-environmental schemes (i.e. those encompassed in EU’s CAP; Díaz et al. Reference Díaz, Concepción, Morales, Alonso, Azcárate, Bartomeus, Bota, Brotons, García, Giralt, Gutiérrez, López-Bao, Mañosa, Milla, Miñarro, Navarro, Olea, Palacín, Peco, Rey, Seoane, Suárez-Seoane, Schöb, Tarjuelo, Traba, Valera and Velado-Alonso2021). Similar habitat change dynamics may be currently occurring in steppe and agricultural habitats of the eastern range, which urges for more geographically widespread, intensive, and standardized monitoring of eastern Little Bustard populations and their habitats.
Other relevant threats
Although agriculture changes and intensification can be considered the main drivers of large-scale declines in the Little Bustard, other threats have been identified across the species’ world range. In certain areas like central Spain, urban sprawl has been important in recent years, causing direct habitat disappearance and loss of suitability due to fragmentation and edge effects, since breeding Little Bustards avoid the proximity of large linear infrastructures and urbanized areas (Suárez-Seoane et al. Reference Suárez-Seoane, Osborne and Alonso2002, Reference Suárez-Seoane, la Morena, Morales, Osborne and De Juana2008, Silva et al. Reference Silva, Santos, Queirós, Leitão, Moreira, Pinto, Leqoc and Cabral2010). Indeed, collision with powerlines and hunting pressure have also been identified as relevant risks for the Little Bustard across its distribution range (De Juana and Martínez Reference De Juana and Martínez2001, Íñigo and Barov Reference Iñigo and Barov2010, Silva et al. Reference Silva, Santos, Queirós, Leitão, Moreira, Pinto, Leqoc and Cabral2010). For example, 42% of mortality recorded in 139 birds that were satellite- and radio-tracked in Iberia were human-caused, with poaching accounting for 32% of total mortality (Marcelino et al. Reference Marcelino, Moreira, Mañosa, Cuscó, Morales, García de la Morena, Bota, Palmeirim and Silva2018), although collision with powerlines (see also Silva et al. Reference Silva, Santos, Queirós, Leitão, Moreira, Pinto, Leqoc and Cabral2010) and vehicles were also relevant (6.45 and 3.23%, respectively; Marcelino et al. Reference Marcelino, Moreira, Mañosa, Cuscó, Morales, García de la Morena, Bota, Palmeirim and Silva2018). While shooting seems to be related to poaching and opportunistic hunting in Europe (De Juana and Martínez Reference De Juana and Martínez2001), legal hunting is still an important pressure for wintering eastern populations. For instance, the species is legally shot in Iran (Sehhatisabet et al. Reference Sehhatisabet, Abdi, Ashoori, Khaleghizadeh, Khani, Rabiei and Shakiba2012), and probably also in Azerbaijan, as well as in passage and wintering sites of the Middle East, although no quantitative estimates are available (Gauger Reference Gauger2007, Ramadan-Jaradi et al. Reference Ramadan-Jaradi, Itani and Serhal2017, Collar et al. Reference Collar, Baral, Batbayar, Bhardwaj, Brahma, Burnside, Choudhury, Combreau, Dolman, Donald, Dutta, Gadhavi, Gore, Goroshko, Hong, Jathar, Jha, Jhala, Koshkin, Lahkar, Liu, Mahood, Morales, Narwade, Natsagdorj, Nefedov, Silva, Thakuri, Wang, Zhang and Kessler2017). Human presence, which increases near urbanized areas, has been shown to induce physiological stress in Little Bustards (Tarjuelo et al. Reference Tarjuelo, Barja, Morales, Traba, Benítez-López, Casas, Arroyo, Delgado and Mougeot2015), a threat difficult to assess at large scales, but potentially important in the increasingly human-frequented European rural landscape.
Climate change is another potential new threat for the Little Bustard. The species’ climate niche requirements may not be met under climate conditions forecast for the end of this century in its current range (Gudka et al. Reference Gudka, Santos, Dolman, Abad-Gómez and Silva2019). Indeed, the Little Bustard’s European range was predicted to shift northwards (Huntley et al. Reference Huntley, Green, Collingham and Willis2007). However, when forecasts incorporate suitable habitat availability and spatial proxies of philopatry and conspecific attraction, the favourable range predicted remains fairly unchanged (Estrada et al. Reference Estrada, Delgado, Arroyo, Traba and Morales2016), so that the Little Bustard ends up trapped in regions with a growing mismatch with the species’ climate requirements.
Conflicting conservation status
The evidence reviewed here highlights the different population dynamics experienced by the two Little Bustard sub-populations. These have been isolated, with presumably no, or sporadic connections between them, at least since the mid-20th century (see Table 2). Western and eastern populations may present some level of evolutionary divergence. Though not currently recognized, taxonomists formerly considered two different subspecies based on perceived morphological differences (Collar et al. Reference Collar, Del Hoyo, Elliot and Sargatal1996). Recent morphological analyses indicate differences between north-eastern and south-western localities of the range (Bretagnolle et al. Reference Bretagnolle, Mañosa, Morales, Bretagnolle, Traba and Morales2021). Moreover, a phylogeographic study using mtDNA samples from France and Iberia found a low but significant level of structure at that geographical scale (García et al. Reference García, Mañosa, Morales, Ponjoan, García de la Morena, Bota, Bretagnolle and Dávila2011), which suggests that a larger-scale study might also find genetic structure. Further genetic evidence covering the main western and eastern nuclei is required. But overall, the existence of such morphological differences, possible genetic structuring, along with the observed ecological differences (i.e. western population mainly dependent on agricultural habitats vs the eastern one largely dependent on steppe), and the contrasting migratory behaviour (mainly resident with a single migratory populations in the west vs fully migratory in the east), all together strongly advocate for considering the two subpopulations as different evolutionary units. While the lack of a global phylogeography prevents the definition of evolutionary significant units sensu stricto (Moritz Reference Moritz1994), these two subpopulations show opposite overall trends (i.e. clearly diverging extinction risks), are ecologically distinct and suffer threats with different intensities. Therefore, we argue that they should be considered as independent conservation units, through their treatment as different designable units for conservation status assessment (Green Reference Green2005). Moreover, these two designable units closely fit the concept of ‘Geographically Separate Subpopulations’ (i.e. “populations that are so isolated from others of the same species that it is extremely unlikely that there is any genetic interchange”), recognized by IUCN as assessable for conservation status (https://www.iucnredlist.org/resources/tax-sources). In this context, we recommend treating each Little Bustard sub-range as a Geographically Separate Subpopulation with its own world status. Moreover, we consider the results presented in this review may be useful to update the global situation of the species with an eye on the on the eventual classification of the rapidly vanishing western population in the ‘Endangered’ IUCN category, which would allow more coordinated, ambitious, and urgent conservation action, particularly in Iberia, where trends seem most concerning. This classification may meet several IUCN criteria based on the reasonable premise that the population dynamics of the western population are governed by Iberian trends, since the Spanish and Portuguese populations (which represent a single and well connected metapopulation) account for c.95% of Little Bustard numbers in the western range, as shown in this review. In this context, the Iberian population has been declining by more than 50% for 10 years, as well as its area of occupancy (criteria A2a, b; García de la Morena et al. Reference García de la Morena, Bota, Mañosa and Morales2018, Silva et al. Reference Silva, Correia, Alonso, Martins, D’Amico, Delgado, Sampaio, Godinho and Moreira2018). Furthermore, the quality of Little Bustard habitat in Iberia seems to have dramatically worsened (criterion A2c), due to the marked decrease of grass-covered fallow land (and other grassland types), the species’ most used and selected habitat in Iberia, which declined by c.58% between 2000 and 2017, although the steepest fall (c.31%) occurred after 2008 (Traba and Morales Reference Traba and Morales2019). The decline of the Little Bustard in Spain was strongly correlated with the loss of fallow land over that period (Traba and Morales Reference Traba and Morales2019). According to Silva et al. (Reference Silva, Correia, Alonso, Martins, D’Amico, Delgado, Sampaio, Godinho and Moreira2018), habitat quality has similarly degraded in Portugal. Finally, population projection results forecast population decreases of c.57–74% over a 10-year period (Criterion A3b; García de la Morena et al. Reference García de la Morena, Bota, Mañosa and Morales2018, Traba et al. Reference Traba, Bota, Mañosa, García de la Morena and Morales2020). Given the geographical and ecological continuity with the Portuguese population and provided the similarly negative past trends reported by Silva et al. (Reference Silva, Correia, Alonso, Martins, D’Amico, Delgado, Sampaio, Godinho and Moreira2018), there is no reason to believe that Little Bustard numbers in that country should follow a different path. In summary around 95% of the western population is expected to have decreased by more than 50% in 2026 if current habitat conditions do not improve.
Regarding the eastern population, our suggestion for this Geographically Separate Subpopulation would be maintaining its current global classification as ‘Near Threatened’, unless more solid evidence advising otherwise is reported in the coming years. Any further reassessment must be accompanied by population monitoring and studies on eastern Little Bustard genetic relationships, ecology (very poorly known) and requirements, consistent with the designable unit update protocol advised by Green (Reference Green2005). In our view, this might be a reasonable and consistent alternative to the actual species’ classification since (i) it would increase the protection status of the strongly declining western population, (ii) it does not imply changing the status of the eastern population, given the lack of more solid evidence and (iii) it may help avoiding the pitfall of global categorization by giving priority at world level to the most threatened population.
Acknowledgements
Nuno Faria kindly provided census data for two Portuguese localities. NGO Charente-Nature kindly made accessible long-term data and counts to VB. Sarah Young reviewed the English before ms submission. We are thankful to three anonymous reviewers for their useful comments on a previous version of the ms. This paper is a contribution to Excellence Network Remedinal 3CM (S2013/MAE2719), supported by Comunidad de Madrid.