1. Introduction
Comprehensive understanding of the effect of fluid–rock interactions on crustal processes during orogeny involves meticulous interpretation of the feedback system between fluid infiltration, associated mineral reactions, changes induced in the physical characters of a rock and the accompanying stress (re)distribution (Jamtveit et al. Reference Jamtveit, Austrheim and Malthe-Sørensen2000; Centrella et al. Reference Centrella, Austrheim and Putnis2015, Reference Centrella, Putnis, Lanari and Austrheim2018; Centrella, Reference Centrella, Ferrero, Lanari, Goncalves and Grosch2019). In a geological system, fluid plays a significant role as a catalyst for reaction kinetics or a medium for material transport (Rubie, Reference Rubie1986; Larikova & Zaraisky, Reference Larikova and Zaraisky2009; Milke et al. Reference Milke, Neusser, Kolzer and Wunder2013) besides acting as a reactant. Fluid redistributes mass from one domain to another as metamorphic phases form through the dissolution–transport–reprecipitation process in rocks (Carmichael, Reference Carmichael1969; Centrella et al. Reference Centrella, Austrheim and Putnis2016). Deformation induced influx generally allows large-scale infiltration without significant change in overall elemental concentration in the bulk composition of the host rock (e.g. Austrheim, Reference Austrheim1987; Barnicoat & Cartwright, Reference Barnicoat and Cartwright1995). Infiltration in rocks can be channelized through veins during brittle deformation and through shear zones in the case of ductile deformation (e.g. Austrheim, Reference Austrheim1987; Bebout & Barton, Reference Bebout and Barton1993; Cartwright & Buick, Reference Cartwright and Buick2000; Oliver & Bons, Reference Oliver and Bons2001). However, on a micro-scale, it can be pervasive along grain boundaries (e.g. de Meer et al. Reference de Meer, Spiers and Nakashima2005; Konrad-Schmolke et al. Reference Konrad-Schmolke, Zack, O’Brien and Barth2011; Centrella et al. Reference Centrella, Beaudoin, Derluyn, Motte, Hoareau, Lanari, Piccoli, Pecheyran and Callot2020). While redistributing material between reaction sites, fluid can influence the chemical nature (composition) of a reaction even in systems where it is not a part of the reaction thermodynamics involving mineral equilibria (Putnis & Austrheim, Reference Putnis and Austrheim2010). This is particularly significant when coupled replacements occur between different reactions sites (Carmichael, Reference Carmichael1969; Centrella et al. Reference Centrella, Austrheim and Putnis2016, Reference Centrella, Putnis, Lanari and Austrheim2018). In the case of coupled replacement, redistribution or inter-exchange of transported components between reaction zones can lead to a considerable difference in the product chemistry compared to the reactant from the same site. This is because the composition of such product phases is not only controlled by the composition of the reactant that it replaces but is also controlled by the length-scale of the exchange between the locally separated reaction zones (Centrella et al. Reference Centrella, Austrheim and Putnis2016).
The studied meta-granite preserves diverse metamorphic assemblages developed in local domains. The reactant–product chemistry of these domains shows a certain compositional disparity. Garnet replacing amphibole has significant spessartine content though the parent mineral contains negligible Mn. On the contrary, titanite replacing oxide phases does not contain Mn, but the reactant ilmenite shows a high Mn content. Considering this feature, here we have tried to explore if material redistribution between texturally separated reaction sites could adjust the compositional disparity. To understand the link (if any) between the domains, we have examined the petrography and chemistry of each reaction zone in detail, followed by modelling balanced equations for the reactions and calculating the gain versus loss of elements from different domains. Combining petrography and mineral composition in this study has led to an enhanced understanding of the reaction process and appropriate identification of equilibrium assemblages during metamorphism, which is crucial in deriving the pressure–temperature (P–T) history in rocks. We have employed pseudosection modelling and conventional thermometry to estimate the P–T conditions under which the metamorphic phases formed. To our knowledge, this is the first detailed petrological work reported for meta-granites from the study area of the South Delhi Fold Belt.
2. Geological background
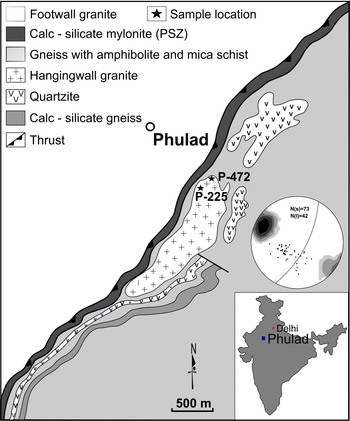
In the northwestern Indian shield, the South Delhi Fold Belt (SDFB) consists of NE–SW-trending, multiply folded and poly-metamorphosed rocks of Proterozoic age. The SDFB consists mainly of calc-silicate rocks inter-layered with mica schists, granites, and mafic and ultramafic rocks (Heron, Reference Heron1953; Gupta et al. Reference Gupta, Arora, Mathur, Iqbaluddin, Prasad, Sahai and Sharma1980, Reference Gupta, Mukhopadhyay, Fareeduddin and Reddy1995, Reference Gupta, Arora, Mathur, Iqbaluddin, Prasad, Sahai and Sharma1997; Roy & Jakhar, Reference Roy and Jakhar2002; Chatterjee et al. Reference Chatterjee, Roy Choudhury and Das2016). The western margin of the SDFB is demarcated by a crustal-scale shear zone known as the Phulad Shear Zone (PSZ) (Gupta et al. Reference Gupta, Arora, Mathur, Iqbaluddin, Prasad, Sahai and Sharma1980; Sinha-Roy, Reference Sinha-Roy and Roy1988; Golani et al. Reference Golani, Reddy, Bhattacharjee and Paliwal1998; Ghosh et al. Reference Ghosh, Hazra and Sengupta1999; Chatterjee et al. Reference Chatterjee, Roy Choudhury, Das and Roy2017, Reference Chatterjee, Sarkar, Roy and Manna2020). The PSZ mylonitic foliation has a northeasterly strike and a steep easterly dip with a very strong down-dip stretching lineation. Detailed structural studies indicate that the PSZ developed in a ductile transpressional regime (Ghosh et al. Reference Ghosh, Hazra and Sengupta1999; Roy Choudhury et al. Reference Roy Choudhury, Das, Chatterjee and Sengupta2016; Sengupta & Chatterjee, Reference Sengupta, Chatterjee, Mukherjee and Mulchrone2016) with a top-to-the-NNW reverse sense of movement (Ghosh et al. Reference Ghosh, Hazra and Sengupta1999; Chatterjee et al. Reference Chatterjee, Roy Choudhury, Das and Roy2017, Reference Chatterjee, Sarkar, Roy and Manna2020). The meta-granite of the present study area belongs to the SDFB and is situated on the hanging wall side of the PSZ, nearly a kilometre east of the proper shear zone (Fig. 1). The studied meta-granite shows prominent development of foliation with strong down-dip stretching lineation (Fig. 1). This meta-granite foliation and stretching lineation occurs parallel to the mylonitic foliation and stretching lineation of the PSZ. The style and geometry of the structural elements in both the meta-granites and PSZ suggest that the deformation was synchronous. The igneous minerals that define the foliation were replaced to a variable extent by metamorphic minerals. The metamorphic phases in this rock show spectacular replacement textures, such as symplectite, coronas, etc. The following section describes the microscopic features of these phases and their relationship to the deformation fabric.
Geological map showing the different lithologies around Phulad, Rajasthan (modified after Ghosh et al. Reference Ghosh, Hazra and Sengupta1999). Sample locations are shown with solid stars. Stereographic plot (i) of the foliation and lineation in the meta-granite; contour intervals of the foliation data are as follows: 2 %, 4 %, 8 %, 16 % and 32 % (in increasing shades of grey; max. 58.9 %). The mean principal orientation is 28°/74° E. The lineation shows the mean principal direction being 64° → 217°. N(s) – number of foliations; N(l) – number of lineations.

3. Petrography and mineral chemistry
The studied granitic rock is pink coloured, medium grained (1–3 mm) and equigranular on a mesoscopic scale. Following is the detailed petrographic description of the granitic rock of the hanging wall of the PSZ. Elucidating the relationship of metamorphic mineral growth with subsequent fabric development was done by studying ∼20 thin-sections under a transmitted light microscope.
3.a. Analytical methods
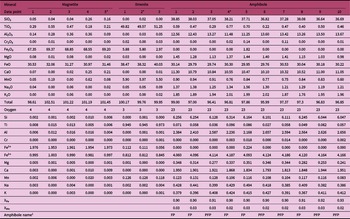
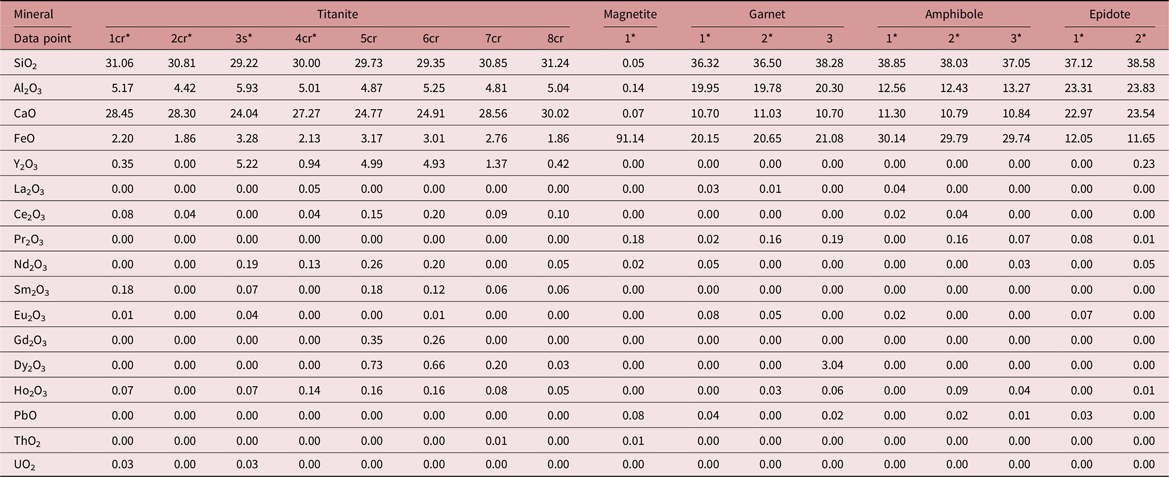
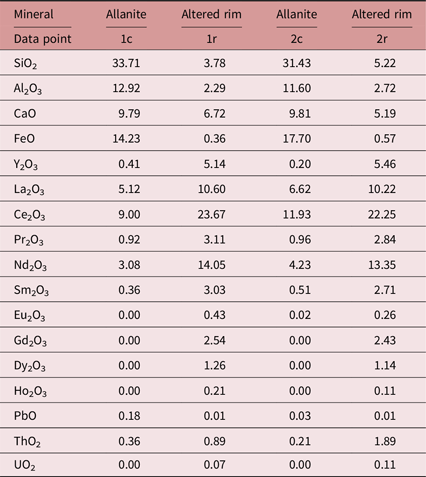
Mineral data were analysed using an electron probe micro-analyser (EPMA). Electron probe micro-analysis was carried out with a 4-WDS CAMECA SX-100 EPMA in the Department of Science and Technology, India – sponsored National Facility in the Department of Geology and Geophysics, Indian Institute of Technology, Kharagpur, India. The operating conditions for silicate minerals and X-ray mapping were an accelerating voltage of 15 kV, beam current of 20 nA and beam size of 1 μm using natural mineral standards. ZAF matrix corrections were made based on the factory-supplied PAPSIL program. For rare earth element (REE) analysis, the operating conditions were an accelerating voltage of 20 kV, beam current of 50 nA and beam size of 1 μm. The acquisition information is provided in the online Supplementary Material data file. Mineral abbreviations are after Whitney & Evans (Reference Whitney and Evans2010). Analysed data for major-element and trace-element (including REE) compositions (as oxides) are given in Tables 1 and 2, respectively. Allanite mineral composition (both major and trace elements in the form of oxides) has been mentioned separately in Table 3.
Representative EPMA analysis of major-oxide compositions of magnetite, ilmenite and amphibole. Oxide proportions are provided as weight per cent (wt %)

XFe = Fe2+/(Mn + Fe2+ + Mg).
XMn = Mn/(Mn + Fe2+ + Mg).
Note: ‘*’ Refers to the data used in reaction modelling.
FP – ferro-pargasite; PFP – potassic-ferro-pargasite.
1 – amphibole classification done by Excel spreadsheet 2013 published by Hawthorne et al. (Reference Hawthorne, Oberti, Harlow, Maresch, Martin, Schumacher and Welch2012) = IMA 2012.

XFe3+ = Fe3+/(Fe3+ + Al).
XAb = Na/(K + Na + Ca).
Caa – Ca after excluding equivalent andradite composition.
XFe3+ [andradite] = Fe3+/(Fe3+ + Al + Cr)
XCa [grossular] = Caa/(Caa + Mn + Fe2+ + Mg)
XFe2+ [almandine] = Fe2+/(Caa + Mn + Fe2+ + Mg).
XMn [spessartine] = Mn/(Caa + Mn + Fe2+ + Mg).
Note: ‘*’ Refers to the data used in reaction modelling.

Note: ‘*’ Refers to the data used in reaction modelling
cr – corona; s – symplectite
Representative trace-element (including REEs) oxide composition of titanite, magnetite, garnet, amphibole and epidote. Major-element oxide proportion is given in the form of SiO2, Al2O3, CaO and FeO for identification of the mineral. Oxide proportions are provided as weight per cent (wt %)

Note: cr – corona; s – symplectite.
Detailed major-element compositions for the data marked with ‘*’ are given in Table 1; the data point number is same in both the tables.
Representative EPMA analysis of allanite and its altered rim. Oxide proportions are provided as weight per cent (wt %)

Note: c – core; r – rim.
3.b. Petrography
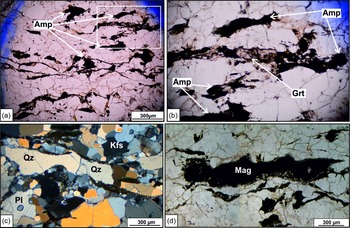
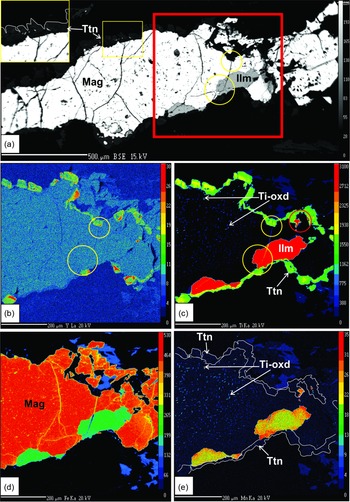
The studied granitic rock is medium grained and contains quartz, feldspar, biotite, amphibole, magnetite and allanite as primary minerals (Fig. 2). Epidote, titanite and garnet along with secondary quartz represent the metamorphic phases. The rock shows well-developed foliation defined by stretched and preferentially oriented primary minerals (Fig. 2a–c). In some cases, the minerals contain fractures. Flattened quartz (Qz) and feldspar show subgrain formation (Fig. 2c). Magnetite (Mag) in this rock contains a variable proportion of exsolved ilmenite, which occurs mostly as granules and rarely as lamellae (Fig. 3). The magnetite also contains some ultrafine lamellar exsolved phases, which do not show any preferred directional orientation within the host (Figs 3c, e, 4b–d). The exact mineralogical composition of these exsolved phases was difficult to determine owing to their ultrafine nature (1–2 microns). However, X-ray element compositional maps indicate that these phases are richer in Ti than their host magnetite (Figs 3c, 4d). Considering this feature, hereafter, we will mention them as Ti-rich oxide (Ti-oxd). Though the Ti-oxd distribution does not define any particular orientation, they show certain patterns within the host. In the presence of ilmenite (Ilm), they are typically absent near the ilmenite granules and only accumulate away from ilmenite (Fig. 3c, e).
(a) Photomicrograph in plane polarized light (PPL) showing the prominent development of foliation defined by the preferred orientation of primary minerals. (b) Zoomed in part of (a) marked with white box. (c) Stretched quartz and feldspar grains in cross polarized light. (d) Elongated magnetite minerals in PPL.

(a) Back-scattered electron photomicrograph showing ilmenite exsolution within magnetite with coronal titanite. (b–e) Y, Ti, Fe and Mn X-ray element maps of (a) marked with red box. Ultrafine Ti-oxd lamellae within magnetite are prominent in (c) and (e). (c) and (e) show that Ti-oxd is present at the contact of the corona but absent near the ilmenite. Titanite corona is marked by white line in (e). Yellow circles in (a), (b) and (c) show the termination of the fracture, developed within magnetite and ilmenite, at the contact of the titanite corona. Note the included ilmenite within the titanite corona (marked with red circle in (c)).

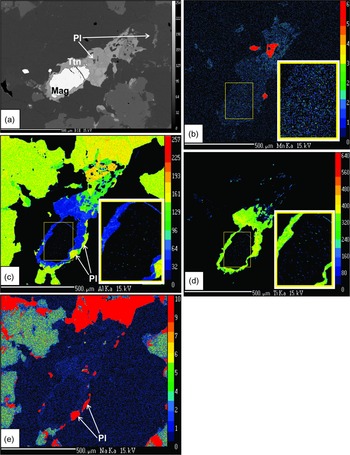
(a) Back-scattered electron photomicrograph showing magnetite with coronal titanite. (b–e) Mn, Al, Ti and Na X-ray element maps of (a). Zoomed in parts (b, c, d) shows the ultrafine Ti-oxd phases within a magnetite grain. Note the absence of ultrafine lamellae in the rim part, adjacent to the titanite corona in (b–d) and a relict plagioclase grain within the titanite corona in (e).

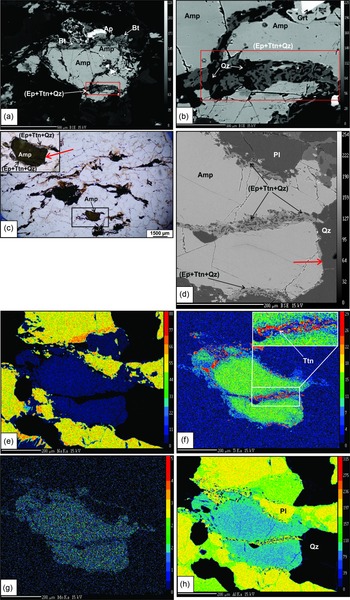
The primary minerals of these rocks were replaced by distinct secondary mineral(s). Epidote (Ep), titanite (Ttn) and quartz (Qz) occur as symplectitic intergrowths along the amphibole (Amp) grain boundaries and fractures (Fig. 5a–h). The degree of replacement by Ep–Ttn–Qz is not the same on all sides of an amphibole grain, and a clear distinction is observed as the symplectitic assemblage is always more common on the rims of amphiboles that are aligned parallel to the foliation direction. This feature is very well illustrated when the assemblage forms on tabular-shaped grains (Fig. 5c). This specific directional preference of this assemblage in terms of their occurrence is observed throughout the rock.
(a) Back-scattered electron (BSE) photomicrograph showing epidote + titanite + quartz symplectite developed parallel to amphibole faces along the grain boundary and also within a fracture. (b) BSE photomicrograph showing the zoomed in part of (a). Red boxes in (a) and (b) show symplectitic assemblage of Ep–Ttn–Qz. (c) Photomicrograph in plane polarized light and (d) BSE photomicrograph showing the directional growth of the reaction rims along the amphibole grain boundary and fractures, respectively. Black arrows in (c) and (d) show the occurrence of the symplectitic assemblage (Ep–Ttn–Qz) on the grain boundaries of amphibole that is oriented along the foliation direction. Red arrows in the same images show the grain boundaries of amphibole at a high angle to foliation lacking any significant symplectitic growth. (e–h) Na, Ti, Mn, Al X-ray element maps showing epidote + titanite + quartz occurring as symplectite within a fracture and along the amphibole grain boundary. Inset in (f) shows the zoomed in part marked with a white box.

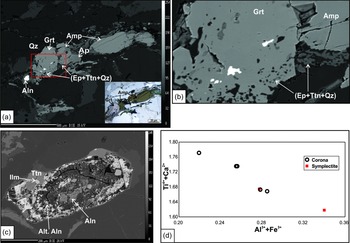
Euhedral garnet grains are found to overprint foliation-defining oriented amphibole (Fig. 6a, b). Though both garnet and the Ep–Ttn–Qz assemblage replace the same mineral, no essential correlation in their occurrence has been observed. The Ep–Ttn–Qz assemblage is found to replace amphibole both in the presence and in the absence of garnet, and vice versa. If they are found in the same domain, Ep–Ttn–Qz is found as inclusions within garnet, and the pattern of the included assemblage continues at the rim of the amphibole adjacent to the host garnet grain (Fig. 6a, b). Other than amphibole, no primary mineral shows a typical association with garnet.
(a) Back-scattered electron (BSE) photomicrograph showing garnet grain replacing amphibole grain following its orientation. Inset in plane polarized light to show the garnet and amphibole. (b) Zoomed in part of (a) marked in red box. Note the epidote + titanite + quartz inclusion trail within the garnet follows the adjacent amphibole rim in (b). (c) BSE photomicrograph showing an altered allanite grain with some titanite grains in the rim part. (d) Relationship between Ti4+ + Ca2+and Al3+ + Fe3+in titanite grains.

Besides symplectite, titanite also occurs as coronas surrounding magnetite. Magnetite, with coronal titanite, may or may not contain ilmenite but always contains Ti-oxd as the exsolved phase. When titanite grows on magnetite without exsolved ilmenite, the spread of the Ti-oxd phases shows a specific pattern in the host magnetite. In this case, the Ti-oxd occurs at the magnetite core and is typically absent at the rim adjacent to the corona (Fig. 4b–d). No such pattern is observed when ilmenite + Ti-oxd exsolution is present within magnetite. Then, the ultrafine Ti-oxd phases are distributed haphazardly within the host but absent near the ilmenite (Fig. 3c). Fractures observed within the host magnetite continue within the exsolved ilmenite (Fig. 3a–c) but show terminations against the corona (Fig. 3a–c). In places, the corona contains relict plagioclase (Fig. 4c, e) and ilmenite (red circle in Fig. 3c). Allanite in these rocks is highly altered, and replacement is present on all sides of the grain; unaltered allanite is found generally in the most interior core of a grain (Fig. 6c).
Considering the textures of the replacing phases, three domains, (i) Ep–Ttn–Qz symplectite at amphibole rim, (ii) euhedral garnet replacing amphibole, and (iii) titanite corona on magnetite (+ ilmenite/Ti-oxd), were identified in this rock, and hereafter they are referred to and treated separately as three micro-reaction domains.
3.c. Mineral chemistry
Magnetite. Magnetite analyses always yield TiO2 (0.13–0.55 wt %; 0.004–0.015 atoms per formula unit (apfu)) and Al2O3 (0.09–0.36 wt %; 0.004–0.016 apfu) along with Fe2O3. The grains show variable amounts of MnO (0.00–0.62 wt %; 0–0.020 apfu). The X-ray compositional map indicates magnetite grains generally lack these elements but contain ultrafine (1–2 microns) lamellae, which are compositionally richer in aluminium, titanium and manganese compared to their host. The composition of those phases could not be determined directly because of their thin nature. However, the higher values of TiO2, Al2O3 and MnO in the magnetite analysis could be related to the occurrence of these exsolved Ti-oxd phases. Magnetite does not contain any significant amount of REEs (Table 2 and X-ray map, Fig. 3).
Ilmenite. Ilmenite in these rocks contain a considerable amount of MnO (∼6 wt %, XPyrophanite = 0.12–0.14). Ilmenite shows <6 wt % Fe2O3 with negligible Al2O3 (<0.06 wt %). Like magnetite, this mineral also does not contain any significant amount of REEs (Fig. 3).
Ti-rich oxide (Ti-oxd). The precise composition of these ultrafine lamellar phases hosted within magnetite could not be determined. The X-ray compositional map suggests that generally these phases are richer in TiO2 and MnO compared to their host (Figs 3c, e, 4b, d) and show variable enrichment in terms of Al2O3 (Fig. 4c). Though they always contain higher MnO than their host, MnO content in the ultrafine lamellae is variable (Figs 3e, 4b).
Amphibole. Amphibole in this rock is classified as pargasite following the scheme of Hawthorne et al. (Reference Hawthorne, Oberti, Harlow, Maresch, Martin, Schumacher and Welch2012). Specific names are mentioned in Table 1. XFe (Fe2+/(Mn + Fe2+ + Mg)) varies between 0.89 and 0.93 with very low XMn (Mn/(Mn + Fe2+ + Mg) ≤ 0.03). In most cases, Fe3+ in amphibole is negligible, rarely reaching 0.224 apfu (Fe3+ was calculated with the method described by Droop, Reference Droop1987). Titanium oxide content in amphibole ranges between 0.08 and 0.82 wt %. Calculation on the basis of 23 oxygens and 16 cations shows that AlIV (8-Si) and (Na + K)total varies between 1.674 and 1.941, and 0.764 and 1.004 apfu, respectively.
Titanite. Coronal and symplectitic titanite do not show any significant compositional difference. The mineral shows variability in terms of CaO (0.90–0.987 apfu), Ti-oxd (0.678–0.788 apfu), Al2O3 (0.169–0.244 apfu) and Fe2O3 (0.051–0.096 apfu). Compositions of the mineral show a higher value of Al3+ + Fe3+, which is generally associated with a lower total and displays a lower content of Ti4+ + Ca2+ (Table 1; Fig. 6d). Available REE data show that grains with high Al3+ + Fe3+ values also contain a higher amount of REEs, dominantly yttrium (Table 2). This is presumably related to the substitution Ti4+ + Ca2+ ⇌ Al3+ (Fe3+) + REE3+ (Y3+). Table 2 (REE) also suggests that titanite does not necessarily contain REEs3+. Similar evidence is demonstrated by the X-ray map (Fig. 3b) for yttrium; it shows that even in a single corona, the element shows distinct inhomogeneity between grains.
Allanite. Allanite in this rock is highly altered. Rarely, the most interior parts (core) of the mineral grains preserve a pristine composition. The altered portion of the mineral grains is distinctly depleted in SiO2 along with Al2O3 and FeO. The pristine allanite composition is dominated by La2O3 and Ce2O3 content, followed by Nd2O3 (Table 3). Similar to the major-element oxides, the proportion of trace-element oxides varies significantly between the allanite and altered parts (Table 3).
Plagioclase. Plagioclase is dominantly albitic in composition; XAlbite (Na/K + Na + Ca) varies between 0.85 and 0.97 (Table 1).
Epidote. XFe3+ (Fe3+/(Fe3+ + Al)) in epidote ranges between 0.23 and 0.27. MnO content varies between 0.41 and 0.77 wt %. TiO2 content of the mineral ranges up to 1.89 wt % (Table 1).
Garnet. Garnet composition is dominated by an almandine component (XFe2+ = 0.37–0.46) with a significant amount of spessartine (XMn = 0.23–0.29) and grossular (XCa = 0.23–0.30). Pyrope content is negligible, and XFe3+ (andradite) varies between 0.02 and 0.10 (Table 1). REE analysis shows that rarely garnet contain dysprosium (Table 2).
4. Reaction modelling
Mass balance equations were modelled to investigate the adjustment of chemical constituents between reactants and products during the formation of the different replacement textures. Gain/loss of components (if occurred), as suggested by the equations, were used to understand the role of mobile components during the reaction. The balanced equation was formulated by applying singular value decomposition (SVD), a matrix factorization method in linear algebra. We used the software program C Space (Torres-Roldan et al. Reference Torres-Roldan, Garcia-Casco and García-Sánchez2000) for this purpose. This technique has been proven to be a robust method for modelling metamorphic textures (Lang & Rice, Reference Lang and Rice1985; Lang et al. Reference Lang, Watcher, Peterson and Ryan2004; Sengupta et al. Reference Sengupta, Bhui, Braun, Dutta and Mukhopadhyay2009; Chowdhury et al. Reference Chowdhury, Talukdar, Sengupta, Sanyal and Mukhopadhyay2013; Banerjee et al. Reference Banerjee, Dutta, Anand and Atlas2019; Adak & Dutta, Reference Adak and Dutta2021). SVD tests the linear dependencies and offers a number of possible mass balance equations considering a matrix composed of minerals (x) in terms of chemical components (y) while modelling reaction textures (details of the SVD method have been described by Chowdhury et al. Reference Chowdhury, Talukdar, Sengupta, Sanyal and Mukhopadhyay2013). The representative equations are chosen by the users on the basis of their observation and interpretation of the natural system. In modelling mineral reactions, the fundamental selection criteria are that the equation should contain reactant and product phases (as predicted from textural relationships) on the opposite sides of the equation (Chowdhury et al. Reference Chowdhury, Talukdar, Sengupta, Sanyal and Mukhopadhyay2013).
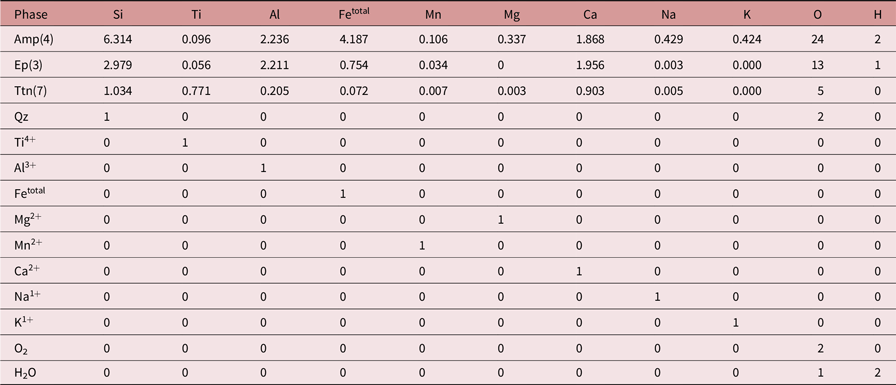
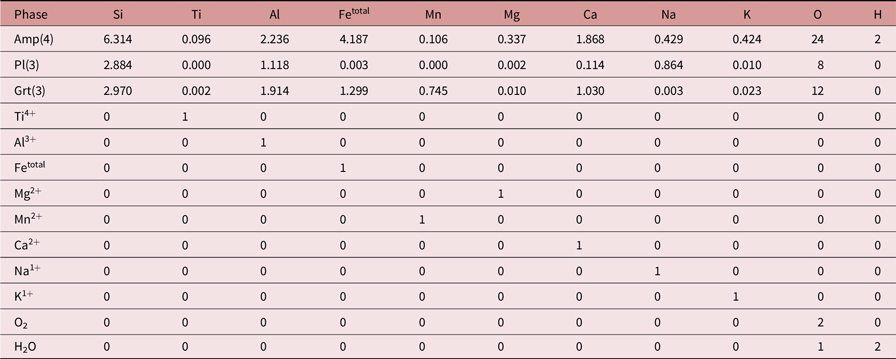
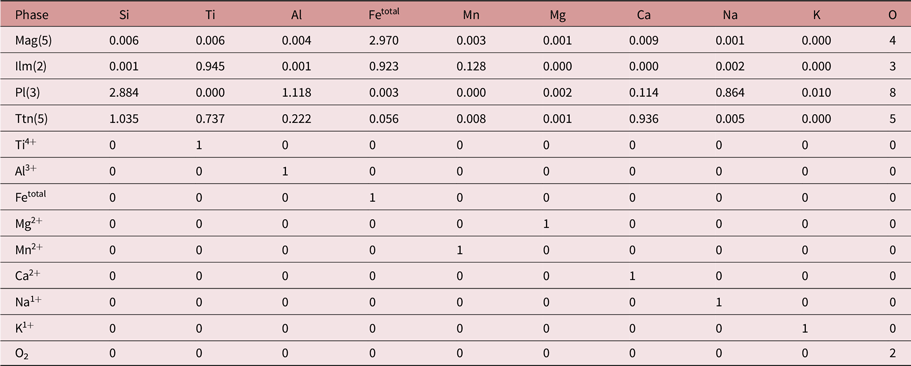
Here we have defined the ‘x’ parameter of the studied matrix by phases and mobile species. The compositions have been expressed as system components that define the ‘y’ parameter of the matrix used for calculation (y). Table 4 represents the three separately designed matrices with the composition used from the three types of textural domains: (i) Ep–Ttn–Qz symplectite (matrix A), (ii) euhedral garnet (matrix B), and (iii) titanite corona (matrix C). For each of the reaction domains, a unique matrix has been defined (Table 4a–c). For the first two matrices (A and B; Table 4a, b) the component number of the ‘y’ parameter is the same (total no. 11), whereas in the third matrix (C; Table 4c) the component number of the ‘y’ parameter is one less. This is because the titanite-forming reaction does not involve any hydrous minerals, so hydrogen was excluded from the components. The ‘x’ parameter in each of the matrices involves mobile species and only those minerals that are interpreted as a part of the reactions from textural relationships. One exception between the matrices in terms of mobile species is that matrix C does not include H2O; other than that, all three matrices contain the same mobile species.
Compositional matrices used in SVD analysis for reaction modelling: matrix used for epidote–quartz–titanite reaction

Note: Amp – amphibole; Ep – epidote; Ttn – titanite; Qz – quartz.
Compositional matrices used in SVD analysis for reaction modelling: matrix used for garnet reaction

Note: Amp – amphibole; Pl – plagioclase; Grt – garnet.
Compositional matrices used in SVD analysis for reaction modelling: matrix used for titanite reaction

Note: Mag – magnetite; Ilm – ilmenite; Pl – plagioclase; Ttn – titanite.
The rationales for choosing appropriate equation(s) representing the observed reaction relationships have been discussed individually for the three types of replacement textures under Sections 4.a–c. Reaction volume change (ΔVs =ΣVproduct − ΣVreactant)/ΣVreactant) × 100) was calculated using the molar volume of the phases (see Appendix). Molar volumes for the phases were determined using the thermodynamic dataset of Holland & Powell (Reference Holland and Powell2011, updated in 2012) and the computer program Perple_X 6.9.1 (Connolly, Reference Connolly2005, updated in 2021) and the mole fraction of the end-members of each phase. The volume proportions of the minerals from textural observations were estimated using the ImageJ software (Hu et al. Reference Hu, Li, Yu and Yang2019) Abbreviations used for the phases in the reactions are as follows: amphibole (Amp), epidote (Ep), quartz (Qz), garnet (Grt), magnetite (Mag), ilmenite (Ilm), plagioclase (Pl) and titanite (Ttn), following Whitney & Evans (Reference Whitney and Evans2010). Parentheses after equations include the ΔVs of the reaction, and the volume proportion of reactant/product minerals and elements released or generated to form 1 mole of product.
4.a. Epidote–titanite–quartz symplectite
Epidote, titanite and quartz symplectite always occurs either within amphibole fractures or at amphibole rims in contact with quartz/feldspar (Fig. 5). This texture suggests amphibole was the only reactant in the symplectite-forming reaction. So, in matrix A (Table 4a) the ‘x’ parameter involves only amphibole, epidote, titanite (symplectitic) and quartz minerals, along with other mobile species. The solution of matrix A offers several reactions; the following reaction most closely matching the Ep–Ttn–Qz proportion in the symplectite (∼47:35:18) was considered.
-
Reaction 1: 15.290 Amp + 18.311 Ti4+ + 19.506 Ca2+ = 13.173 Ep + 24.697 Ttn + 31.763 Qz + 52.310 Fetotal + 5.079 Mg2+ + 1 Mn2+ + 6.397 Na1+ + 6.483 K1+ + 8.704 H2O
-
(ΔVs = −6 %, Ep:Ttn:Qz = 46.77:34.80:18.43)
The reaction shows a negative ΔVs and an Ep–Ttn–Qz proportion of ∼47:35:18.
4.b. Euhedral garnet
In addition to Ep–Ttn–Qz symplectite, amphibole has also been replaced by euhedral garnet in the studied rock. The two replacement assemblages do not show any systematic textural association/relationship between them. Other than amphibole, no particular primary mineral is typically found to be associated with garnet. However, to understand the influence of other primary minerals, we have modelled the reactions with two approaches: (i) garnet from only amphibole (Reaction 2) and (ii) garnet from amphibole and plagioclase (Reactions 3–6). The matrix is given as matrix B in Table 4b. The solution for the matrix yielded four rational reactions having garnet and its reactants (amphibole, plagioclase) on the opposite sides of the equation. The reactant amphibole (± plagioclase) in this rock does not contain any significant manganese (Table 1), whereas the product garnet contains 24–29 mol % spessartine. To estimate the amount of manganese needed to form 1 mole of garnet (12 oxygen basis), the Mn/Grt ratio is indicated for each of the equations in parentheses.
-
Reaction 2: 10.903 Amp + 19.982 Al3+ + 16.108 Mn2+ + 3.507 Ca2++ 14.775 O2 = 23.361 Grt + 1 Ti4+ + 17.246 Fetotal + 3.441 Mg2+ + 4.397 Na1+ + 4.576 K1+ + 10.903 H2O
-
(ΔVs = −6 %; Mn/Grt = 0.69)
-
Reaction 3: 11.17 Amp + 12.65 Pl + 29.84 Al3+ + 25.65 Mn2++ 14.80 Ca2+ + 37.12 O2 = 36.02 Grt + 1 Ti4+ + 3.43 Mg2+ + 15.61 Na1+ + 4.03 K1+ + 11.17 H2O
-
(ΔVs = −0.02 %; Amp:Pl = 71:29, Mn/Grt = 0.71)
-
Reaction 4: 20.61 Amp + 973.74 Pl + 758.91 Al3+ + 1195.96 Fetotal + 1 Mg2+ + 734.89 Mn2+ + 869.54 Ca2+ + 4.28 K1+ + 1804.19 O2 = 989.37 Grt + 847.19 Na1+ + 20.61 H2O
-
(ΔVs = 15 %; Amp:Pl = 5:95, Mn/Grt = 0.74)
-
Reaction 5: 81.83 Amp + 3351.02 Pl + 2631.69 Al3+ + 4100.23 Fetotal + 2545.16 Mn2+ + 2995.92 Ca2+ + 10.64 K1+ + 6222.60 O2 = 3427.96 Grt + 1 Ti4+ + 2920.11 Na1+ + 81.83 H2O
-
(ΔVs = 15 %; Amp:Pl = 6:94, Mn/Grt = 0.74)
-
Reaction 6: 30.60 Amp + 930.46 Pl + 745.16 Al3+ + 1127.27 Fetotal + 718.33 Mn2+ + 834.39 Ca2+ + 1737.68 O2 = 968.56 Grt + 1 Ti4+ + 2.49 Mg2+ + 814.14 Na1+ + 30.60 H2O
-
(ΔVs = 14 %; Amp:Pl = 8:92, Mn/Grt = 0.74)
The equations to show garnet formation demonstrate that Amp:Pl volume proportion can vary significantly in the reaction. Reaction 2 suggests garnet can be formed from amphibole only (Amp:Pl = 100:0), Reaction 3 suggests Amp:Pl in the reaction requires a 71:29 ratio, and Reactions 4–6 indicate this ratio can be as low as 5–8:92–95. Textural attributes demonstrate that the garnet domain always contains amphibole. However, no specific choice for the other primary minerals was observed as garnet + amphibole is found near plagioclase/alkali feldspar/quartz.
If we consider this relationship, the role of amphibole as a reactant becomes obvious, but the same cannot be stated for the other primary phases. Therefore, reactions yielding insignificant amphibole compared to plagioclase (Reactions 4–6) are found not to be suitable for explaining the observed texture. We have chosen Reactions 2 and 3 as representative equations out of the five reactions (Reactions 2–6) modelled for garnet formation. These two reactions show a negative ΔVs (Reaction 3 gives a negligible value for ΔVs, ∼0) and suggest 0.69–0.71 moles of Mn2+ need to be added to form 1 mole of garnet (12 oxygen basis).
4.c. Titanite coronas
Titanite coronas grow on magnetite that contains ultrafine lamellar Ti-oxd and/or exsolved ilmenite (Figs 3, 4). The corona contains ilmenite and plagioclase as relics and girdles the magnetite grain (Figs 3c, 4c, e). This feature suggests that the three minerals were reactants for titanite formation. Incidentally, in ilmenite-absent grains, the magnetite rim lacks Ti-oxd, though the core contains the ultrafine phases (Fig. 4d). Moreover, this Ti-oxd absent zone within the host continues along adjacent to the corona, and such zoning is absent where titanite rims ilmenite-containing magnetite grains (Fig. 3c, e). Together the textures suggest that in ilmenite-absent grains Ti-oxd probably acted as a reactant for corona formation.
Because of the ultrafine nature of the Ti-oxd lamellae, their composition could not be determined, and we modelled the titanite corona-forming reactions considering magnetite + ilmenite + plagioclase as a reactant. Matrix C contains magnetite, ilmenite, plagioclase and titanite minerals along with the other mobile species (Table 4c) as the ‘x’ parameter. The solution yields seven equations having plagioclase + magnetite + ilmenite and titanite on the opposite side.
-
Reaction 7: 69810.062 Mag + 89.765 Ilm + 100 Pl = 683.430 Ttn + 239.409 Al3+ + 207380.765 Fetotal + 69.327 Mg2+ + 215.453 Mn2+ + 152.972 Na1+ + 1 K1+ + 138446.196 O2
-
(ΔVs = −99 %; Mag:Ilm = 99.91:0.09, Mag:Ilm:Pl = 99.59:0.09:0.32; Mn/Ttn = 0.32, Mag/Ttn = 102.15, Ilm/Ttn = 0.13)
-
Reaction 8: 79.317 Mag + 217.334 Ilm + 100 Pl + 249.327 Ca2+ = 279.317 Ttn + 50.326 Al3+ + 420.830 Fetotal + 25.822 Mn2+ + 85.517 Na1+ + 1 K1+ + 186.343 O2
-
(ΔVs = −25 %; Mag:Ilm = 34.09:65.91, Mag:Ilm:Pl = 17.43:33.71:48.86; Mn/Ttn = 0.09, Mag/Ttn = 0.28, Ilm/Ttn = 0.78)
-
Reaction 9: 2342.226 Mag + 240.128 Ilm + 1689.079 Pl + 3237.949 Ti4+ + 4204.645 Ca2+ = 4720.384 Ttn + 850.074 Al3+ + 6918.775 Fetotal + 1 Mg2+ + 1438.585 Na1+ + 16.891 K1+
-
(ΔVs = −8 %; Mag:Ilm = 93.25:6.75, Mag:Ilm:Pl = 37.38:2.70:59.92; Mn/Ttn < 0.01, Mag/Ttn = 0.50, Ilm/Ttn = 0.05)
-
Reaction 10: 79.196 Mag + 93.066 Ilm + 100 Pl + 117.346 Ti4+ + 249.215 Ca2+ = 279.196 Ttn + 50.228 Al3+ + 305.778 Fetotal + 9.916 Mn2+ + 85.269 Na1+ + 1 K1+
-
(ΔVs = −7 %; Mag:Ilm = 54.66:45.34, Mag:Ilm:Pl = 21.57:17.89:60.54; Mn/Ttn = 0.04, Mag/Ttn = 0.28, Ilm/Ttn = 0.33)
-
Reaction 11: 958.524 Mag + 410.279 Ilm + 2482.691 Pl + 4709.454 Ti4+ + 1 Mg2+ + 6189.122 Ca2+ + 4846.535 O2 = 6923.906 Ttn + 1242.786 Al3+ + 2845.212 Fetotal + 2112.205 Na1+ + 24.827 K1+
-
(ΔVs = 26 %; Mag:Ilm = 76.80:23.20, Mag:Ilm:Pl = 14.16:4.28:81.56; Mn/Ttn < 0.01, Mag/Ttn = 0.14, Ilm/Ttn = 0.06)
-
Reaction 12: 79.145 Mag + 39.731 Ilm + 100 Pl + 167.709 Ti4+ + 249.167 Ca2+ + 79.976 O2 = 279.145 Ttn + 50.186 Al3+ + 256.399 Fetotal + 3.090 Mn2+ + 85.163 Na1+ + 1 K1+
-
(ΔVs = 4 %; Mag:Ilm = 73.84:26.16, Mag:Ilm:Pl = 24.02:8.51:67.47; Mn/Ttn = 0.01, Mag/Ttn = 0.28, Ilm/Ttn = 0.14)
-
Reaction 13: 79.121 Mag + 15.591 Ilm + 100 Pl + 190.504 Ti4+ + 249.145 Ca2+ + 116.175 O2 = 279.121 Ttn + 50.167 Al3+ + 234.049 Fetotal + 85.115 Na1+ + 1 K1+
-
(ΔVs = 10 %; Mag:Ilm = 87.79:12.21, Mag:Ilm:Pl = 25.32:3.52:71.15; Mn/Ttn < 0.01, Mag/Ttn = 0.28, Ilm/Ttn = 0.06)
Modelled garnet-forming reactions demonstrate that manganese is required to be added to balance the mass in the equations (Section 4.b). In contrast, all the titanite-forming reactions release manganese, though the amount varies significantly. The volume proportion of reactants (Mag, Ilm, Pl) to form titanite also shows variation and, depending on that, the released Mn2+ amount ranges from 0.01 to 0.32 moles/mole of titanite. Reaction 7 suggests that 0.32 moles of Mn2+ can be yielded during titanite formation. Calculated ΔVs of Reactions 7–10 are negative but positive for Reactions 11–13.
5. Thermodynamic modelling
5.a. Pseudosection
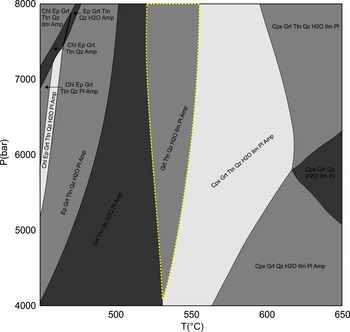
Quartz and alkali feldspar are the most dominant primary phases in the studied rock; however, these minerals along with biotite do not suggest any definite textural relationships to imply that they took part in the different metamorphic reactions. The texture indicates that plagioclase, magnetite (+ Ilm/Ti-oxd) and amphibole are the primary phases that certainly acted as reactants (Section 4) to form different metamorphic assemblages (Ep–Ttn–Qz symplectite, Grt and coronal Ttn). These observations suggest that most parts of the rock did not participate in the reaction. Hence, a bulk rock composition seems an inadequate proxy to be used to model the pseudosection in evaluating the P–T conditions of metamorphism (Nasipuri et al. Reference Nasipuri, Bhattacharya and Das2009). We estimated an average reaction bulk composition by proportionately combining the compositions of only the reactant and product minerals from the different reaction zones as observed in the studied rock. Using the bulk, a pseudosection was calculated with Perple_X (version 6.9.1; Connolly, Reference Connolly2005, updated in 2021) in the Na2O–CaO–FeO–Fe2O3–MgO–Al2O3–SiO2–H2O–MnO–TiO2 system. The internally consistent thermodynamic dataset TC-DS62 (Holland & Powell, Reference Holland and Powell2011) was used for the calculation. The solution models used for the calculation are clinopyroxene (Green et al. Reference Green, White, Diener, Powell, Holland and Palin2016), plagioclase (Holland & Powell, Reference Holland and Powell2003), garnet (White et al. Reference White, Powell, Holland, Johnson and Green2014 a), chlorite (White et al. Reference White, Powell, Holland, Johnson and Green2014 a,b), epidote (Holland & Powell, Reference Holland and Powell2011), clinoamphibole (Green et al. Reference Green, White, Diener, Powell, Holland and Palin2016), spinel (White et al. Reference White, Powell and Clarke2002), ilmenite (White et al. Reference White, Powell, Holland and Worley2000, Reference White, Powell and Johnson2014 b) and melt (Green et al. Reference Green, White, Diener, Powell, Holland and Palin2016). Calculations show that melt is only stable at a temperature higher than 750 °C. Figure 7 shows the stability field for the reaction assemblages of the studied rock (marked with a yellow dotted border), which is amphibole (Amp) + garnet (Grt) +plagioclase (Pl) + ilmenite (Ilm) + titanite (Ttn) ± H2O. The pressure cannot be precisely constrained for this assemblage, but a small temperature range of 525–550 °C is suggested for stabilization of the metamorphic assemblages.
Pseudosection calculated with effective reaction bulk composition. The composition used is (oxides in wt %): SiO2 = 42.64, TiO2 = 4.26, Al2O3 = 10.89, MgO = 0.49, FeO = 16.64, Fe2O3 = 12.97 CaO = 9.16, MnO = 0.78, Na2O = 2, H2O = 1.26. Yellow dotted line borders the representative assemblage of this study; see text for details.

5.b. Conventional geothermobarometry
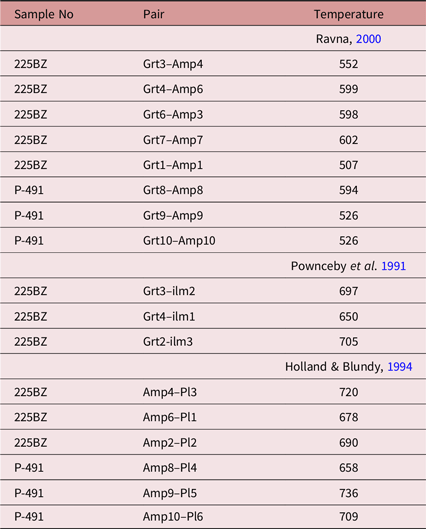
Besides pseudosection calculation, we also estimated the temperature through a number of geothermometers (Table 5). The results of this conventional thermometry along with pseudosection modelling are analysed in the discussion (Section 7.f).
Temperature calculated (at 6 kbar) using mineral composition from the studied meta-granite

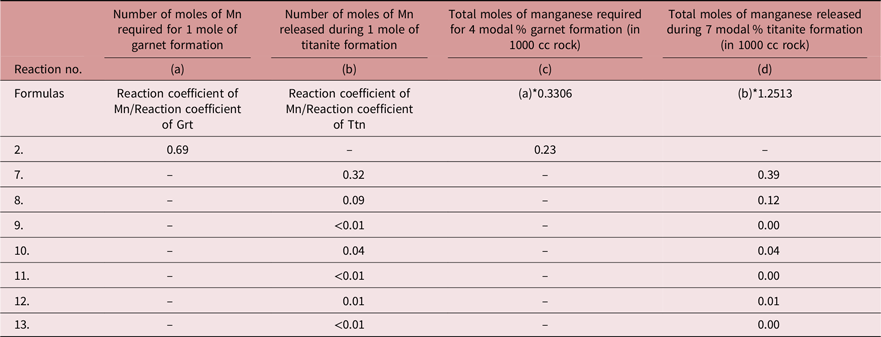
Calculation showing moles of manganese added and released during garnet- and titanite-forming reactions, respectively

Note: Considering 4 modal % of Grt and 7 modal % of titanite, each 1000 cc rock contains 0.3306 moles of garnet and 1.2513 moles of titanite, respectively.
6. Zircon geochronology
Zircon grains were analysed from one representative meta-granite sample (P-472) for U–Pb ages via laser ablation multi-collector inductively coupled plasma mass spectrometry (LA-MC-ICP-MS) at WIHG, Dehradun. The instrument consisted of a MC-ICP-MS system (Neptune Plus, Thermo Fisher Scientific, Inc.) and a 193 nm excimer laser (UV Laser, Model Analyte G2, Cetec-Photon machine, Inc.), equipped with a high-performance HelEx–II sample chamber. The methodology adopted was similar to that of Mukherjee et al. (Reference Mukherjee, Singhal, Adlakha, Rai, Dutt, Kharya and Gupta2017). The analyses were carried out with an energy density of 4 J cm–2, a repetition rate of 5 Hz, a 75 % laser intensity and 175 total shots per analysis, i.e. 35 s analysis time for each spot with 10 s background measurement. The correction for U–Pb down-hole fractionation was performed using the Z 91500 zircon standard (thermal ionization mass spectrometry (TIMS) normalization data 206Pb–238U age = 1062.32 ± 2.22 Ma (2 sigma); Wiedenbeck et al. Reference Wiedenbeck, Allé, Corfu, Griffin, Meier, Oberli, Von Quadt, Roddick and Spiegel1995), and the accuracy was checked using the Plesovice zircon standard (isotope dilution (ID) TIMS 206Pb–238U age = 337.13 ± 0.37 Ma; Sláma et al. Reference Sláma, Kosler, Condon, Crowley, Gerdes, Hanchar, Horstwood, Morris, Nasdala, Norberg, Schaltegger, Schoene, Tubrett and Whitehouse2008). The Iolite software was used for data reduction (Paton et al. Reference Paton, Hellstrom, Paul, Woodhead and Hergt2011), and Isoplot 4.15 was used for plotting the data (Ludwig, Reference Ludwig2008).
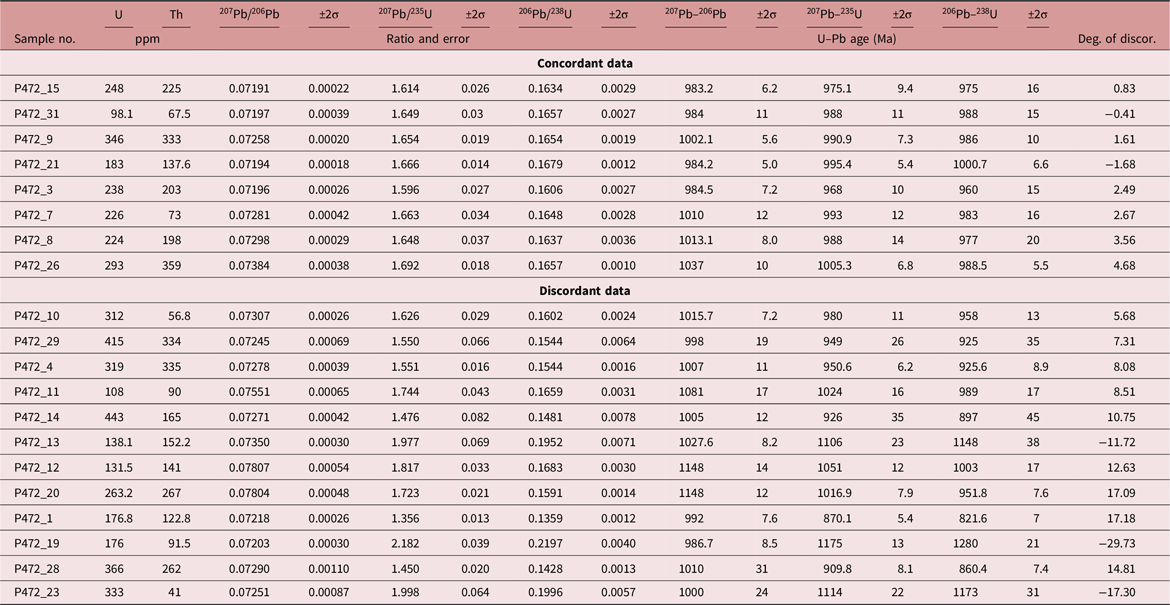
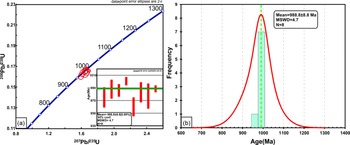
Zircon U–Pb age data are presented in Table 7. Zircon grains in the meta-granite (sample P-472) are subhedral to euhedral and 100–200 μm in length with aspect ratios of 2–4. Zircon grains are optically clear and colourless. The morphology and internal structure of the grains suggest crystallization from magma; therefore, the ages obtained are taken to represent the timing of magma crystallization. Data with less than a ±5 % degree of discordance are considered as concordant ages (Table 7). The 206Pb/238U and 207Pb/235U ratios of concordant zircon grains are plotted on a Concordia diagram (Fig. 8a). The 206Pb–238U concordant age varies from 960 to 1000 Ma, and the weighted average 206Pb–238U age of concordant data is 988.8 ± 8.8 Ma with a mean square weighted deviation (MSWD) = 4.7.
LA-ICP-MS U–Pb zircon age data of granite (P-472)

(a) Concordia diagram for LA-ICP-MS zircon grains from the meta-granite showing the concordant data plot (< ±5 % degree of discordance). Inset shows the weighted average age of 206Pb–238U concordant data. (b) Plot of probability density and histogram of concordant zircon ages.

7. Discussion
7.a. Exsolved phase composition and their genesis within magnetite
In the structure of magnetite, a small amount of substitution can occur by Al3+ replacing Fe3+ and Mn2+/Mg2+/Ca2+/Fe2+ (Deer et al. Reference Deer, Howie and Zussman2013, p. 404). The mineral can also contain a considerable amount of Ti, as magnetite and the ulvöspinel molecule (Fe2TiO4) have a continuous relationship (Deer et al. Reference Deer, Howie and Zussman2013, p. 404). Beside ilmenite (FeTiO3), generally, ulvöspinel (Fe2TiO4) and pleonaste (MgxFe1–xAl2O4, x = 0–1) exsolve as a result of subsolidus cooling of Ti-rich magnetite (Tan et al. Reference Tan, Breivik, Trønnes, Mjelde and Azuma2016). In the studied rock, magnetite contains large lamellae/granules of exsolved ilmenite and/or ultrafine lamellae of Ti-oxd (Figs 3, 4). This exsolved ilmenite is considerably Mn rich, whereas the ultrafine lamellar phases show higher contents of Mn and Ti than their host and contain a variable amount of Al (Figs 3, 4).The composition of these fine lamellar phases could not be accurately determined to test if their composition matches with ulvöspinel (Fe2TiO4) and/or pleonaste (MgxFe1–xAl2O4, x = 0–1). Integration of the information obtained through the X-ray intensity map for Ti-oxd and compositional analysis of ilmenite indicates that the parent oxide, i.e. pre-exsolution magnetite, in this rock was richer in Ti, Mn and Al (minor in amount) compared to the post-exsolution host. Magnetite with ilmenite + Ti-oxd or with Ti-oxd only (Figs 3, 4) could result from subtle compositional differences between pre-exsolution magnetite grains (Price & Putnis, Reference Price and Putnis1979; Price, Reference Price1980; Amcoff & Figueiredo, Reference Amcoff and Figueiredo1990; Tan et al. Reference Tan, Breivik, Trønnes, Mjelde and Azuma2016). Magnetite grains containing Ilm + Ti-oxd might have a higher amount of Ti4+ than the one containing only Ti-oxd, before exsolution.
The absence of any exsolved phase between ilmenite and Ti-oxd in Figure 3 is presumably linked to the low mobility of the element Ti4+. While exsolving from the parent Ti-rich magnetite, ilmenite took Ti4+ into its structure. However, the element could not become incorporated within the ilmenite from a greater distance and eventually, in those zones Ti-oxd exsolved within magnetite. However, the Ti-oxd free rim in Figure 4 is related to metamorphic reactions and is discussed in Section 7.b.
Ilmenite can exsolve through exsolution or oxy-exsolution processes at a wide temperature range, but ulvöspinel exsolves at ∼600 °C and Pleonaste at ∼900 °C (Vincent et al. Reference Vincent, Wright, Chevallier and Mathieu1957; Turnock & Eugster, Reference Turnock and Eugster1962; Buddington & Lindsley, Reference Buddington and Lindsley1964; Tan et al. Reference Tan, Breivik, Trønnes, Mjelde and Azuma2016). The uneven distribution of Mn2+ within ilmenite granules and between lamellae of Ti-oxd (Figs 3, 4) demonstrates a lack of homogenization even at the grain-scale during their formation.
7.b. Interpretation of reactant–product relationship in replacement texture
In this rock, amphibole is replaced by two types of metamorphic assemblages: Ep–Ttn–Qz symplectite and euhedral garnet. Inclusion of the symplectite within garnet rims and a continuation of the trail at the rim of the adjacent amphibole (Fig. 6a, b) is unlikely to develop had garnet–epidote–titanite–quartz replaced amphibole simultaneously. This textural relationship rather suggests that partial replacement of the amphibole rim by Ep–Ttn–Qz was followed by complete consumption of the same amphibole grain by euhedral garnet. The sequential replacement captured the imprint of an earlier formed texture (Ep–Ttn–Qz symplectite) as an inclusion within the phase that developed later (garnet). The reactions can be described as: (i) Am → Ep + Ttn + Qz followed by (ii) Am → Grt.
Coronal titanite in this rock presumably grew by the reaction Mag + Ilm(/Ti-oxd) + Pl → Ttn. Relict ilmenite and plagioclase within a corona that grew around magnetite (Figs 3c, 4c, e) identifies all these minerals as reactants. A Ti-oxd absent magnetite rim adjacent to the corona (Fig. 4) suggests that the rim is a product phase and formed as the coronal titanite grew on the reactant magnetite + Ti-oxd. The feature illustrates the participation of Ti-oxd in the titanite-forming reaction. However, in the presence of ilmenite, Ti-oxd probably did not react. This can be inferred from the random distribution of Ti-oxd against the corona formed around magnetite that hosts both ilmenite and Ti-oxd (Fig. 3, note relict ilmenite within corona). Involvement of the exsolved phases as a reactant in the corona reaction implies that the replacement occurred after subsolidus cooling of the magmatic protolith.
7.c. Relationship of the reaction textures with deformational fabric
The typical occurrence of the Ep–Ttn–Qz symplectite along the foliation-parallel rims of amphibole and their rare occurrence on the margins occurring at a high angle (Fig. 5c) presumably implies that the assemblage developed in an event(s) affected by differential stress, i.e. syn-deformational growth. Several studies have reported preferable growth site selection by syn-tectonic metamorphic phases (Simpson & Wintsch, Reference Simpson and Wintsch1989; Brodie, Reference Brodie1995; Moore et al. Reference Moore, Beinlich, Austrheim and Putnis2019). In foliated rock, the grain margins aligned parallel to the foliation are likely to experience higher compressive stress than those oriented at a high angle. Moore et al. (Reference Moore, Beinlich, Austrheim and Putnis2019) have shown that the margins of a grain oriented at a high angle to each other can see different replacement assemblages (grown coevally), owing to the variation resulting from differential stress acting on those faces. Centrella et al. (Reference Centrella, Putnis, Lanari and Austrheim2018) have reported a similar result as they found variable metamorphic phases due to stress differences in different parts of a deformed parent grain. Another observation in relation to this is that the Amp → Ep–Ttn–Qz symplectite transformation involves 5 % net volume loss during the reaction. Simpson & Wintsch (Reference Simpson and Wintsch1989) and Brodie (Reference Brodie1995) discussed the effect of change in volume during reaction from their studies involving symplectite-like delicate textures developed during deformation. Brodie (Reference Brodie1995) showed that a product assemblage associated with a net volume increase during reaction is inhibited on the reactant face that experiences a higher normal stress and was rather preferred at potentially dilatant grain margins. Simpson & Wintsch (Reference Simpson and Wintsch1989) proposed that a reaction involving a net volume decrease is favoured at reactant margins facing high normal stress during deformation. This argument explains the choice of a high-stress reactant boundary (amphibole) by Ep–Ttn–Qz as its growth site during deformation (Simpson & Wintsch, Reference Simpson and Wintsch1989; Vernon, Reference Vernon1991).
The preferred choice for growth site, as shown by the Ep–Ttn–Qz assemblage, is not observed in the case of garnet and titanite coronas. These phases are found to replace the parent phase completely (as in Amp → Grt) or grow on them from all sides as coronas (Mag + Ilm(/Ti-oxd) + Pl → Ttn). These features suggest that garnet and coronal titanite grew without any significant differential stress, a condition unlike the one in which Ep–Ttn–Qz symplectite formed. We interpret that the metamorphic imprint of garnet and titanite coronas postdates the deformational event during which the symplectitic assemblage formed. Also, titanite coronas occurring on all sides of elongated and fractured magnetite or euhedral garnet replacing foliation-defining amphibole suggest that these minerals formed later than the regional deformation, during which the reactants became aligned. On the other hand, the development of an Ep–Ttn–Qz assemblage mostly along the foliation-parallel rim of amphibole grains signals that the replacement could be concurrent to the development of regional schistosity defined by amphibole orientation.
7.d. The implications of the reaction volume change (ΔVs)
Total porosity content in rock can be influenced by factors such as deformation, solid volume decrease, the amount of reactant dissolved versus the amount of product precipitated, etc. (Rutter & Brodie, Reference Rutter and Brodie1995; Putnis, Reference Putnis2002, Reference Putnis2009; Spruzeniece et al. Reference Spruzeniece, Piazolo, Daczko, Kilburn and Putnis2016). The porosity formed at the initial stage of the reaction is not likely to be preserved in the rock, as the final microstructural features represent a modified scenario. This is specifically true for syn-tectonic metamorphic events, as the texture may get reshaped through equilibration after deformation (Rutter & Brodie, Reference Rutter and Brodie1995).
However, many recent studies suggest that the porosity developed through reactions during fluid-aided metamorphism (metasomatism) plays a crucial role even at high P–T conditions (Fusseis et al. Reference Fusseis, Regenauer-Lieb, Liu, Hough and De Carlo2009; Svahnberg & Piazolo, Reference Svahnberg and Piazolo2013; Spruzeniece et al. Reference Spruzeniece, Piazolo, Daczko, Kilburn and Putnis2016). This is because porosity formed during reactions (instantaneous porosity) extends the scope for reactions by increasing the possibility of reactive parent grain exposure to the fluid (Putnis, Reference Putnis2009). In this section, we discuss the effect of reaction-generated instantaneous porosity formed owing to a change in solid volume (ΔVs; Section 4). The observed texture of the studied rock has been interpreted in terms of the creation/destruction of porosity during the reaction and its effect on fluid–rock interactions and reaction kinetics.
A negative value for solid volume change (ΔVs %) in metamorphic reactions implies that the product phases formed through reaction occupy a lesser volume in a rock than their reactants, and vice versa is true for a positive value. In the present study, the chosen equations for Ep–Ttn–Qz and Grt (Reactions 1–3) suggest a negative ΔVs with a ≤6 vol. % change during replacement of amphibole by these minerals. The titanite-forming reactions (Reactions 7–13) offer a variable range for ΔVs.
A negative ΔVs for the Amp → Grt reaction (Reactions 2, 3) suggests the creation of instantaneous porosity, i.e. an increase in the scope of fluid–parent mineral interaction and a rising Amp → Grt transformation rate. Though Amp → Ep–Ttn–Qtz (Reaction 1) also suggests volume loss during deformation (ΔVs = −6 %), unlike garnet, symplectite replaces amphibole only meagrely at its rim/within the fracture. However, their typical occurrence on foliation-parallel amphibole grains is supported by the argument that reaction involving a net volume decrease prefers product growth on reactant margins facing higher stress (Simpson & Wintsch, Reference Simpson and Wintsch1989; Centrella et al. Reference Centrella, Putnis, Lanari and Austrheim2018). We also suggest that a lesser degree of replacement by the symplectitic assemblage could be related to their syn-deformational growth. Though volume loss (negative ΔVs) could lead to the attainment of chemical equilibrium through parent grain–fluid interaction, the communication scope was probably adversely affected during continuous deformation (Rutter & Brodie, Reference Rutter and Brodie1995).
Depending on the proportion of reactants, titanite-forming reactions yield negative (Reactions 7–10) and positive (Reactions 11–13) values for ΔVs. Titanite in this rock replaces magnetite to a variable extent but commonly forms thin coronas around its reactant suggesting limited replacement. Positive ΔVs values (Reactions 11–13) during the reaction can explain the feature, as solid volume gain could block avenues for fluid–rock interaction, in turn minimizing/diminishing the scope of further reaction. Other than this reason, the limited occurrence could have also been related to the fact that this reaction involves more than one reactant. In such a case, even if porosity is created (negative ΔVs, Reactions 7–10), the proportion of reactants such as ilmenite/Ti-oxd and plagioclase that is available at the reaction site could have controlled the degree of replacement by titanite.
7.e. Evidence for exchange of components between reaction domains during metamorphism and its implications
The modelled mass balance equations demonstrate the addition and release of components (Reactions 1–13; Section 4), suggesting an open system behaviour of each domain at the scale of the reaction. In the studied rock, the texturally related reactant–products show a notable difference in their composition; a specific component present within the product in high amounts has negligible content in the reactant. In the garnet–amphibole domain, garnet shows a very high content of spessartine (XMn = 0.23–0.29), but reactant amphibole contains negligible Mn2+. Interestingly, this element is found in the oxide phases, specifically in ilmenite (Mn2+ content is 0.118–0.128 apfu) and Ti-oxd (Figs 3e, 4b), but the product titanite (corona) of this domain has very low Mn2+ content (Mn2+ < 0.01 apfu; Figs 3e, 4b). The mass balance equations show that manganese as a component was required to be added to form garnet (Reactions 2, 3) and that this element was released during coronal titanite formation (Reactions 7–11).
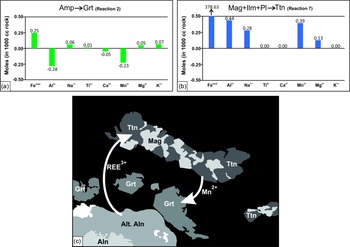
Calculations suggest that 0.69 moles of Mn2+ is required to form each mole of garnet, and 0.32 moles of Mn2+ are released as 1 mole of titanite forms (Table 6). The modal proportion of garnet (4 modal %) and coronal titanite (7 modal %) in the studied rock is very low and is equivalent to a ratio of 36:64 (Grt:Ttn). Considering this modal amount, each 1000 cc of the rock would contain ca. 0.33 moles of garnet and 1.25 moles of titanite (molar volume data of garnet is taken from Holland & Powell, Reference Holland and Powell2011, updated in 2012). To form 0.33 moles of garnet, 0.23 moles of Mn2+ is required to be added during the reaction (Table 6), whereas a variable amount of Mn2+, up to 0.39 moles, is released by Reactions 7–13 to develop 1.25 moles of titanite (Table 6). Gain and loss of Mn2+ moles by garnet- and titanite-forming reactions are balanced even when a ±10 % variation is made to the modal ratio of Grt:Ttn (36:64). For a 26:74 ratio, the Mn2+ required versus released ratio is 0.17:0.45, and for a 46:54 ratio of Grt:Ttn, the Mn2+ added versus released ratio is 0.34:0.39 (calculations done using Reactions 2 and 7 for 1000 cc rock). Notwithstanding the uncertainties of these calculations, the Mn2+ liberated during titanite formation is sufficient to explain the observed Mn2+ content in garnet if both the metamorphic reactions had operated together (Fig. 9a, b).
Histogram representing the gain and loss of elements during (a) Grt and (b) Ttn corona-forming reactions. Negative values suggest elements are required and positive values imply elements are released during the reaction. (c) Schematic diagram showing the possible elemental exchange between titanite, magnetite (+ Ti-oxd ± ilmenite) garnet and allanite.

All the mentioned calculations suggest that though the very high spessartine component in garnet of this rock cannot be explained from the Amp → Grt reaction alone, it can be well justified if manganese released during ilmenite replacement (by titanite) is incorporated within garnet. Similar to the spessartine content, high Fe3+ (XFe3+ (andradite) up to 0.10) in some garnet grains could also have been sourced from magnetite as the mineral broke down to form titanite. Therefore, not just amphibole but also the disintegration of the oxide minerals was crucial for garnet formation in this rock, as the masses from one reaction zone were moved to other through a dissolution–transportation–reprecipitation process (Putnis & Austrheim, Reference Putnis and Austrheim2010). The interaction between reaction sites does not only suggest that the phases grew together but also demonstrates that the two texturally unrelated domains were in equilibrium with each other through chemical exchange. This specific relationship cannot be inferred from textural aspects alone.
In this rock, the exchange of components was not limited to only between the Mag (+ Ilm/Ti-oxd)–Ttn and Amp–Grt domains: allanite was also a part of the interconnected reactions. High REE3+ (yttrium, Y) content in some titanite (Table 2; Fig. 3b) grains (both in symplectite and coronas) suggests Ca2+Ti4+ = REE3+Al3+ substitution (Hughes et al. Reference Hughes, Bloodaxe, Hanchar and Foord1997) in the mineral. Mag (+ Ilm/Ti-oxd) and plagioclase, the parent minerals for titanite, do not contain REEs3+, whereas allanite contains a significant amount of REEs in its structure. Therefore, allanite could act as the source for REEs3+ in titanite even though the domains are not texturally related. In rare cases, the garnet of this rock shows a high REE3+ content (dysprosium, Dy; Table 2), which could also have been sourced from allanite.
A high REE3+ content in both symplectites and coronal titanite presumably hints that allanite alteration started syn-deformationally and continued even after the deformation ended, resulting in a longer period for allanite alteration. This may also justify allanite being the most replaced mineral in the studied rock. As allanite disintegrated, heavy REEs such as Dy and Y probably got incorporated into the minerals owing to their smaller ionic radii (Centrella et al. Reference Centrella, Austrheim and Putnis2016). Like the spessartine content suggests ilmenite (/Ti-oxd) as one of the reactants for garnet and links the Amp–Grt domain to Mag (+ Ilm/Ti-oxd), similarly Y and Dy in these phases further adds allanite. Though there is no textural evidence to support that all these three domains interacted during metamorphism, compositional attributes strongly demonstrate the connection between these domains and suggest co-growth of Grt–Ttn in this rock. This link between the locally developed distinct replacing assemblages supports the argument that reaction textures do not essentially indicate chemical disequilibrium (Mengel & Rivers, Reference Mengel and Rivers1991; Onge & Ijewliw, Reference Onge and Ijewliw1996).
Such a redistribution of elements between coeval reaction sites was proposed by Carmichael (Reference Carmichael1969) in his pioneering work on metapelite rocks. Recently, Centrella et al. (Reference Centrella, Austrheim and Putnis2015, Reference Centrella, Austrheim and Putnis2016) proposed a very similar interpretation for their study and showed the balancing of mass locally during coupled replacement of two different minerals. To discuss the redistribution in this study, we chose some typical elements (Mn, Y, Dy) which indicate an obvious relationship between the different reaction sites. One reason for such a limited choice is related to the natural constraints imposed by the high alteration in the allanite grains. Syn-tectonic and post-tectonic replacement of allanite (as suggested by compositional aspects) implies that the mineral acted as a reactant in both stages. Therefore, the replaced allanite composition formed during syn-deformation could act as a reactant for phases that grew post-deformationally, and this transitional composition cannot be retrieved. However, this composition is essential to estimate the gain versus loss of REEs during titanite–garnet formation. Also, the allanite in these rocks is highly altered (see the rim composition in Table 3). This particularly made the mineral unlikely to yield a reliable composition stoichiometry as required for any rational analysis, and therefore, unfit to be used in the calculation. Considering these issues, we did not attempt to model a mass balance system involving all the elements from the three interconnected domains or a gain/loss calculation for REEs3+ as was conducted for Mn2+.
7.f. Analysis of the approach and results of pseudosection modelling and conventional thermometry
For pseudosection modelling, a realistic selection of effective reaction volume is crucial for interpreting the P–T conditions of metamorphism for reaction textures owing to their local development within the rock. This estimation is relatively straightforward when only one type of domain, including a closely associated reactant–product assemblage, is involved in the reaction. As discussed in Section 7.e, the metamorphic phases in this rock developed through the interaction between the Amp–Grt, Mag(+ Ilm/Ti-oxd)–Pl–Ttn and allanite zones. Amp, Pl, the oxide minerals and allanite all acted as reactants to form garnet–titanite as a product. Growth of product phases in the locally separated textural zones through chemical exchange between them suggests that these domains were in equilibrium during metamorphism. The co-growth of garnet and titanite suggests that they formed at the same P–T condition. Therefore, the effective reaction bulk composition used in the pseudosection modelling in this study needed to incorporate a proportion of minerals from all these three domains. We included plagioclase (∼10 mode %), amphibole (∼35 mode %), magnetite (∼15 mode %), exsolved ilmenite (∼2 mode %), allanite (∼10 mode %), epidote (∼5 mode %), quartz (∼10 mode %), garnet (∼3 mode %) and titanite (∼10 mode %) in the ratio they occur within the rock.
The modelled pseudosection faces certain limitations. Firstly, textural relationships and mineral compositions of product phases suggest that REEs released from allanite played a significant role in shaping their chemistry. Hence, the REE chemistry is likely to impact the P–T conditions under which the metamorphic assemblages were stabilized. The absence of an appropriate solution model involving REE chemistry in an activity–composition (a–x) calibration for allanite and other minerals imposes restrictions on assessing their influence on the overall stability of mineral assemblages at specific P–T conditions. Secondly, the a–x calibration of Green et al. (Reference Green, White, Diener, Powell, Holland and Palin2016) for metabasite is suitable for the effective reaction bulk composition calculated in this study considering minerals such as amphibole, plagioclase and oxides formed the garnet and titanite (see bulk rock chemistry in Fig. 7). But those models do not include manganese; however, calculation of the pseudosection without Mn would not be rational considering the high spessartine content in the garnet (23–29 mol %). This particular issue would not be of concern because garnet in this rock was formed by the disintegration of both amphibole and ilmenite, but the manganese in the garnet is typically sourced from ilmenite rather than amphibole (explained in Section 7.e). We have used the a–x calibration of White et al. (Reference White, Powell, Holland, Johnson and Green2014 a) for garnet and White et al. (Reference White, Powell, Holland and Worley2000, Reference White, Powell and Johnson2014 b) for ilmenite, and both the models involve manganese as a component.
However, the results of the pseudosection calculation are intriguing, as it successfully reproduces a mineral assemblage from the garnet and coronal titanite domain in a single field (marked with a yellow dotted line in Fig. 7). The field does not constrain the pressure but generally suggests a narrow temperature range of ∼525–550 °C for garnet and coronal titanite formation.
The amphibole–garnet thermometry calibrated by Ravna (Reference Ravna2000) suggests a very similar temperature to the modelled pseudosection of 563 ± 40 °C (Table 5). However, the high spessartine content in the garnet makes its composition unsuitable to be used in this thermometry. So, we excluded the results of Ravna (Reference Ravna2000) from our interpretation. As ilmenite took part (source of manganese) in the garnet-forming reaction, we have employed the ilmenite–garnet thermometry of Pownceby et al. (Reference Pownceby, Wall and O’Neill1991). The results are relatively higher (650–705 °C; Table 5), but the temperature range is comparable to the estimation derived from the amphibole–plagioclase thermometry (∼698 ± 29 °C; Table 5) of Holland & Blundy (Reference Holland and Blundy1994). Considering the result (and also the limitations) of the pseudosection and comparing it with the results derived from Holland & Blundy (Reference Holland and Blundy1994) and Pownceby et al. (Reference Pownceby, Wall and O’Neill1991), we suggest that the garnet and coronal titanite assemblage formed at ∼650–700 °C in the studied rock.
The modelled pseudosection did not generate any typical field that can explain the P–T conditions for the epidote-bearing assemblage, as no field contains a typical assemblage of Ep–Ttn–Qtz and Amp without garnet in Figure 7. This is understandable, as the assemblage was formed through amphibole breakdown only, and therefore, the effective reaction bulk (used in Fig. 7) estimated including other minerals such as magnetite, ilmenite, garnet, etc., along with amphibole would be an inadequate proxy to interpret the Amp → Ep–Ttn–Qz reaction assemblage.
7.g. Regional tectonic perspective in connection with the outcome of this study
The tectonics of northwestern India (Deb et al. Reference Deb, Thorpe, Kristic, Corfu and Davis2001; Torsvik et al. Reference Torsvik, Ashwal, Tucker and Eide2001 a,b; Pandit et al. Reference Pandit, Carter, Ashwal, Tucker, Torsvik, Jamtveit and Bhushan2003; Buick et al. Reference Buick, Clark, Rubatto, Hermann, Pandit and Hand2010; Bhowmik et al. Reference Bhowmik, Bernhardt and Dasgupta2010; Singh et al. Reference Singh, Waele, Karmakar, Sarkar and Biswal2010; Chatterjee et al. Reference Chatterjee, Roy Choudhury, Das and Roy2017; Tiwari & Biswal, Reference Tiwari and Biswal2019) plays an important role in the reconstruction of the Rodinia supercontinent (Dalziel, Reference Dalziel1991; Hoffman, Reference Hoffman1991; Moores, Reference Moores1991; Li et al. Reference Li, Zhang and Powell1996, Reference Li, Bogdanova, Collins, Davidson, De Waele, Ernst, Fitzsimons, Fuck, Gladkochub, Jacobs, Karlstrom, Lu, Natapov, Pease, Pisarevsky, Thrane and Vernikovsky2008; Radhakrishna & Mathew, Reference Radhakrishna and Mathew1996; Torsvik et al. Reference Torsvik, Smethurst, Meert, Van der Voo, McKerrow, Brasier, Sturt and Walderhaug1996; Weil et al. Reference Weil, Van der Voo, Mac Niocaill and Meert1998; Mezger & Cosca, Reference Mezger and Cosca1999; Torsvik et al. Reference Torsvik, Ashwal, Tucker and Eide2001 a,b; Powell & Pisarevsky, Reference Powell and Pisarevsky2002; Kröner & Cordani, Reference Kröner and Cordani2003; Pisarevsky et al. Reference Pisarevsky, Wingate, Powell, Johnson, Evans, Yoshida, Windley and Dasgupta2003; Malone et al. Reference Malone, Meert, Banerjee, Pandit, Tamrat, Kamenova, Pradhana and Sohl2008; Gregory et al. Reference Gregory, Meert, Bingen, Pandit and Torsvik2009). Studies from Aravalli Mobile Belt suggest a Grenvillian-age collisional orogen between the North Indian Block to the east and Marwar craton to the west (Deb et al. Reference Deb, Thorpe, Kristic, Corfu and Davis2001; Pandit et al. Reference Pandit, Carter, Ashwal, Tucker, Torsvik, Jamtveit and Bhushan2003; Bhowmik et al. Reference Bhowmik, Bernhardt and Dasgupta2010). There is another view, where the suturing between the Marwar craton to the west and the remaining part of India took place along the PSZ during mid Neoproterozoic time (∼820–810 Ma; Chatterjee et al. Reference Chatterjee, Roy Choudhury, Das and Roy2017, Reference Chatterjee, Sarkar, Roy and Manna2020).
Our study predicts syn-tectonic growth of Ep–Ttn–Qz followed by post-tectonic growth of euhedral garnet and titanite corona. The transformation from Ep–Ttn–Qz to Grt in the syn- to post-deformational stages while replacing amphibole presumably suggests a change in conditions at the later stage of metamorphism. In general, during tectonic activity, deformation occurs under conditions of rising temperature before reaching the peak temperature during prograde metamorphism (Brodie & Rutter, Reference Brodie and Rutter1987). Therefore, the conversion of the product phase from syn-tectonic Ep–Ttn–Qz assemblage to post-tectonic garnet–titanite could be related to attainment of peak temperature conditions (∼650–700 °C; Section 7.f) following cessation of deformation during metamorphism of the terrane.
Correlation of the results of this study with published literature suggests that the metamorphic mineral growth was presumably related to the event that developed the regional fabric of the SDFB along the western margin of the belt (Heron, Reference Heron1953; Gupta et al. Reference Gupta, Arora, Mathur, Iqbaluddin, Prasad, Sahai and Sharma1980, Reference Gupta, Mukhopadhyay, Fareeduddin and Reddy1995, Reference Gupta, Arora, Mathur, Iqbaluddin, Prasad, Sahai and Sharma1997; Roy & Jakhar, Reference Roy and Jakhar2002; Chatterjee et al. Reference Chatterjee, Roy Choudhury, Das and Roy2017, Reference Chatterjee, Sarkar, Roy and Manna2020). Retainment of the delicate micro-textural imprints like corona and symplectite in the meta-granite suggests that the rock is unlikely to have witnessed any significant deformation after the textures formed during metamorphism (Wayte et al. Reference Wayte, Worden, Rubie and Droop1989; Lang & Gilotti, Reference Lang and Gilotti2001). From the study area, Chatterjee et al. (Reference Chatterjee, Roy Choudhury, Das and Roy2017, Reference Chatterjee, Sarkar, Roy and Manna2020) reported ∼820–810 Ma metamorphism, and they suggested that the pervasive fabric in the western part of the SDFB had formed during reverse shearing of the PSZ. The studied meta-granites occur in close association with the metapelites examined by Chatterjee et al. (Reference Chatterjee, Roy Choudhury, Das and Roy2017). Also, the temperature estimated in this study matches their interpretation for the metamorphism of meta-pelitic rocks (∼670 °C). A ∼1 Ga magmatic age for granitic rocks has been reported by several studies on the SDFB (Tobish et al. Reference Tobisch, Collerson, Bhattacharya and Mukhopadhyay1994; Deb et al. Reference Deb, Thorpe, Kristic, Corfu and Davis2001; Pandit et al. Reference Pandit, Carter, Ashwal, Tucker, Torsvik, Jamtveit and Bhushan2003; Dharma Rao et al. Reference Dharma Rao, Santosh, Kim and Li2013; Chatterjee et al. Reference Chatterjee, Roy Choudhury, Das and Roy2017; Zhao et al. Reference Zhao, Pandit, Wang and Xia2018). However, no detailed petrological information is available on these rocks from the study area. The age derived from the zircon data of this study suggests a 988.8 ± 8.8 Ma age for magmatic crystallization of the meta-granite. Combining the results of the present study with published literature, we propose that the studied meta-granite crystallized at ∼1 Ga and was deformed and metamorphosed in a later tectonic event related to suturing of the SDFB and Marwar craton along the PSZ (∼820 Ma; Chatterjee et al. Reference Chatterjee, Roy Choudhury, Das and Roy2017). The preferential alignment of the Ep–Ttn–Qz symplectite along the foliation direction in the meta-granite is likely to have formed during the reverse shearing of the PSZ followed by garnet and coronal titanite formation during subsequent metamorphism at ∼650–700 °C that outlasted the deformation. According to our knowledge, this is the first communication detailing the petrological evolution of the meta-granite from the studied area of the SDFB.
8. Summary
In interpreting the petrological evolution of rocks, proper assessment of mineral paragenesis portrays a pivotal part for building up the P–T–X history. In this study, the compositional attributes linked phases from different domains, which were instrumental in depicting texturally unconnected coetaneous reactions and deciphering the equilibrium metamorphic assemblage. The implication of this connection is intriguing, as it suggests that the locally developed reaction textures were in chemical equilibrium.
The texture of the meta-granites suggests the replacement of the primary minerals occurred in two stages. Amphibole was replaced sequentially by Ep–Ttn–Qz symplectite followed by garnet. Euhedral garnet grains and titanite corona are post-tectonic to the regional fabric, whereas the symplectite assemblage formed during deformation. Allanite replacement presumably initiated during deformation but eventually outlasted the event. Elements generated through the disintegration of reactants in different domains were redistributed between the metamorphic phases growing in texturally unconnected sites. This dissolution–transportation–precipitation process played a crucial role in shaping the composition of the metamorphic phases and maintaining chemical equilibrium between domains. We propose a synchronous functioning and reorganizing of components between the texturally separated domains (Fig. 9c) through the following reactions during metamorphism:
-
Mag + Ilm + Pl + REE3+ → Ttn + Mn2+
-
Amp + Mn2+ → Grt
-
Allanite → altered mineral + REE3+
Acknowledgements
UD and SMC acknowledge the financial support provided by CSIR, India (Scheme No. 24(0359)/19/EMR-II) and SERB, India (Project No. CRG/2019/004573). SMC acknowledges the Department of Science and Technology, New Delhi (India), for funding the Extra Mural Research project (Scheme no.: EMR/2015/000204). UD acknowledges the DST FIST facility at the Department of Applied Geology, IIT (ISM) Dhanbad. Kathryn Goodenough, the editor and Jacqueline Halpin, the associate editor, are greatly acknowledged. Critical reviews by two anonymous reviewers helped to improve the clarity of the manuscript.
Appendix: Molar volumes of phases
The molar volume (VS) of the phases has been calculated that are used in this study are calculated at 7 kbar, 650 °C, the P–T condition estimated by Chatterjee et al. (Reference Chatterjee, Roy Choudhury, Das and Roy2017). In the computer program Perple_X_6.8.3 (Connolly, Reference Connolly2005 updated in 2018), the thermodynamic data of Holland & Powell (Reference Holland and Powell2011, updated in 2012) have been used to determine molar volume.

VPl = XNa*VAlbite + XCa*VAnorthite.
VGrt = XMg*VPyrope + XFe+2*VAlmandine + XCa*VGrossular + XMn*VSpessartine.